Report Overview
 This Freedonia industry study analyzes the $1.1 billion US market for gutter guards. It presents historical demand data (2012, 2017, and 2022) and forecasts (2027 and 2032) as well as annual data for years 2019-2026. Unit demand and value demand data is shown for gutter guards by material (steel, aluminum, plastic, copper), product type (screens & meshes, hoods & covers, foams & bristles) and market (new, improvement, and repair demand in both residential and commercial applications). The study also evaluates company market share and competitive analysis on industry competitors including Cornerstone, Gibralter, Leaf Home Solutions, and OmniMax.
Featuring 50 tables and 34 figures – available in Excel and Powerpoint! Learn More
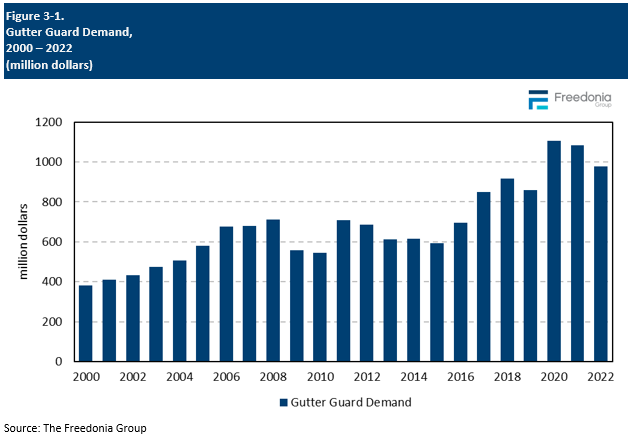
US gutter guard demand is forecast to grow 1.3% annually to 360.1 million linear feet in 2027. While this rate of growth is relatively slow, it will be somewhat faster than gutters themselves, and it follows elevated levels of gutter guard demand in 2020 and 2021 and a subsequent moderation sales in 2022. Going forward, gains will be primarily supported by an increase in residential improvement and repair activity in the latter part of the forecast period.
In value terms, demand is expected to grow 3.0% annually to $1.1 billion, supported by rising prices for metal gutter guards, which account for the majority of gutter guard sales.
Versatility & Ease of Use Support Demand for Plastic Gutter Guards
In real terms, plastic gutter guards will continue to increase in popularity and will account for nearly 25% of absolute gutter gard gains, boosted by their:
-
versatility, as they are available in all three product types and can be used with any gutter material
-
light weight, making them popular among homeowners partaking in DIY installations
Real demand for plastic gutter guards will also be supported by their low price compared to aluminum or steel gutter guards, which makes them more attractive to homeowners looking to limit the cost of their gutter guard installations.
Meshes & Screens to Remain Most Popular Gutter Guard Product
Meshes and screens will remain the most popular type of gutter guard, accounting for nearly half of all gutter guard demand in linear feet terms. Meshes and screens will maintain their share of the market due to their light weight – which makes them easy to handle and install – and their wide availability in a broad range of sizes and shapes, so consumers can generally find a design that can fit on top of their gutters.
Rainwater Harvesting & Wildfire Codes Serve as Opportunities for Gutter Guard Sales
Rainwater harvesting – which involves the collection and storage of rain – has become increasingly popular in parts of the US that are prone to drought or have issues with poor water quality. Gutter guards can serve a crucial role in this process, straining out leaves and other debris before the water is diverted into storage systems such as rain barrels.
Wildfire codes in some US states also offer opportunities for gutter guards. For example, both California and Colorado require that flammable debris be kept out of gutters. While the codes do not mandate gutter guard usage, these products offer a safer and – over the lifespan of the product – less expensive means of keeping gutters clean when compared to DIY gutter cleaning or the use of a gutter cleaning service.
Historical Market Trends
Gutter guards go on top of existing gutters and are dependent on gutter installation. For the most part, sales of gutters are dependent upon new building construction and a relatively predictable replacement cycle for existing buildings, with the residential aftermarket accounting for the vast majority of sales.
However, spending on these products can occur outside of the replacement cycle, due to:
-
the need to repair or replace gutters and downspouts in case of damage – for most home and business owners, this is not a discretionary expense
-
outbreaks of severe weather (such as hurricanes and tornadoes) that can cause damage to structures across a wide area – demand for gutter systems may rise even if overall construction spending contracts during that period
-
the modest cost of gutter replacement compared to that of other home improvement projects – homeowners looking to upgrade the appearance or function of their homes may choose to do by installing new gutters, along with gutter guards
Inflation & Pricing Trends
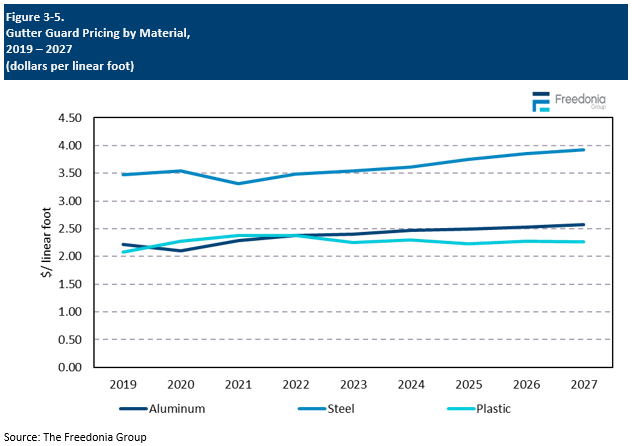
The pricing environment for gutter guards is quite varied, reflecting the wide variety of materials utilized in these products and the different pricing pressures encountered by each material:
-
Aluminum is the least expensive metal available for gutter guard fabrication, while steel costs more.
-
Plastic gutter guards have historically constituted the lowest cost option – largely due to the low cost of PVC relative to most metals – although they surpassed aluminum gutter guards during the pandemic due to spikes in resin pricing during that period.
-
The most expensive products are fabricated from copper and zinc – due to the higher base cost of these metals compared to aluminum and steel. These materials are used primarily in applications where aesthetics are a primary concern and are frequently embossed or have other value-added characteristics
The average gutter guard price is lower than those of gutters and downspouts due to a much higher concentration of low-cost plastic products like foams, bristles, and meshes. However, some gutter guards can be expensive, such as those that nearly completely cover the top of the gutter and custom-designed to meet the exact dimensions of the gutter system to which they are attached. In some cases, these systems can cost as much or more than the gutter and downspout system itself.
Price changes for gutter guards are generally driven by fluctuations in the cost of underlying raw materials, such as plastic resin and metal. However, pricing from 2020 to 2022 was altered by the COVID-19 pandemic, which created a variety of shortages and supply chain issues that led to a sharper increase in prices in 2021 and 2022.
As many of the issues have been resolved, the average price of gutter guards per linear foot is forecast to decelerate from the 2017-2022 period. Going forward, price growth will derive mainly from ongoing increases in some raw material prices, most notably aluminum and steel.
Development of One-Piece Gutter Systems
One-piece gutter systems combine both a gutter and a gutter guard into a single unit. For the purposes of this report, one-piece gutter systems are classified as gutters, so they serve as competition for gutter guards.
While various forms of one-piece gutter systems have been around since the 1900s, widespread commercial use began in 1997 with the development of K-Guard. Since then, one-piece gutter systems have grown in popularity, especially with homeowners who are replacing old gutters and also wish to add gutter guards.
While the growing popularity of one-piece gutter systems will offer some competition to gutter guards, there are some restraining factors that will limit their usage:
-
One-piece gutter systems are more expensive than either gutters or gutter guards. Many homeowners who wish to replace their gutters may hold off on installing gutter guards until later to avoid high upfront costs.
-
One-piece gutter systems require the replacement of gutters, so those homeowners with well-functioning or relatively new gutters will opt to simply install gutter guards rather than installing an entirely new system.
- If the gutter guard that is part of the system is damaged, the entire system (including the gutter itself) will need to be replaced.