Report Overview
Awareness of environmental and health hazards continues to drive shift in product mix.
This Freedonia industry study analyzes the $2.9 billion US home and garden pesticide industry. It presents  historical demand data (2011, 2016, and 2021) and forecasts (2026 and 2031) by product (insecticides, herbicides, fungicides, and other pesticides) and application (household insect control, household insect repellents, other household applications, lawn care, garden care, other lawn and garden applications). Annual data is also provided as well as historical market trends. Demand is provided in US dollar terms. Also provided are demand by formulation and sales by retail distribution channel. Pesticide active ingredient trends are also addressed. The study also evaluates company market share and the competitive strategies of key industry players such as Bayer, SC Johnson, Scotts Miracle-Gro, Spectrum Brands, and Woodstream. Consumer survey data and analysis is also included.
Featuring 80 tables and 31 figures – available in Excel and Powerpoint!
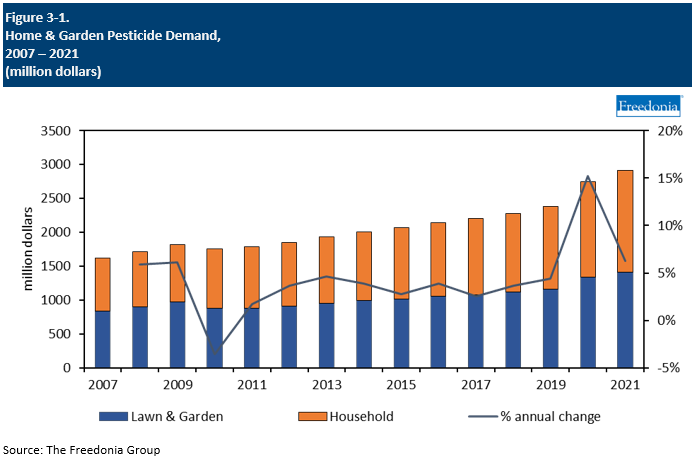
Demand for home and garden pesticides is expected to grow less than 1.0% per year through 2026 to $3.0 billion, with growth coming mainly from increases in average prices. Demand in real terms will decline from high levels in 2020 and 2021 when gardening and landscaping activity surged but will remain above pre-pandemic levels as some of the new customers gained during the pandemic will continue to participate in lawn and gardening activities.
Market value gains and an increase in average prices will be due primarily to a shift in product mix toward higher value products, supported by product development that improves efficacy and ease of use, and greater interest in products that are perceived as being safer, such as biopesticides.
Larger Consumer Base Generates Recurring Demand for Home & Garden Pesticides
The COVID-19 pandemic led to a surge in DIY gardening and lawn care activity as consumers spent a greater amount of time at home and used that time to engage in new hobbies and improve their outdoor spaces. As consumers increasingly revert to pre-pandemic behaviors, some households will cease to engage in these pandemic-related hobbies. However, a number of consumers will continue to manage their own gardening or lawn care maintenance, aided by the continued popularity of hybrid work models that allow consumers more time at home.
Development of Safer Pesticides Key to Boosting Value Gains & Usage
Product development that improves safety while maintaining efficacy will be crucial to gaining additional revenue for home and garden suppliers. While efficacy or ease of use will always be at the forefront of product development, consumers also desire options that they feel comfortable using around their homes and families. Products that use biopesticides or active ingredients that have a better safety profile or face less scrutiny will continue to grow their share of the market. Additionally, products that offer safer ingredients will help drive adoption among holdouts going forward, particularly discerning consumers.
Glyphosate to Be Phased Out of Roundup Consumer Products in 2023
In July 2021, Bayer announced it would phase out the herbicide glyphosate from Roundup products used in the residential lawn and garden market and replace it with a different active ingredient in 2023. Historically, glyphosate has been one of the most popular herbicide active ingredients in home and garden pesticides so this will have a significant impact on the market. With its removal from Roundup products, demand for glyphosate will decline significantly, although it will still find use in some other pesticide brands.
Market Patterns
The US pesticide market overall can be volatile, although much of that volatility is attributable to the large agricultural sector. In the home and garden segment, pesticide demand tends to be more stable, although it is still subject to fluctuations in weather, demographics, consumer spending, and residential building activity.
- The overall market is mature and relatively slow growing in volume terms, with price changes due to product mix creating much of the longer term market trends.
- Greater awareness of environmental and health hazards has historically been one of the strongest drivers of demand for safer products, leading to a shift in product mix.
Specific factors causing year-to-year changes in home and garden pesticide demand include:
- the health of the US economy and levels of disposable income
- levels of new residential building construction
- average lot size and landscaping trends
- consumer preferences regarding DIY versus professional lawn care services
- the popularity of fruit and vegetable gardening
- concerns about disease transmission via insects such as mosquitoes or ticks
- weather patterns
- the popularity of nonchemical pesticide alternatives
In addition, product mix and product pricing can have a significant impact on growth in market value, especially when products come off patent. Furthermore, inflationary pressures brought on by the large economy caused value gains in 2021.
 Active Ingredient Costs
While active ingredients typically constitute a small percentage of a typical consumer pesticide product formulation, their cost is still a factor in product formulation choices and can have an impact on market value and product mix.
Prices for pesticide active ingredients are affected by a variety of factors, including:
- regulatory requirements (e.g., registration and testing)
- raw material prices
- patent protection
- competition among pesticide active ingredients
Average active ingredient prices in the home and garden pesticide market are projected to increase 1.9% per year to $5.65 per pound in 2026. The dominance of off-patent products will limit pricing growth. For instance, 2,4-D has been off-patent for decades as it was first registered in the US in 1948; as a result, 2,4-D producers face significant price competition from producers of low-cost generics.
However, rising demand for higher priced actives, including niche products, will boost average prices to an extent.
While pricing in previous years was relatively steady, prices surged in 2021 and 2022 due to increased demand and a range of supply chain issues. Prices are expected to decrease as supply chain issues ease and as demand decreases due to the removal of glyphosate from Roundup in 2023.
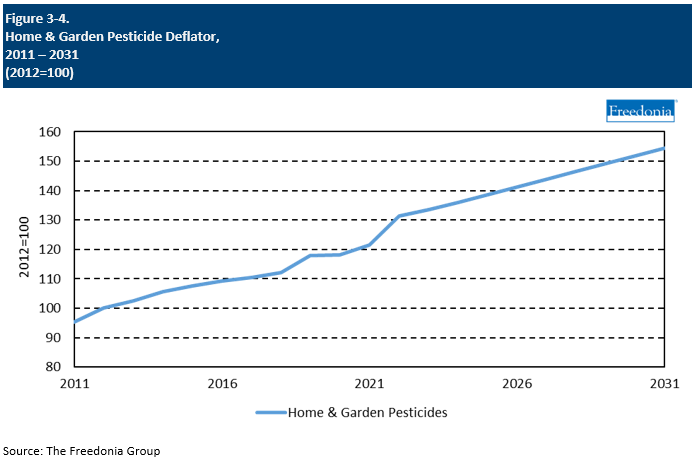
Home & Garden Pesticide Pricing & Real Growth
Home and garden pesticides average prices are expected to climb 3.1% per year through 2026, an acceleration from the previous five-year period. Price growth in the near term resulted from inflation- and supply chain-related issues in 2021 and 2022:
- Strong demand for pesticide products, coupled with temporary shutdowns of manufacturing facilities in 2020, led to supply shortages and overwhelmed supply chains in 2020 and 2021.
- This was compounded by rising shipping costs and higher fuel prices.
- Some of these issues carried into 2022, further elevating pricing.
Price growth through the forecast period will also be supported by the use of higher value formulations and packaging. For example:
- Biopesticides, which are preferred due to their more environmentally friendly formulations, will see increasing use.
- An increasing number of products are offered with battery-powered sprayers built into the packaging.
Despite the healthy growth expected in average prices, market value for home and garden pesticides is expected to rise less than 1.0% per year through 2026. In real terms, demand will decline as consumer usage of these products normalizes from the high levels of demand in 2020 and 2021.
While active ingredients typically constitute a small percentage of a consumer pesticide formulation, which limits the impact of material price fluctuations on consumer products, pricing for materials and the costs associated with acquiring them can affect product pricing.