Report Overview
Featuring 77 tables and 52 figures – now available in Excel and Powerpoint! Learn More

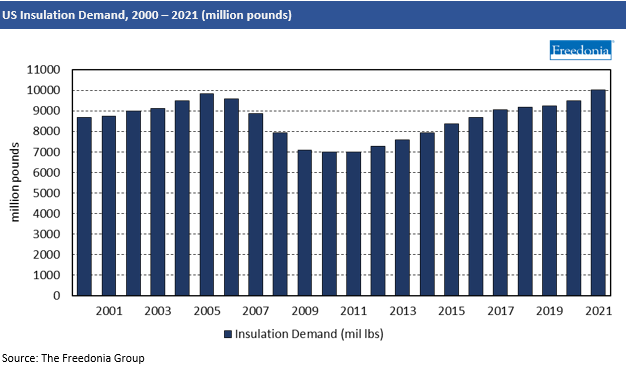
Demand for insulation in the US is forecast to increase 1.9% annually to 10.4 billion pounds in 2025 from a high 2020 base, which resulted from an increase in home renovation and new home construction during the pandemic. While demand will expand more quickly in value terms – boosted by price increases for key raw materials such as plastic and mineral wool – moderating residential building construction beginning in 2022 will dampen the outlook.
Key factors that will support insulation market demand through 2025 include:
- rebounding commercial construction activity, which fell sharply during the COVID-19 pandemic
- stringent fire safety policies and increasing energy efficiency codes throughout the country, which often call for greater use of insulation in buildings
- strong rebounds in transportation equipment production
- increasing production of HVAC equipment, industrial equipment, and appliances, particularly refrigerators and freezers
Plastic Foam & Mineral Wool Insulation Materials Continue to Gain Share from Fiberglass
Fiberglass will continue to account for the largest share of insulation demand by volume because of its relative ease of installation and cost effectiveness (i.e., it provides good R-values at a relatively low cost). However, its market share will decline through 2025, primarily due to increased competition from foamed plastic and mineral wool caused by the drive toward increasing insulation and improving air sealing in new residential buildings:
- Foamed plastic offers more R-value per inch than fiberglass.
- Both foamed plastic and mineral wool products can be used between the framing and cladding to provide an air barrier.
Sharp Polystyrene Price Increases Boost Market Value of Plastic Foam
Prices for plastic foam insulation are expected to expand more quickly than those of any other material. Polystyrene prices have risen above the average rate of inflation due to government regulations aimed at eliminating the use of HFC-134a in XPS blowing agents and plant closures that have constricted supply. Though prices for foamed plastic are expected to remain elevated, the material will remain competitive against other insulation due to its ease of installation, which is important in a tight labor market.
Rebounds in Commercial Construction & Manufacturing to Boost Nonresidential Markets
While the residential market will continue to account for the largest share of demand gains through 2025, faster growth is expected in other markets, such as commercial construction and industrial and plant equipment. These markets will be boosted by rebounding commercial building construction and manufacturing activity as the economic effects of the COVID-19 pandemic lessen and businesses increase investment in new facilities and capacity expansions. Additionally, resumption of travel will boost insulation demand growth in transportation equipment.
Historical Trends
The US insulation market is cyclical due to its relationship with building construction, although the retrofit market is less volatile than the new construction market:
- The new construction market generally tracks the cyclical growth pattern of new housing activity, though trends in the smaller new commercial construction market also impact insulation sales.
- Growth in the retrofit market is fairly consistent year over year, as retrofit of attics, ceilings, exterior walls, and other areas is often necessary for a number of reasons, such as:
- updated building codes requiring use of more or a different type of insulation
- mold
- weather damage
- products reaching the end of their useful lifespans (while many insulation products can last for several decades if undamaged, fiberglass batts typically begin to break down after 15 years)
- Additionally, the US’ robust home improvement culture supports retrofit sales, as large-scale projects such as room additions often require insulation.
- In both new and retrofit markets, gains in recent years have been boosted by increasingly strict building codes requiring greater use of insulation to improve energy efficiency.
In other insulation markets – including industrial and plant equipment, HVAC/air distribution, appliances, and transportation equipment – growth follows that of the domestic manufacturing output of these products, which often involve use of thermal and/or acoustic insulation. Increasing industry standards for quieter appliances and HVAC equipment continue to support demand for acoustic insulation in these markets, while rising worker safety standards in the industrial sector promote use of insulation in plant equipment. The ongoing expansion of the aerospace sector is a key driver of insulation demand growth in the transportation equipment market.

Foreign trade does not account for a major share of either US demand or US production of insulation, a result of relatively high transportation costs for bulky, low-value materials. Through 2025, insulation production is projected to rise 4.6% annually to $12.7 billion, in line with demand. While sustained growth in domestic insulation demand will continue to restrict the need for US suppliers to find overseas markets for their products, the trade surplus in insulation products is expected to widen through 2025, boosting export sales opportunities.
The US exports insulation to a number of countries, with Canada accounting for the largest share. Other markets include Australia, Brazil, China, Germany, Mexico, South Korea, and the United Kingdom.
As most of the raw materials for insulation are available domestically and with the commodity-like pricing in the industry, it is difficult for foreign producers to make a substantial impact on the US market because of the cost involved in shipping insulation great distances. However, the US does import insulation from a number of countries:
- Canada is the leading exporter of insulation to the US, with fiberglass accounting for the largest share of these exports.
- Mexico is the second largest exporter of fiberglass insulation to the US, taking advantage of Mexico’s lower labor costs to inexpensively manufacture loose fill fiberglass and fiberglass batts and blankets.
- Other countries that supply insulation to the US include China, Germany, Japan, the Netherlands, and the United Kingdom.
This study analyzes US supply of and demand for insulation. Historical data (2010, 2015, and 2020) and forecasts for 2025 and 2030 are provided for US insulation demand by material, market, and region. Data are provided in a variety of units, including dollars, pounds, square feet, and square feet of R-1 equivalent. Demand in value terms is shown at the manufacturers’ level and excludes distributor and retailer markups.
Both thermal and acoustic insulation are included in the scope of this study.
Materials are broken out by product form and, for foamed plastics, by type of resin. Additionally, mineral wool and cellulose are broken out by type:
- fiberglass:
- batts and blankets
- loose fill
- rigid board
- roof deck, pipe and duct wrap, and other product forms
- foamed plastic:
- rigid polyurethane and polyisocyanurate (PUR/PIR) board
- spray polyurethane foam (SPF), including open-cell and closed-cell types
- extruded polystyrene (XPS)
- expanded polystyrene (EPS), including graphite polystyrene
- others foamed plastics (e.g., elastomeric, phenolic, polyolefin, melamine)
- cellulose:
- blown-in (also includes dense-packed cellulose insulation)
- spray-applied
- mineral wool (including slag wool and rock wool):
- batts and blankets
- loose fill
- felt, specialty, and other mineral wool products
- reflective insulation and radiant barriers
- other materials (e.g., vacuum insulation panels, aerogels, perlite, vermiculite, cementitious foam, Icynene foam)
Granulated mineral wool used in ceiling tiles is not included in the scope of this study.
The major market segments analyzed are:
- residential buildings (e.g., single-family, including manufactured homes, and multifamily)
- commercial buildings (including, office, retail, and lodging; institutional; and industrial buildings)
- industrial and plant equipment (e.g., power generation, oil and gas, petroleum refining, chemicals, food and beverages, pharmaceuticals)
- HVAC/air distribution equipment (including residential, commercial, and heating and air ducts)
- appliances (e.g., refrigerators, freezers, ovens, dishwashers, clothes washers and dryers)
- transportation equipment:
- motor vehicles (cabins, engines)
- aerospace equipment (fuselages, air ducts)
- ships and boats (hulls, cabins)
- railroad equipment (railcars, insulated cars)
- other insulation markets, including coolers and thermoses, nonbuilding construction, packaging, furniture, bedding, clothing, and off-road equipment
The residential and commercial building markets are further segmented by project type (i.e., new building and retrofit) and by building type.
Demand for insulation is also broken out by US geographic region and subregion.