Report Overview
What are big influencers in the roofing underlayment?
-
Extreme weather events
-
Changing climate conditions
This Freedonia industry study analyzes the 203.5 million squares US roofing underlayment industry. It presents historical demand data (2012, 2017, and 2022) and forecasts (2027 and 2032) by product (asphaltic and synthetic), by market (residential and commercial), by application (new and reroofing), by installation method (self-adhesive and mechanically attached), by barrier property (water-resistant and waterproof) and US geographic region. The study also evaluates company market share and competitive analysis on industry competitors, including GAF Materials, Owens Corning, Atlas Roofing, Polyglass USA, and CertainTeed.
Featuring 137 tables and 41 figures – available in Excel and Powerpoint! Learn More
US demand for roofing underlayment is forecast to increase less than 1.0% per year, reaching 208 million squares in 2027 – a sharp deceleration from the growth seen between 2017 and 2022. This slowdown is largely attributable to a decline in conventional housing starts that began in 2022 and is expected to continue through 2024, with sluggish growth throughout the remainder of the forecast period. Demand for roofing underlayment is closely linked to that of roofing as a whole, particularly in steep-slope materials; as roofing demand has started to fall, so too has demand for roofing underlayment.
In value terms, roofing underlayment demand is expected to remain flat at $1.7 billion in 2027. This reversal in rapid growth stems from the high material prices seen in the base period of 2022, in conjunction with expected price moderation.
Shifts in Product Mix Will Impact Overall Underlayment Pricing Levels & Trends
As synthetic underlayment has taken market share away from asphaltic products – the former increased from a 51% share in 2017 to 64% in 2022 – average underlayment product prices have increased. Following near-term price moderations, this trend is expected to resume. Synthetic underlayment has historically been costlier than asphaltic types, and the rising prevalence of building codes and regulations that call for more durable underlayments will generally boost overall price levels over the long term (durability usually equates with underlayments with thicker layers).
Waterproof and self-adhesive products are also gaining market share, and they are usually more expensive than water-resistant and mechanically attached underlayment. Self-adhesive underlayments allow contractors to complete roofing jobs in less time; with the ongoing shortage of trained installers, it is projected that these types of underlayments will continue gaining market share into the near future.
Roofing Underlayment Innovation Will Prioritize Sustainability & Long-Term Performance
Rising concern over extreme weather events and changing climate conditions will influence future developments in roofing underlayment. Innovations will focus on increasing durability and reducing energy consumption and waste. Increasing roof durability, in particular, reduces both maintenance costs and waste and significantly limits the environmental impact associated with roof replacement. In addition, current building codes and regulations (and those that are likely to be enacted in the future) will encourage the adoption of roofing underlayment that meets sustainability and energy efficiency requirements because homeowners and legislatures are increasingly concerned with the environmental impact of construction materials.
Historical Market Trends
Demand for roofing underlayment is entirely dependent on overall demand for roofing, as underlayment is only installed on a structure during roof construction, repair, or reroofing:
-
Roofing underlayment demand tends to most closely track residential building construction, as the majority of residences have steep-slope roofs and are required by building codes to have roofing underlayment.
-
Some nonresidential structures have an underlayment to provide improved protection against leaks and tears, which supports underlayment demand in commercial construction applications.
Other factors that impact demand for roofing underlayment include:
-
trends in home values and financing requirements, which impact the ability of homeowners to take out home equity loans used for home improvement projects such as reroofing
-
levels of storm activity, including hurricanes and tornados, which cause higher than normal levels of damage and spikes in reroofing activity
-
levels of office and retail building construction, as these structures resemble residences and are often feature steep-slope roofs
-
trends in building sizes, as larger structures have greater roofing area
-
trends in raw material costs, which impact levels and growth in market value
-
the enactment of more stringent building codes, such as those requiring the installation of ice and water barriers along roof edges – in addition to the underlayment applied before the installation of the roofing
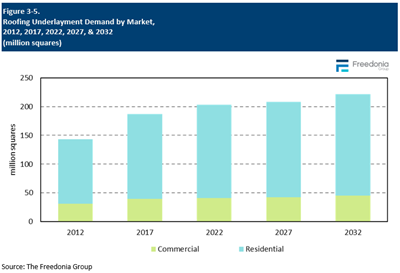
Markets Overview
Demand for roofing underlayment is closely linked to that for roofing, as underlayment is frequently a part of roof installation projects:
-
While not all roofs are installed with underlayment, building codes in nearly all US code jurisdictions mandate the use of underlayment in structures with steep-slope roofs. This supports roofing underlayment demand in the residential market, as the vast majority of homes in the US are single-family units with steep-slope roofs.
-
Roofing underlayment sees much less frequent use in nonresidential buildings with low-slope roofs. Underlayment is seldom installed on buildings with built-up roofing systems composed of multiple bituminous roofing membranes or single-ply roofing materials, such as thermoplastic polyolefin (TPO) or ethylene propylene diene monomer (EPDM).
Demand for roofing underlayment is expected to grow at an annual average pace of less than 1% to 208 million squares in 2027. The residential market drives demand and will see advances akin to the market as a whole, reaching 165 million squares in 2027:
-
After hitting a cyclical peak in 2021, new conventional housing starts are expected to decline through the forecast period. However, single-family housing starts are forecast to see some growth through 2027, thereby buoying demand.
-
A slowdown in residential reroofing activity, primarily attributable to the surge in reroofing activity in 2020 and 2021 and increasing use of more durable roofing materials, will limit future growth opportunities in reroofing applications.
Demand for roofing underlayment in the commercial market is forecast to advance slightly more quickly (though from a smaller base) to 43 million squares in 2027. Growth will be supported by:
-
increasing use of metal roofing in commercial structures, as underlayment is often employed to minimize the buildup of moisture between roofing materials and roof decks
-
the rising use of steep-slope elements in commercial structures to create more attractive exteriors, as underlayment is frequently mandated by building codes in these instances
Barrier Properties (Waterproof vs. Water-Resistant)
Roofing underlayment can be characterized as being either:
-
water-resistant (i.e., largely impermeable to moisture penetration)
-
waterproof (i.e., which is completely impervious to moisture)
Waterproof underlayment – which has more than doubled over the past decade – will continue to expand its market share for multiple reasons, key among them being the introductions of:
-
synthetic underlayment made with self-wicking polymer formulations that automatically seal holes made by the insertion of fasteners
-
polymer-modified asphalt formulations that offer superior moisture resistance and self-wicking properties
-
more stringent building codes
-
More coastal areas mandate use of waterproof barrier membranes at the eaves and around perforations in the roof surface to inhibit leaks and minimize water damage during outbreaks of severe weather.
-
Waterproof underlayment that minimizes the formation of ice dams (that cause leaks) are becoming more common among code jurisdictions in the northern half of the US.
The rising popularity of waterproof barriers will continue to have a negative effect on water-resistant product demand. However, sales of these products will be sustained by:
-
the fact that in parts of the US, such as the more arid Southwest, excessive moisture is of minimal concern and water-resistant products are more than sufficient
-
the generally lower cost of water-resistant underlayment compared to waterproof types
-
builders and architects attempts to reduce exterior moisture by using water-permeable synthetic underlayment to help vent structures, including installation of underlayment on commercial buildings with low-slope roofs that otherwise would not require it
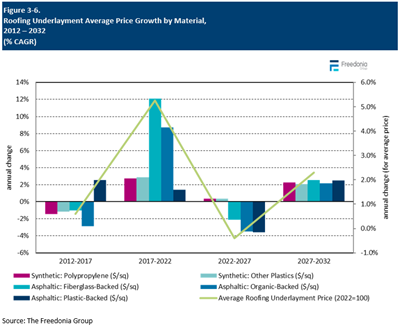
Pricing Patterns
Pricing for roofing underlayment products is impacted by a variety of factors, including:
-
product availability
-
energy and raw material costs, especially the prices of crude oil and natural gas, which are used to make asphalt and plastic resins
-
labor shortages at manufacturing plants, which affect production schedules, can lead to product shortages and cause shifts in product mix to higher value products, all of which can drive up prices
-
transportation costs
Shifts in the mix toward more or less expensive products have also impacted overall pricing levels and trends:
-
Synthetic underlayment has historically been costlier than asphaltic types, so the average product price goes up as the market shifts toward those products.
-
Increasing use of thicker underlayments with enhanced durability can boost overall price levels, as these underlayments are sold at higher price points than standard products. For example, in the synthetic underlayment segment, price increases come as manufacturers offer more durable products, such as those with self-sealing properties or tear-resistant backings.
-
Waterproof and self-adhesive products – which are seeing gains in market share – are usually more expensive than water-resistant and mechanically attached underlayment.
Overall, prices for synthetic underlayment will grow slightly while those of asphaltic products fall:
-
The supply of polypropylene resins – the most commonly used plastic resins in synthetic underlayment – was affected by the supply crisis spurred by COVID-19, so prices of these materials did rise rapidly from 2020 to 2022. Due to this rapid rise in prices, costs of polypropylene and other raw materials used to make synthetic underlayment are forecast to increase only modestly throughout the forecast period.
-
Asphaltic products will post rapid price declines, as the costs of petroleum products – including asphalt – are expected to decline from their high 2022 base.