Report Overview
 What siding type will gain share in the commercial market?
This report examines the size and growth of the US siding industry in unit and value terms, and analyzes key trends by product (vinyl, fiber cement, stucco, engineered wood, brick, concrete and metal panels), market (new and residential renovation and new and commercial renovation), and region. Historical data are provided for 2012, 2017, and 2022 with forecasts for 2027 and 2032. Also provided is an analysis of key industry players and their market shares.
Featuring 155 tables and 75 figures – available in Excel and Powerpoint! Learn More
Read the Vinyl Siding blog!
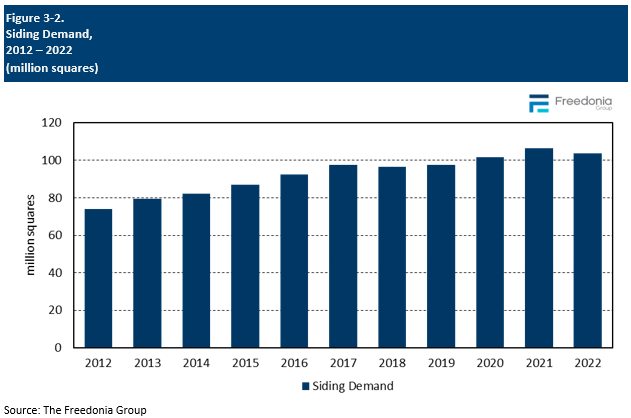
Siding demand in the US is projected to increase at an annual average rate of less than 1.0% to 106.8 million squares in 2027. Growth in squares will be restrained primarily by a decline in conventional housing starts that began in 2022 – following significant increases in 2020 and 2021 – and is expected to continue through 2024, with sluggish gains thereafter. However, demand will be lifted by the commercial market returning to growth following pandemic-related declines, boosted by the construction of new institutional, office, and industrial buildings.
Demand value is expected to increase 1.4% annually to $16.0 billion in 2027, a significant deceleration from the 2017-2022 period. Prices for most siding products will moderate in the wake of the spikes that were precipitated by supply chain issues and high raw material costs.
Vinyl to Gain Market Share After a Decade of Declines
Vinyl siding is forecast to gain market share through 2027 at the expense of fiber cement and engineered wood, due to advancements made by suppliers to the performance and appearance of vinyl siding. While fiber cement was the second most used siding material in 2022, its penetration rate will moderate through the forecast period due to the product’s growing maturity and the improving quality of competitive materials like vinyl siding. Vinyl will also take market share from engineered wood due to improvements in the material’s aesthetics, which allow vinyl to mimic the appearance of natural wood, along with the material’s greater durability and fewer maintenance requirements.
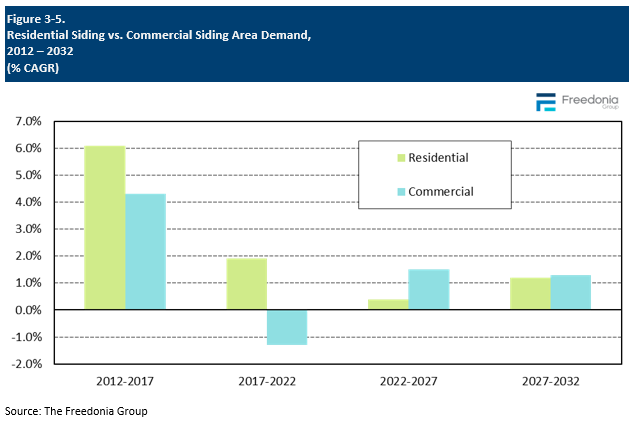
Rebound of Commercial Market to Benefit Brick, Metal, & Fiber Cement
The commercial market is forecast to rebound following pandemic-related declines in commercial building construction in the latter part of the historical period. Among the siding materials used for commercial buildings, brick, metal, and fiber cement will all see notable growth:
-
Fiber cement is expected to grow at the fastest rate of any commercial siding material (albeit from a small base), supported by its fire resistance, its lower cost compared to brick or concrete, and its array of finishes and styles that can provide a variety of aesthetics to a light commercial structure.
- Metal and brick siding will account for sizable absolute gains, with metal sales being supported by the increasing construction of factories and associated offices and warehouses, which often use metal siding. Brick siding’s share of absolute gains will be supported by its low maintenance and durability.
Historical Trends
Siding demand tends to follow trends in building construction activity, especially in the residential market. For instance, siding demand is strongly correlated with new home construction because it is installed on virtually every unit.
Demand for siding also follows trends in new commercial building, though not as closely as the residential trends. The materials used on commercial structures tend to be concentrated, such that metal, concrete, and brick make up an absolute majority of demand.
Siding demand is also impacted by trends in home renovation activity, as the residential re-siding market is the leading application for siding. Homeowners looking to upgrade the appearance of their homes may do so in a number of ways that promote siding demand:
-
For example, some siding materials – namely vinyl and natural wood – will necessitate replacement over time.
-
Additionally, some homeowners may seek to increase the value of their homes by opting for higher quality siding products that have fewer maintenance requirements.
Similar to new construction activity, the trend is less profound in the commercial market, as renovation projects are more commonly focused on utility than on exterior aesthetics.
Supply & Demand
Shipments of siding products are projected rise 1.3% per year to $15.8 billion in 2027, which is in line with domestic demand since trade plays a minor role in the US market.
Many firms have boosted production by maximizing output at existing sites, but siding manufacturers are also opening new sites.
-
In December 2023, Millwork & Panel LLC – an indirect subsidiary of CertainTeed Holding Corporation – announced plans to expand its siding manufacturing plant in Claremont, North Carolina.
-
In October 2023, Louisiana-Pacific announced the grand opening of a new SmartSide production facility in Bath, New York.
-
In September 2023, Saint-Gobain North America – through its subsidiary CertainTeed – said that it will expand its vinyl siding plant in Williamsport, Maryland to centralize distribution for all of its products.
-
In November 2022, Louisiana-Pacific reported plans to expand SmartSide siding capacity at its Houton, Maine facility.
-
In June 2022, James Hardie said that it would more than double the square footage of its Prattville, Alabama plant, which produces HardiePlank and HardiePanel.
Demand by Material
Value Demand
Siding demand value is expected to increase at an annual average pace of 1.4% to $16.0 billion in 2027. This significant deceleration from the previous forecast period stems largely from moderating average siding product prices, which are attributable to supply chain normalization and reduced residential market demand.
Sales will be supported by a resurgence in the commercial market, as the materials generally used for such buildings are extremely durable, require little maintenance, and have higher average prices per square. In addition, improving product quality means that homeowners and contractors are increasingly likely to specify higher-end, more durable, and/or more aesthetic siding products of any given material.
Some siding materials – including brick, metal panels, and concrete – account for higher shares of demand value than volume because they are relatively expensive per square. Conversely, materials like vinyl, engineered wood, and stucco have lower average prices that cause their share of demand value to lag behind volume.
Demand by Market
At the broadest level, demand for siding is divided between residential and commercial buildings.
Forecasts in this report use 2022 as the base year. Economic factors (i.e., supply chain disruptions, general price inflation, single-family housing construction) and their impact on siding sales and production in that year strongly influence growth rates for siding products and market segments. However, the reduced demand growth expected throughout the forecast period is more attributable to the high rates exhibited the previous two years than to prevailing economic factors:
-
Residential siding saw a strong boost in 2020 and continued growth in 2021. Growth was mostly precipitated by surging housing starts and high levels of consumer interest in home improvement, although multiple severe weather events also bolstered residential siding renovation demand in 2020 and 2021.
-
Sales of siding installed on commercial structures fell in 2020 and 2021. Market uncertainty and the high shares of brick and metal commercial siding, which saw large price increases, inhibited commercial demand growth.
The residential market accounts for a greater share of siding demand in any given year because:
-
large numbers of new homes – especially single-family residences – are erected annually
-
the residential siding stock in the US is considerably larger than its commercial counterpart
-
homeowners generally exhibit the most interest in replacing siding for aesthetic reasons (such as to improve curb appeal); these concerns are usually less important to commercial property owners
Commercial siding demand is forecast to grow at an annual average rate of 1.5% to 22 million squares in 2027. While the commercial market is expected to rebound during the forecast period, average volume growth will begin to slow as the losses incurred from 2020 to 2022 are recovered.
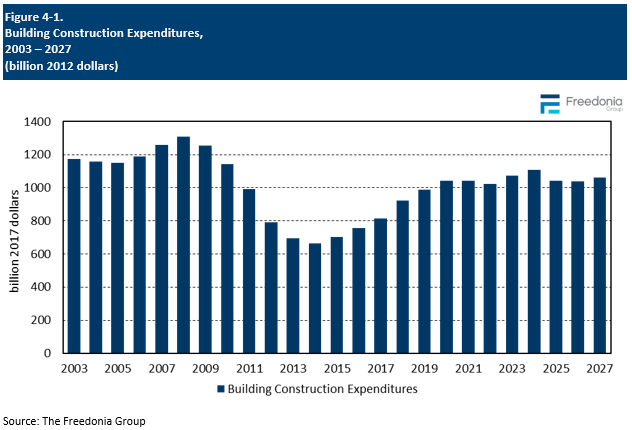
Building Construction Industry Outlook
The most important factor to siding sales is the health of the US construction industry, and in particular the construction of buildings. Siding is a critical and necessary component of all buildings constructed in the US, although the type of siding may vary significantly depending on whether the structure is residential or commercial and whether it is new construction or renovation.
Real building construction expenditures are expected to increase by an average of 1.5% per year through 2027: