Report Overview
Featuring 23 tables and 29 figures – now available in Excel and Powerpoint! Learn More
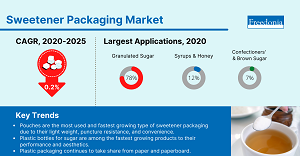
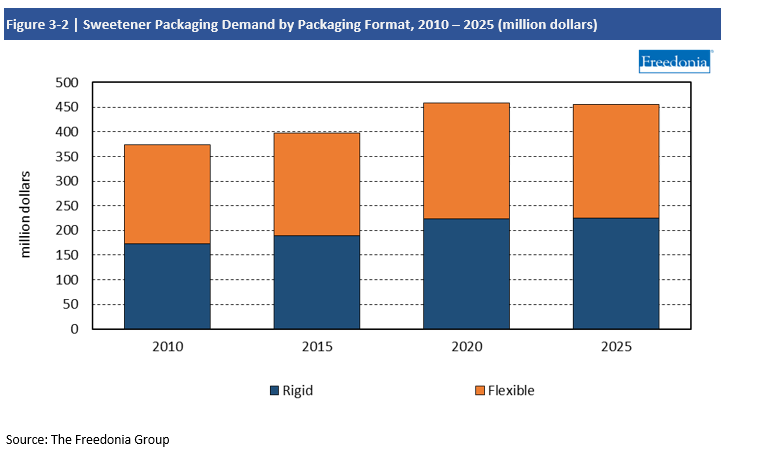
 Demand for sweeteners packaging is expected to fall from a high base in 2020, gradually returning to growth and forecast to reach $455 million in 2025. Gains will be supported by the increasing popularity of organic and premium sweeteners – which tend to use more expensive packaging – and conversions to higher-value packaging formats with performance or product differentiation benefits.
Demand by Packaging Format (Rigid vs Flexible)
The market for sweetener packaging is almost equally balanced between flexible and rigid formats, which is expected to remain the case going forward. Sweeteners come in both dry and liquid versions, supporting ongoing demand for both flexible and rigid packaging.
Flexible packaging consists primarily of pouches and bags, which are used for high volume applications such as granulated, powdered, and brown sugar. Stand-up pouches, in particular, have seen large demand gains since their introduction in the late 2000s, especially for use with organic sweeteners and sweetener alternatives.

Plastic
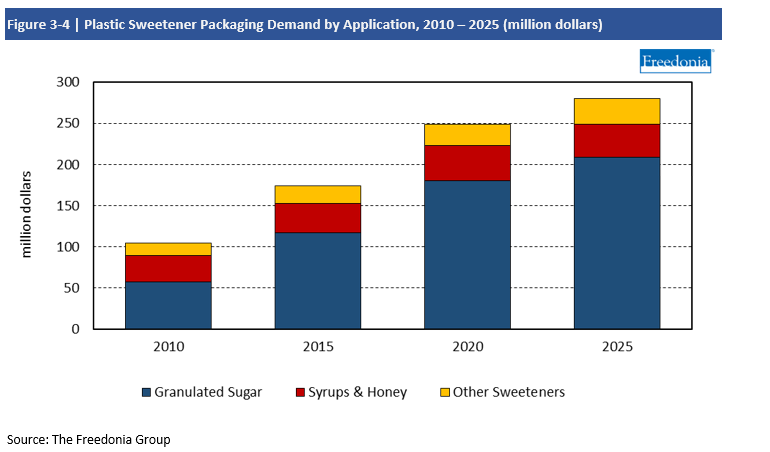
Plastic packaging for sweeteners is comprised primarily of bottles, jars, pouches, pails, cups, and wrap. Demand for plastic sweetener packaging is forecast to grow 2.4% per year to $280 million in 2025.
Plastic is the leading material used in the packaging of sweeteners; it is expected to take further shares from other materials in every market category due to the variety of advantages it offers:
- In addition to being more crush-resistant than paperboard, plastic packaging is transparent and allows consumers to see the sweetener within.
- Higher-value plastic packaging can convey a premium image.
- Compared to glass, plastic is shatter-resistant, more cost effective, and lighter.
Granulated sugar is the largest category for plastic packaging – primarily because it’s the largest market category overall – and is expected to post above average gains through 2025 as manufacturers replace composite cans and paper bags with plastic bottles and stand-up pouches.

Confectioners’ & Brown Sugar
Confectioners’ sugar is finely powdered and used to make candies, icings, and as a topping for pastries. Brown sugar contains molasses, lending it its namesake color.
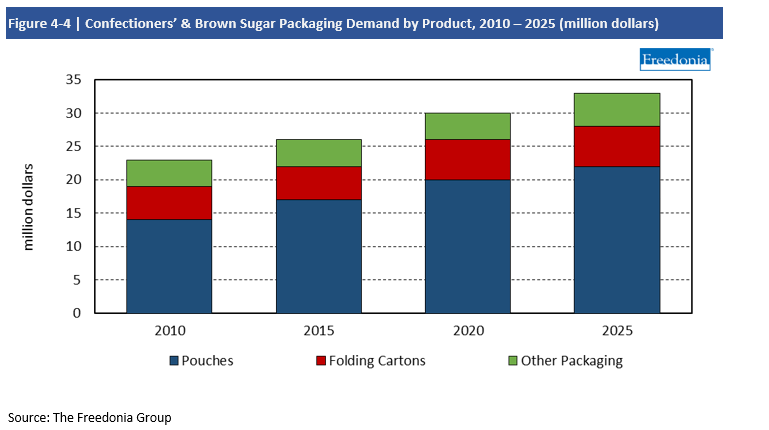
Packaging demand for confectioners’ and brown sugar is forecast to grow 1.9% per year to $33 million in 2025, supported by a rebound in the foodservice industry.
Pillow pouches are the largest packaging format for confectioners’ and brown sugar due to their low cost and light weight, but demand will be flat due to market maturity and completion from other packaging types.
Stand-up pouches are forecast to post above-average growth going forward thanks to the premium image they convey compared to folding cartons and pillow pouches.
Folding cartons are often used as secondary packaging for pouches of confectioners’ and brown sugar; they provide structural integrity and prevent puncturing and crushing.

Pouches
Pouches used for sweetener packaging include plastic stand-up and pillow pouches for sugar and sugar substitutes, plastic side seal pouches for single-serving honey or syrup, and paper single-serve side-seal sugar packets.
Demand for pouches in sweetener packaging is forecast to grow 3.2% annually to 194 million in 2025 as manufactures continue to adopt them in favor of other formats. In general, pouches are better performing and lighter than bottles, cans, and canisters (which lowers the cost of raw materials and the environmental impact of transportation).
Stand-up pouches will continue to offer the best opportunities due to a number of advantages over competing packaging formats. Stand-up pouches are:
- resealable, more convenient to use, and offer better barrier properties than paper bags
- convey a more premium image compared to paper bags, making sugar appear as less of a commodity to consumers
- provide product differentiation and shelf appeal compared to more traditional packaging
Pouches continue to be the primary form of packaging for sugar substitutes. Single-serve paper packets – usually packed in folding cartons – were historically the main form of packaging for alternative sweeteners, especially for the foodservice market; demand for these pouches will get a boost from rebounding foodservice activity. Expanding applications in the retail sector have driven growth for alternative sweeteners in larger stand-up pouches, a trend that was further boosted by an increase in at-home baking during the COVID pandemic.
The scope of this report includes packaging for sweeteners. These items are generally sold in the baking and condiment section of retail store but are also used by foodservice establishments.
Specific applications covered in this report include:
- granulated white sugar
- confectioners’ (powdered) sugar and brown sugar
- honey, including liquid, crystallized/creamed, and powdered
- sugar substitutes and alternative sweeteners such as Splenda, Sweet’n Low, Stevia, monk fruit, and coconut sugar
- syrups, including simple syrup, corn syrup, maple syrup, molasses, and fruit flavored syrups
Excluded from this study are a variety of products including:
- sweeteners for food and beverage manufacturing
- chocolate and caramel toppings for desserts
- corrugated boxes and protective packaging used specifically for shipping purposes as opposed to product packaging
Specific packaging products used for sweeteners are:
- pouches
- bottles and jars
- bags
- cans and canisters
- boxes and cartons
- other packaging (primarily pails, wrap, and cups)
Historical data (2010, 2015, and 2020) and forecasts for 2025 are presented for demand for sweetener packaging by value in current dollars (including inflation); demand data by market is presented in current dollars. “Demand” (or sales) is defined as all shipments from US plants, plus imports minus exports.
Demand for sweeteners packaging was $460 million in 2020, which is higher than is typical, as consumers greatly increased their at-home cooking and baking during the COVID-19 pandemic. This spike in the retail market more than offset weakness in foodservice sales of sweeteners and associated packaging. Though demand for sweeteners packaging is expected to fall from this high in 2021, it will return to gradual growth and forecast to be $455 million in 2025.
Prior to 2020, demand growth for sweeteners packaging was relatively slow due to the maturity of the sweeteners market. However, this continues to be a dynamic packaging market due to:
- the popularity of organic, alternative, and premium sweeteners, which boost market value since they tend to use more expensive packaging
- continued materials competition, with plastic packaging taking market share away from both paper and glass packaging in many areas
- consumer demand for convenience, which drives demand for packaging – such as stand-up pouches – with value-added features
Pouches To Be the Most Used & Fastest Growing Packaging Format Due to Versatility
Pouches of various types are used in every dry sweetener application due to the advantages they offer over other packaging formats:
- Stand-up pouches see use with sugar and sugar substitutes due to their puncture-resistance premium image compared to paper bags.
- Single-serve paper packets are used in the same applications because of the convenience they provide in sweetening beverages like coffee and tea, and they will see above-average gains as food service sweetener usage rebounds post-lockdowns.
- Pillow pouches will continue to see widespread use due to their low cost and light weight, although market maturity and competition from other formats will lower growth prospects.
Plastic Bottles to See Above Average Growth Due to New Applications
Plastic bottles have historically been used for packaging liquid sweeteners such as syrups and honey, where they consistently take market share from glass and metal. Going forward, demand will be further boosted by the expansion of plastic bottles into dry sweeteners like granulated sugar. Not only do plastic bottles offer performance and convenience advantages, they also provide product differentiation and help to “de-commodify” sugar with their more modern design.
Plastic Packaging Continues to Take Share from Paper & Paperboard
Historically, dry sweetener packaging has been the domain of paper and paperboard thanks to the popularity of paper bags, folding cartons, and composite cans. However, plastic is now the most used and fastest growing material, owing to the popularity of stand-up pouches and bottles that offer performance advantages over traditional paper packaging.