Report Overview
Explore analysis of top decking trends.
-
Sizable stock of wood decks in need of replacement
-
Aluminum, cable, and glass railing gaining market share
This Freedonia industry study analyzes the $13.9 billion US decking industry. It presents historical demand data (2012, 2017, and 2022), forecasts (2027 and 2032), and annual historical and forecast data from 2019 to 2026 by market (residential, commercial, nonbuilding), by material (wood, wood-plastic composite, plastic, other) and product (decking board, railing accessories). The study also evaluates company market share and competitive analysis on such industry players as AZEK Company, Cornerstone Building Brands, CRH (Oldcastle AG), Fortune Brands (Fiberon), Owens Corning (WearDeck), TAMKO Building Products (Envision Outdoor Living), Trex, UFP Industries, VEKA, West Fraser, and Weyerhaeuser.
Featuring 144 tables and 26 figures – available in Excel and Powerpoint! Learn More
Read the Blog: Alternative Decking Materials – Bamboo, Rubber, Glass?
Demand for decking in the US is forecast to remain stagnate at 3.8 billion lineal feet in 2027 (valued at $12.7 billion), restrained by slow growth in residential improvement and repair activity. Growth will also be limited by the large number of residential decks that were installed in 2020 and 2021, when the onset of the COVID-19 pandemic caused home renovations to soar – these decks are not likely to be replaced in the near future. Market value will also be negatively impacted by a significant moderation in wood prices from elevated levels during the pandemic.
Although the overall outlook is weak, growth will occur in some segments such as:
-
the commercial market, thanks to a strong rebound in the construction of hotels and resorts, where decks are frequently installed in outdoor gathering areas
-
the nonbuilding market, due to design trends that call for more gathering and recreation areas in public parks and other facilities
-
nonwood decking materials, which offer greater durability and require less maintenance than wood
Popularity of Wood-Plastic Composite Decking Continues to Rise
Wood-plastic composite is expected to capture a larger share of the US decking market through 2027, primarily at the expense of pressure-treated wood. Wood-plastic composite is gaining popularity because it is durable and maintains a wood-like appearance. Advances in product aesthetics and the use of capstock-coated decking – which provides enhanced protection against mold growth and premature degradation – will further boost wood-plastic composite decking demand.
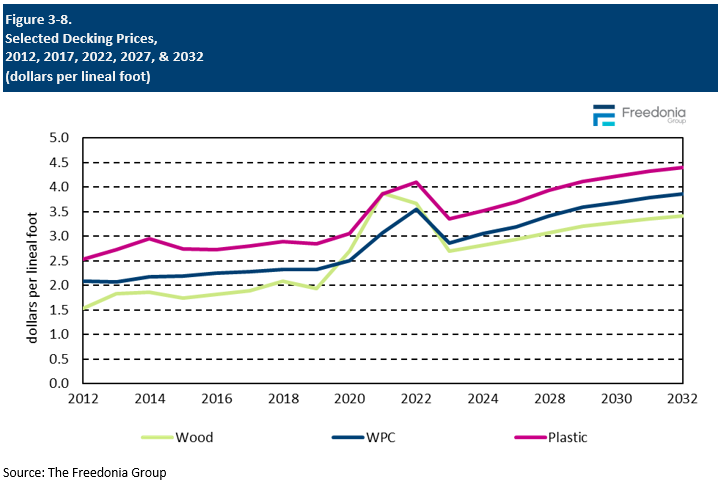
Wood Decking Prices will Moderate from Record Highs
2020 and 2021 saw record high prices for lumber, especially pressure-treated varieties; the surge was caused by pandemic-induced shutdowns leading to severe shortages among domestic suppliers. Additionally, shortages in the Canadian market – which is a major source of US supply – exacerbated price pressures, precipitating significant increases and volatility. This resulted in a highly inflated value for the US decking market. For example, demand volume grew 12% from 2019 to 2021, while demand value increased by over 105%. This was primarily due to a 150% increase in the price of lumber during that period.
Prices in 2022 remained elevated, but began to stabilize as supply chains normalized and construction activity began to dampen. In 2023, prices for wood decking moderated significantly, and will remain below 2022 levels for the rest of the forecast period.
Historical Market Trends
Demand for decking tends to follow trends in building construction activity, especially in the residential renovation market. Other factors beyond the outlook for residential building construction that impact the number of decks and the overall market size include:
-
levels of disposable income, which impact consumers’ abilities to spend on discretionary items such as decks
-
residential lot size, which determines both the feasibility of having a deck and its ultimate size
-
trends in the popularity of outdoor living and dining
-
the outlook for spending at commercial establishments like restaurants and lodging, where decks are often key features
-
parks and other recreational areas purchasing structures such as freestanding decks, boardwalks and marinas.
-
the complexity of deck design, particularly when including the amount of accessories often required
-
changes in the mix of materials used and their relative pricing
-
overall levels of inflation and the costs of raw materials and labor
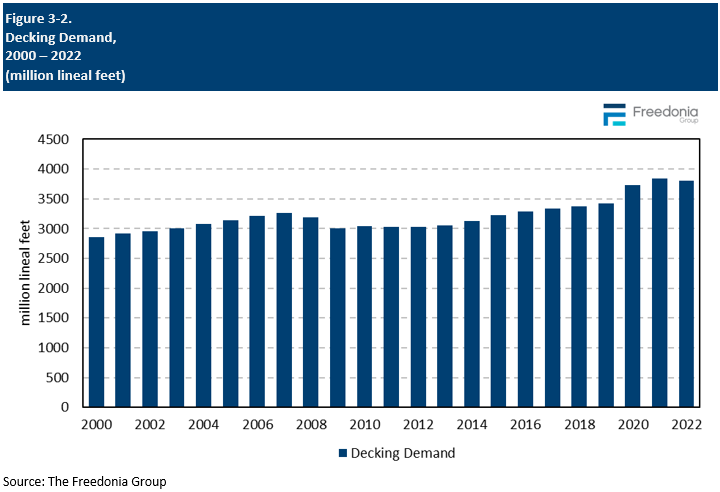
Prior to the pandemic, demand growth in lineal feet terms was fairly consistent over the historical period. However, demand grew quickly in 2020 as home improvement and repair activity surged. Growth in value terms has shown more volatility over the historical period due primarily to wood pricing. However, market value grew at record rates in 2020 and 2021 as wood shortages and high raw material costs sent prices skyrocketing.
Markets Overview
Markets for decking products can be divided into three main segments, each of which has both new and renovation demand:
-
residential
-
single-family
-
multifamily
-
manufactured housing
-
commercial, which includes decks installed near commercial buildings such as bars, restaurants, hotels, casinos, resorts, spas, and other entertainment facilities
-
nonbuilding, which is comprised of decks that are not attached to buildings:
-
The majority of these are in coastal or other waterfront areas and serve as boardwalks, docks, marinas, and piers.
-
Nonbuilding decks also include walkways and platforms at national, state, or local parks; amusement parks; water parks; and playgrounds. In many cases, decks in these applications are built through municipal or other government contracts.
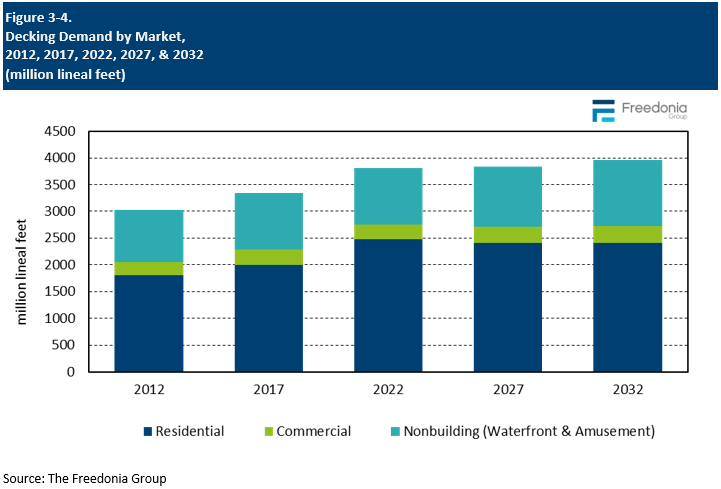
The residential market accounted for 65% of decking demand in area terms in 2022. Despite demand falling slightly in this market through 2027 from a high base, it will be sustained by:
-
an increase in the average size of decks
-
the large stock of wood decks in need of replacement
-
consumers being willing to increase their spending on outdoor living spaces
Demand for decking in the commercial market will be driven by rising construction of deck-intensive structures such as restaurants, hotels, and resorts, and other hospitality and entertainment venues. In many cases, renovations of these decks were delayed during the pandemic.
In the nonbuilding market, decking demand will be supported by the large stock of installed decks in places like parks, lakeshores, and marinas, some of which will require renovation. Further gains will be supported by design trends that call for more gathering and recreation in public parks and other facilities.
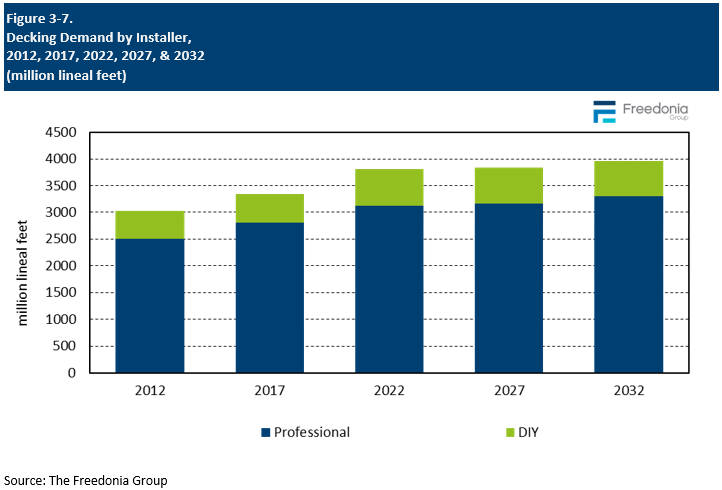
Installation Trends (Professional vs. DIY)
Decking products can either be installed by professionals or consumers.
Professional installations dominate the decking market, accounting for 82% of the market in 2022. Given the complexity of deck work and safety and building code regulations in the commercial and nonbuilding markets, essentially all decks in these segments are installed by licensed, professional contractors.
DIY demand hit record high levels in 2020 and 2021; consumers significantly increased their levels of home improvement spending, and there was a severe shortage of skilled installers. Demand in the DIY segment is almost entirely limited to the residential market, particularly in the installation of treated-lumber decks (the material is much easier to use than wood-plastic composite, plastic, or metal). However, levels of DIY decking activity are expected to return to historical norms, precipitating a slight drop in DIY installations through 2027.
Pricing & Inflation
In this study, prices for decking materials are measured at the manufacturer’s level. Prices for decking products depend on a variety of factors, including:
-
raw material costs
-
production costs such as energy or labor
-
the mix of materials used in the production of decking products
-
product quality and design, including the use of coatings or other treatments
Tariffs can also affect the cost of raw materials, though this effect is somewhat limited due to the relatively small role imports play in the market.
Even within a specific type of decking material, prices can vary because of material quality, customer location, or product design. For example:
-
the price of capstock-coated wood-plastic composite and cellular PVC decking are higher than those for standard varieties of those materials
-
price variations in the nonwood segments stem from both material costs and differences in the characteristics of the decking itself
Prices for pressure-treated lumber, wood-plastic composite, and plastic decking products surged in 2020 and 2021 and either remained elevated or surged again in 2022. These price spikes were the result of:
-
pandemic-induced shutdowns causing domestic shortages
-
shortages in the Canadian market – a major source of US supply – which exacerbated price pressures, precipitating significant increases and volatility
-
prices for raw materials used in vinyl and wood-plastic composite decking soaring
Through 2027, the average price of decking is expected to decline 2.0% per year to $3.30 per lineal foot due to sizable drops in the prices of southern yellow pine lumber, cedar, and redwood as shortages have ceased and supply chain issues have resolved themselves.
However, the increasing use of materials such as wood-plastic composite or plastic will serve as a check to more significant overall price decreases.