Report Overview
Learn more about key trends in mulch.
-
Consumer demand for lawn and garden mulch surged in the COVID-19 pandemic
-
Plastic and rubber mulch growth will outpace gains for wood mulch.
This Freedonia industry study analyzes the $809 million US packaged lawn and garden mulch industry.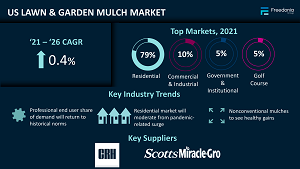 It presents historical demand data (2011, 2016, and 2021) and forecasts (2026 and 2031) by type (wood – including conventional and colored, and other type – including rubber and all other mulch and ground coverings), application (lawn and turf, gardens and borders, and other applications), market (residential, golf courses, government and institutional, and commercial and industrial), and end user (consumer, service firms, and other professional users). The study includes year-by-year annual data and consumer survey data. The study also evaluates company market share and competitive analysis on industry competitors including CRH and Scotts Miracle-Gro.
Featuring 40 tables and 10 figures – available in Excel and Powerpoint! Learn More
This report includes data from 2011-2031 in 5 year intervals and tables featuring year-by-year data for 2018-2025.
US demand for lawn and garden mulch is projected to increase less than 1.0% annually to $824 million in 2026. In the near term, demand will decline as the market recedes from an unusually high level (prompted by greater lawn and garden activity during the first years of the COVID-19 pandemic). In the latter part of the forecast period, demand will grow at a more sustainable rate.
The Consumer Segment Will Decline, But Continue to Account for the Majority of Demand
The consumer segment accounts for the majority of demand for packaged lawn and garden mulch – roughly 70% in most years. That share swelled in 2020 and 2021 as the pandemic led more homeowners to garden and landscape their outdoor areas themselves. Going forward, these shares are expected to revert to pre-pandemic levels as consumers return to routines that involve work outside the home and other obligations, boosting demand for professional lawn care services. However, such services are also more likely to use bulk mulch rather than packaged mulch, which will restrain demand growth.
Alternative Products to Outpace Conventional Wood Mulch
Conventional wood mulch, including colored versions, is expected to continue its domination of the lawn and garden market due its low cost and suitability for most mulching uses. However, alternative mulches – such as plastic, rubber, and gravel products – are expected to register faster growth:
- Plastic and rubber mulches are usually made from recovered materials that are then shredded, which appeals to environment-minded users.
- Gravel mulch will see gains due to its visual appeal in some landscape aesthetics, as well as its greater durability as users seek to achieve their lawn and garden objectives with less work, even if at greater initial expense.
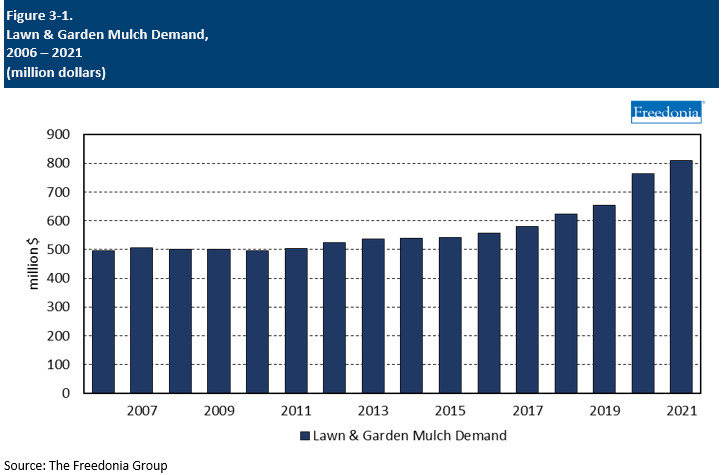
Historical Market Trends
In general, year-to-year fluctuations in demand for mulch is influenced by a variety of factors, including:
- residential and commercial construction, which generally involves the installation of new lawns and landscaping
- trends in average lot size and maintained areas
- personal incomes and levels of discretionary spending
- the number of people participating in gardening as a hobby
- variability in active ingredient and raw material pricing and availability
- weather patterns and climate change
- a shift in product mix favoring either economy or value-added types
- changes in the way living spaces are used and the frequency with which they are used
Weather and climate change continue to play a role in the variability of demand for these products. Abnormal storms or longer terms events like droughts can influence the need or replacement for certain types of products. Additionally, as climates change over time, regions will see more variations in the lawn and garden products they require.
In 2020, demand for mulch and other lawn and garden consumables surged because of increased investment in outdoor projects, particularly in the residential market. As consumers stayed at home more, a greater importance was placed on the areas in and around their homes. Funds typically allocated for entertainment outside the home were used to renovate their outdoor areas.
Consumer Trends
Demand for packaged lawn and garden mulch for consumer users is expected to decline nearly 1.0% from its high 2021 base to $585 million in 2026. Continued participation in home gardening, landscaping, and lawn care will promote demand for products that can reduce maintenance requirements, including mulch, which improves moisture retention and can suppress weeds. Mulch and ground coverings are also seen as an attractive way to fill large spaces.
Increased demand for value-added mulches and ground coverings, including colored mulches and shredded rubber, will help to limit declines. For many consumers, purchasing packaged mulch is easier than dealing with deliveries of bulk mulch. Additionally, some consumers are concerned about the adverse effects of a pile of bulk mulch sitting on their lawns for an extended period of time, on top of the wear on the lawn caused from moving the mulch with a wheelbarrow or other heavy equipment.
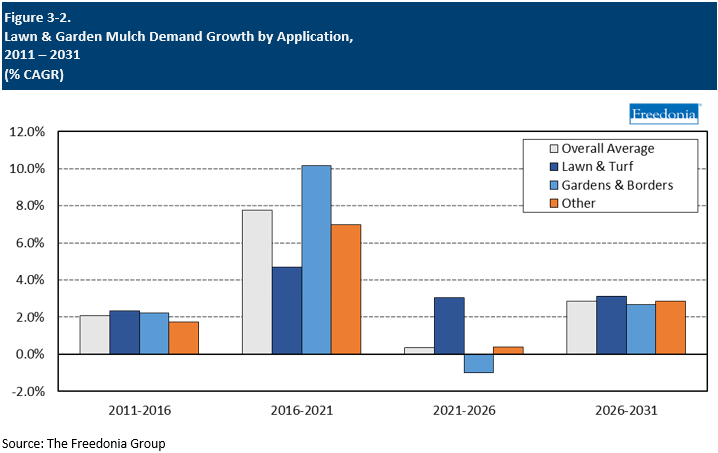
Demand by Application
(Gardens & Borders, Lawn & Turf, & Other)
Gardens and borders – as well as unplanted areas (e.g., side yards, parking lot islands, etc.) – account for the majority of demand for packaged mulch and other ground coverings, representing 80% in 2021. In these applications, mulch and other ground coverings are used for both aesthetic and functional purposes, including erosion prevention, moisture retention, and soil temperature regulation.
While lawn and turf applications for mulch are generally more limited, the application of a thin layer of mulch can improve soil nutrient content, suppress weed growth, and insulate the soil. However, for those who choose to mulch their lawns, simply leaving grass clippings and dead leaves is often sufficient. Straw is also often laid over newly planted grass seed to prevent the seed from being moved by wind or water, and to protect it from being eaten by animals.
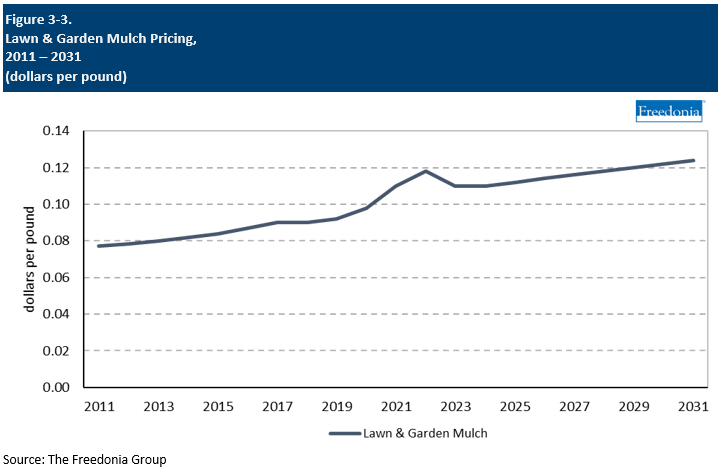
Pricing Trends
Lawn and garden mulch prices are generally much lower than prices for more technologically advanced lawn and garden consumables, such as pesticides and seeds with special traits. Pricing fluctuations for mulch tend to be influenced by:
- raw material and commodity costs
- new product introductions
- energy costs
Changes in product mix are among the most significant factors in influencing average mulch prices. For example, premium wood mulches can be several times more expensive than basic wood mulch, and ground coverings made of gravel, shredded rubber, and other materials can be significantly more expensive than premium wood mulches.
All lawn and garden products experienced price volatility in 2021 and 2022; high demand created shortages, and supply chain challenges limited the ability to fulfill downstream orders. While some of these issues may take time to ease, they will have a diminished impact on price growth going forward.