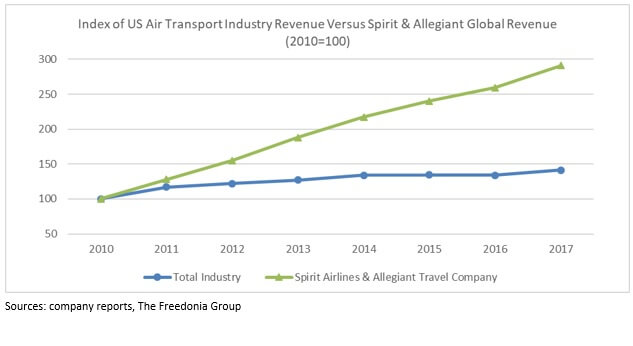
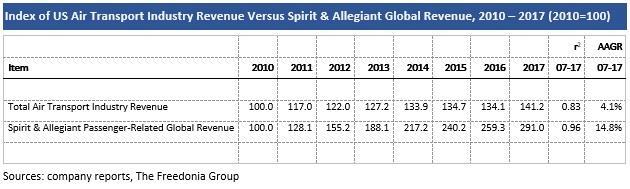
Ultra-low-cost carriers (ULCCs) disrupted the US airline industry with a new business model – discounted fares in exchange for stripped-down service – and they continue to enjoy significant success. Global revenues for Spirit Airlines and Allegiant Travel Company, two of the three leading ULCCs in the country, grew at an average annual rate of 15% over the 2010-2017 period, roughly 3.6 times faster than the airline industry overall. Frontier Airlines is the other ULCC that participates in the US airline industry but is not publicly traded and does not publish financial data.
Business Model
In addition to low fares, ULCCs have benefited from serving destinations such as small and mid-sized cities or vacation spots that were previously deemed unprofitable by larger carriers due to low or seasonal passenger volumes. For example, as of February 2017, Allegiant Travel Company served 119 cities, including 118 traditionally underserved leisure (20) and nonleisure (98) destinations. In addition, the discount fares offered by ULCCs typically expand the customer base of air travelers. Rather than simply capture business and recreation air travelers from traditional airlines, ULCCs report that their more affordable fares also convert non-flyers to flyers.
Fees
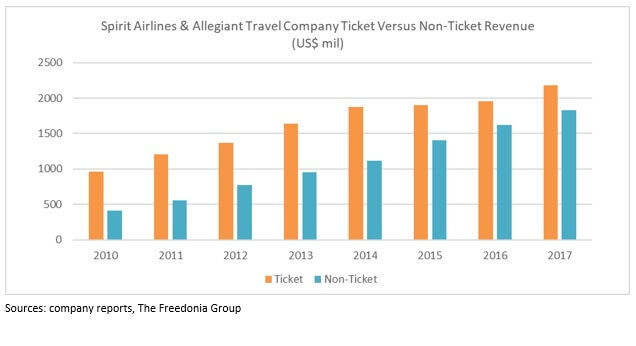
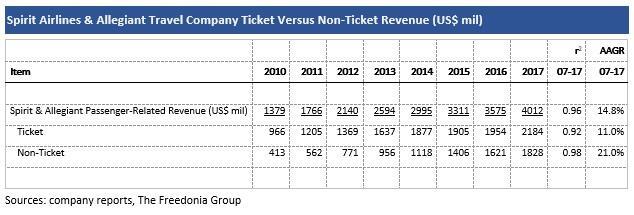
Another key aspect of the ULCC business model involves charging extra for substantially all amenities, conveniences, and services, such as checked bags, food, and water. In 2017, non-ticket revenue amounted to 46% of passenger-related revenues for Spirit and Allegiant, a considerable increase from 30% in 2010. Despite the fees, however, many travelers continue to value the low-cost fare, boosting the fortunes of ULCCs. Nevertheless, the growth rate of ULCC revenues slowed during the 2014-2017 period, compared to the faster gains during the 2010-2014 time span. Reasons for the slowdown include the maturation of the market for very low fares and the introduction of budget fares by traditional carriers, including American Airlines, Delta Air Lines, and United Continental. The performance of the ULCCs and the impact they have on the airline industry on factors such as fare prices and fees will be an interesting trend to follow in the years ahead.
Learn More
For more insights into the US air transport services industry, see Air Transport Services: United States, a report published by the Freedonia Focus Reports division of The Freedonia Group. This report forecasts to 2022 US air transport service revenues in nominal US dollars. Total revenues are segmented by source in terms of:
- domestic scheduled passenger
- international scheduled passenger
- domestic nonscheduled (i.e., chartered) passenger
- international nonscheduled (i.e., chartered) passenger
- domestic scheduled freight
- international scheduled freight
- other sources such as fees, nonscheduled (i.e., chartered) freight services, and specialty air transport services
To illustrate historical trends, total revenues, the various segments, the number of firms and establishments, and employment are provided in annual series from 2007 to 2017. In addition, industry expenses and net profit margin are provided in annual series from 2009 to 2017.
This report represents employer and nonemployer revenues for the US air transport service industry, which includes the revenues of US-headquartered firms as well as the revenues of foreign-headquartered firms for flights that land or take-off in the US. Notably, foreign-owned carriers may operate international flights to and from the US but cannot fly between US airports. Activities excluded from the scope of this report include crop dusting and fighting forest fires using specialized aircraft, specialized air sightseeing services, gathering of geophysical data, specialized flying schools, and recreation aviation clubs.
Key macroeconomic indicators are also provided with quantified trends. Other various topics, including profiles of pertinent leading suppliers, are covered in this report. A full outline of report items by page is available in the Table of Contents.
Related Focus Reports include:
About the Author
Leon Mengri is a Senior Market Research Analyst with Freedonia Focus Reports. He conducts research and writes a variety of Focus Reports, which offer concise overviews of market size, product segmentation, business trends, and more.