US Electric Sector Shifts Toward Natural Gas & Renewables
by Sarah Schmidt
February 12, 2020
Natural gas and renewables are expected to outcompete coal, petroleum, and nuclear power for the foreseeable future.
The Past
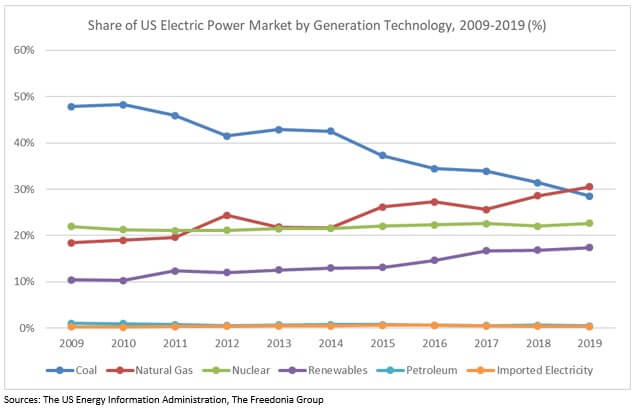
Between 2009 and 2019, the percent of power generated by coal declined from 48% in 2009 to 29% in 2019, while shares of electricity generated by natural gas expanded from 18% in 2009 to 31% in 2019. Similarly, renewable energy saw its share of the pie grow from 10% in 2009 to 17% in 2019. Natural gas caught fire as decreasing prices paired with increased construction of combined cycle plants (which are more efficient than single-turbine natural gas plants) to make natural gas an economical choice for utilities to construct.

Similarly, renewable energy generation facilities, primarily solar and wind power, became increasingly economical for utilities to construct as the Production Tax Credit (PTC) for wind power and Investment Tax Credit (ITC) for solar power lowered costs of uptake, and increasing mass production of the technologies also decreased cost.
The Future
Solar, wind, and natural gas power sources are expected to continue seeing gains at the expense of coal, petroleum, and nuclear power, though the rate of uptake of solar and wind power will slow down due to the expiration of the ITC in 2019 and the PTC in 2022 (though commercial solar panel installments will still be eligible for a 10% credit after 2022), which subsidized operation of these technologies. Nonetheless, increasing mass production of solar panels and wind turbines, as well as growth in battery storage, will ensure these technologies continue to outshine coal.
For example, construction of wind turbines in Wyoming, as well as offshore on/along the East coast, will continue growing wind power buildouts. Increasing construction of battery storage will permit greater utilization of solar power, which will continue expanding solar power construction.
See here for more blog posts on the petroleum, natural gas, or coal energy markets.
Want to Learn More?
We have you covered! For additional information and analysis of US industry trends, see Energy: United States and Renewable Energy: United States, reports published by the Freedonia Focus Reports division of The Freedonia Group.
Energy: United States forecasts to 2024 US energy consumption and production in British thermal units (Btu). Total consumption is segmented by resource in terms of:
- petroleum
- natural gas
- coal
- renewables
- nuclear
Renewable Energy: United States forecasts to 2024 US renewable energy consumption and production in British thermal units (Btu). Total consumption is segmented by resource in terms of:
- wood and waste biomass
- hydropower
- biofuels
- wind
- solar
- geothermal
For both reports, total consumption is also segmented by market as follows:
- electric power
- industrial
- transport
- residential
- commercial
To illustrate historical trends, total consumption, total production, and the various segments are provided in annual series from 2009 to 2019.
For the purposes of these reports, energy is measured in terms of primary energy. As defined by the US Energy Information Administration, primary energy is the form of energy first accounted for before any conversion to secondary or tertiary forms of energy. To avoid double-counting, market totals represent primary energy consumption only. For example, the electric power market represents the consumption of energy (e.g., coal, natural gas) to produce electricity, but retail sales of that electricity to the other markets (e.g., industrial, residential) are excluded from market totals.
While you’re there, check out our related reports, which include:
- Coal: United States
- Crude Petroleum: United States
- Hybrid & Electric Vehicles: United States
- Insulated Wire & Cable: United States
- Motor Vehicle Biofuels: United States
- Motor Vehicles: United States
- Natural Gas: United States
- Refined Petroleum Products: United States
- Renewable Energy: United States
- Rubber: United States
- Thermoplastic Resins: United States
About the Author
Owen Stuart is a Market Research Analyst with Freedonia Focus Reports. He conducts research and writes a variety of Focus Reports, and his experience as an analyst covers multiple industries.
Have unique research needs?
Freedonia Custom Research listens intently to your needs and objectives. Then we work diligently to define and deliver a service to meet them.Subscribe to Our Blog
Stay up to date with the latest information about new market research and news in areas relevant to your business from our analysts and team members.Freedonia Focus Blog Subscription
Provide the following details to subscribe.