Automotive Aftermarket for Powertrain Components in North America by Product (Engine, Transmission a
Transmissions and parts accounted for the largest single share of regional automotive aftermarket powertrain demand in 2016.

Free Sample Report
Request a free sample of this report and our team will email it to you.
Report Overview
Age and Number of Vehicles in Use Promote Aftermarket Demand
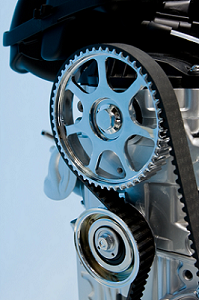
Gains for North American aftermarket sales of automotive engine, transmission, and drivetrain components will be fueled by:
• increases in the number and age of the light vehicle park in the region
• a rising number of electronic parts in powertrain systems, which increases their complexity and raises per-unit replacement costs
• growth in the average number of miles driven due to relatively low gasoline prices, rising personal income levels, and higher levels of employment
Market advances, however, will be limited by technological improvements that are increasing the longevity of powertrain products, many of which are designed to last the lifetime of the vehicle, reducing average replacement rates.
Key Findings in the Automotive Aftermarket for Powertrain Components Study
Mexico to see strongest growth, US largest growth through 2021
Through 2021, aftermarket powertrain demand in Mexico will expand at the fastest rate, albeit from a relatively small base. Factors buoying demand in Mexico include:
• the advanced age of much of the country’s light vehicle park, increasing the likelihood that long-lasting powertrain components will need to be repaired or replaced
• its hot climate, which can lead to vehicle overheating and powertrain component damage
• poor road conditions in many areas, increasing powertrain wear and tear
Nevertheless, a preference in the country for standard transmission vehicles, which are more economical to repair, will restrain overall sales advances. In addition, the 2017 deregulation of gasoline prices in Mexico will raise the cost of gasoline by as much as 20%, which will likely reduce the average number of miles driven per vehicle and associated powertrain product aftermarket demand.
Canada will record the next fastest market advances, supported by above average growth in the number of light vehicles in use. The rate of expansion for aftermarket powertrain demand in the US will lag that for Mexico and Canada, but the US will account for the lion’s share of all North American sales advances through 2021 in value terms due to its huge light vehicle park and higher automotive accident rates.
Transmissions & Parts dominate
Transmissions and parts accounted for the largest single share of regional automotive aftermarket powertrain demand in 2016. Over the past decade, technological improvements in transmission and part designs have improved product durability, reducing the frequency of replacement. Engines and parts and drivetrain components comprised smaller shares of the North American powertrain aftermarket in 2016.
Study Coverage
This study presents historical demand data (2006, 2011 and 2016) and forecasts (2021 and 2026) by product category (transmissions & parts, engines & parts, and drivetrain components), country (US, Canada, Mexico), and performer (professional and consumer/DIY). The study also evaluates company market share and competitive analysis on industry competitors including Federal-Mogul, GKN, GM, Jasper Engines & Transmissions, Schaeffler, ZF Friedrichshafen.
- EXECUTIVE SUMMARY
- Figure 1-1 | North American Powertrain Market
- KEY MARKET FACTORS
- Key Findings
- Figure 2-1 | Key Market Factors in North American Powertrain Aftermarket
- Light Motor Vehicles in Use by Country
- Figure 2-2 | North America: Light Vehicles in Use, 2016
- United States
- Canada
- Mexico
- Competitive Forces in the Automotive Aftermarket
- Vehicle Trends
- Quality Improvements
- Figure 2-3 | Percent of US Population Performing or Purchasing Automotive Maintenance/Repair Service
- Annual Mileage
- Figure 2-4 | North America: Light Vehicle Miles Travelled, 2006-2016
- Figure 2-5 | North America: Average Gas Prices per Gallon in USD, 2006-2016
- Figure 2-6 | North America: Average Number of Miles Traveled per Light Vehicle, 2006-2016
- Average Vehicle Age
- Figure 2-7 | North America: Average Light Vehicle Age, 2006-2016
- Accident Rates
- Figure 2-8 | North America: Number of Light Vehicles Involved in Accidents, 2006-2016
- Figure 2-9 | North America: Light Vehicle Accidents per Thousand Miles Driven, 2006-2016
- Quality Improvements
- Pricing Trends
- Table | Price Deflators for Selected Automotive Components, 2006 - 2021
- Figure 2-10 | Compound Annual Growth in Price Deflators for Selected Automotive Components, 2006 - 2
- Technology & Materials
- Legal & Regulatory Factors
- North American Foreign Trade
- Key Findings
- DEMAND BY COUNTRY
- Key Findings
- Figure 3-1 | Key Trends in North American Automotive Powertrain Aftermarket by Country
- Regional Forecasts
- Table | North America: Automotive Powertrain Component Aftermarket by Country, 2006 - 2021
- Figure 3-2 | North America: Automotive Powertrain Component Aftermarket by Country, 2016
- Figure 3-3 | North America: Automotive Aftermarket Dollar Spending per Vehicle in Use by Country, 20
- United States
- Table | United States: Automotive Powertrain Component Aftermarket by Product, 2006 - 2021
- Canada
- Table | Canada: Automotive Powertrain Component Aftermarket by Product, 2006 - 2021
- Mexico
- Table | Mexico: Automotive Powertrain Component Aftermarket by Product, 2006 - 2021
- Key Findings
- DEMAND BY PRODUCT
- Key Findings
- Figure 4-1 | Key Trends in North American Powertrain Aftermarket by Product
- Demand by Product Type
- Figure 4-2 | Automotive Powertrain Component Demand by Product, 2016
- Product Forecasts
- Table | Automotive Powertrain Component Aftermarket in North America by Product, 2006 - 2021
- Transmissions & Parts
- Table | Automotive Transmission & Parts Aftermarket in North America by Country, 2006 - 2021
- Figure 4-3 | Percent of US Population Purchasing Automotive Transmission Repair Services in the Past
- Table | Automotive Transmissions & Parts Aftermarket in North America by Product, 2006 - 2021
- Figure 4-4 | Automotive Transmissions & Parts Aftermarket Product Demand by Product, 2016
- Table | Selected Automotive Transmission & Parts Products by Major Brand Name
- Engines & Parts
- Table | Automotive Engines & Parts Aftermarket in North America by Country, 2006 - 2021
- Table | Automotive Engines & Parts Aftermarket in North America by Product, 2006 - 2021
- Figure 4-5 | Automotive Engines & Parts Aftermarket Product Demand by Product, 2016
- Table | Selected Automotive Engines & Parts Products by Major Brand Name
- Drivetrain Components
- Table | Automotive Drivetrain Component Aftermarket in North America by Country, 2006 - 2021
- Table | Automotive Drivetrain Component Aftermarket in North America by Product, 2006 - 2021
- Figure 4-6 | Automotive Drivetrain Components Aftermarket Demand by Product, 2016
- Table | Selected Automotive Drivetrain Products by Major Brand Name
- Key Findings
- DEMAND BY PERFORMER
- Key Findings
- Figure 5-1 | North American Powertrain Aftermarket by Performer, 2016
- Performer Forecasts
- Table | Automotive Powertrain Component Aftermarket in North America by Service Performer, 2006 - 2021
- Figure 5-2 | Automotive Powertrain Component Aftermarket in North America by Service Performer, 2016
- Professional
- Table | Professional Automotive Powertrain Component Aftermarket in North America by Performer, 2006 - 2021
- Table | Professional Automotive Aftermarket Products by Major Brand Name
- Table | Garage & Service Station Automotive Powertrain Component Aftermarket in North America, 2006 - 2021
- Table | Specialist Automotive Powertrain Component Aftermarket in North America, 2006 - 2021
- Table | Automobile Dealership Automotive Powertrain Component Aftermarket in North America, 2006 - 2021
- Table | Other Professional Performer Automotive Powertrain Component Aftermarket in North America, 2006 - 20
- Consumer/DIY
- Table | Consumer/DIY Automotive Powertrain Component Aftermarket in North America, 2006 - 2021
- Table | Consumer/DIY Automotive Aftermarket Products by Major Brand Name
- Key Findings
- INDUSTRY STRUCTURE
- Key Findings
- Industry Composition
- Table | North America: Automotive Powertrain Component Aftermarket Sales by Company, 2016
- Market Share
- Figure 6-1 | North America: Automotive Powertrain Component Aftermarket Market Share, 2016
- Jasper Engines & Transmissions
- Figure 6-2 | North American Powertrain: First Leading Supplier
- Federal-Mogul
- Figure 6-3 | North American Powertrain: Second Leading Supplier
- General Motors
- Figure 6-4 | North American Powertrain: Third Leading Supplier
- ZF Friedrichshafen
- Figure 6-5 | North American Powertrain: Fourth Leading Supplier
- GKN
- Figure 6-6 | North American Powertrain: Fifth Leading Supplier
- Schaeffler
- Figure 6-7 | North American Powertrain: Sixth Leading Supplier
- American Axle & Manufacturing
- Figure 6-8 | North American Powertrain: Seventh Leading Supplier
- CARDONE Industries
- Figure 6-9 | North American Powertrain: Eighth Leading Supplier
- Other Suppliers
- Product Development & Manufacturing
- New Product Development
- Manufacturing
- Marketing
- Distribution
- Table | Major Distribution Outlets for Automotive Powertrain Aftermarket Products
- Acquisitions & Divestitures
- Table | Selected Acquisitions & Divestitures
- List of Industry Participants
- APPENDIX
- Scope
- Table | Study Scope: Automotive Engine, Transmission, &Drivetrain Components
- Table | Relevant NAICS Codes (2012)
- Methodology
- Sources
- Related Freedonia Group Studies
- US Studies
- Global Studies
- Definitions
- General
- Abbreviations
- Table | Abbreviations & Acronyms Used in Study
- Macroeconomic Assumptions
- Economic Outlook by Country
- Table | North America: Macroeconomic Environment, 2006 - 2021
- Table | United States: Macroeconomic Environment, 2006 - 2021
- Figure 7-1 | Annual Growth in Real GDP, 2000 - 2016, Compared to 1980-2005 Average
- Table | Canada: Macroeconomic Environment, 2006 - 2021
- Table | Mexico: Macroeconomic Environment, 2006 - 2021
- Light Vehicle Demand by Country
- Table | North America: Light Vehicle Outlook, 2006 - 2021
- Table | United States: Light Vehicle Outlook, 2006 - 2021
- Table | Canada: Light Vehicle Outlook, 2006 - 2021
- Table | Mexico: Light Vehicle Outlook, 2006 - 2021
- Light Vehicle Production by Country
- Figure 7-2 | United States: Light Vehicle Production, 2016
- Figure 7-3 | Canada: Light Vehicle Production, 2016
- Figure 7-4 | Mexico: Light Vehicle Production, 2016
- Economic Outlook by Country
- Scope