Bricks, Blocks, & Pavers
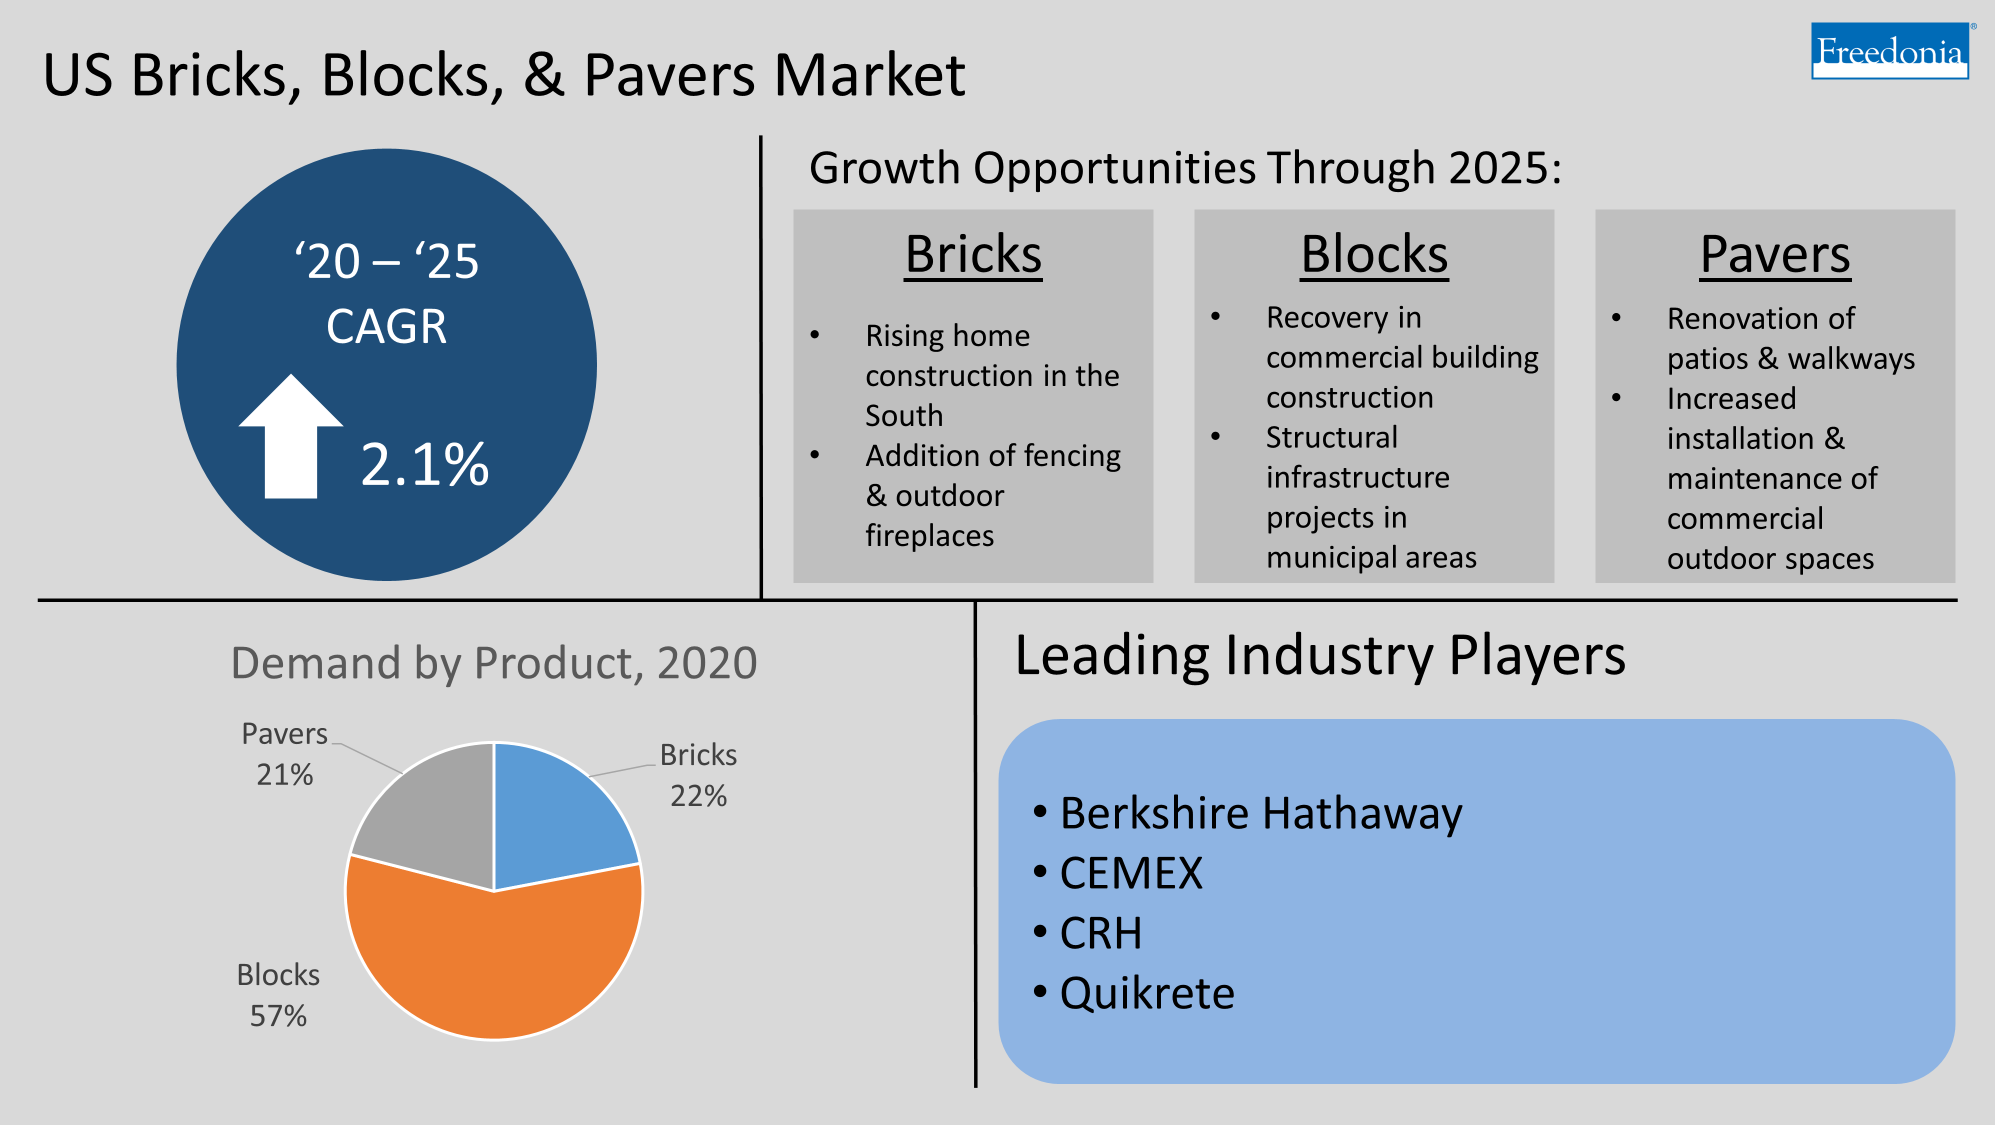
US demand for bricks, blocks, and pavers is expected to increase 2.1% annually through 2025 to $8.1 billion.
Free Sample Report
Request a free sample of this report and our team will email it to you.
Report Overview
Featuring 65 tables and 44 figures – now available in Excel and Powerpoint! Learn More
This comprehensive study examines the US brick, block, and paver industry by product, market, application, and region. Historical data are provided for 2010, 2015, and 2020, with forecasts for the years 2025 and 2030. “Demand” is defined as production, plus imports, minus exports, and is synonymous with terms such as “sales” and “apparent consumption”. Data are presented in millions of dollars and millions of units.
Study Definitions
For the purposes of this study, brick units are defined as having dimensions of 3-5/8 inches by 2-1/4 inches by 7-5/8 inches. These are known in the industry as “standard brick units”, the production of clay bricks of other dimensions are converted into an equivalent volume of standard brick units.
Paver unit demand is also given in standard brick unit size, although it is important to note that pavers are generally laid with the largest face exposed, unlike bricks, which are typically laid with the long narrow face exposed (i.e., the height of the brick face is less than the depth of the brick in the wall). Similarly, block units are given in standard units measuring 7-5/8 inches by 7-5/8 inches by 15-5/8 inches, including interlocking wall block units.
Both standardized measurements are given in order of depth by height by length when the product is laid in a building wall in standard fashion (known as “stretcher” orientation when laying building brick). Furthermore, the dimensions given are actual dimensions. Nominal dimensions are slightly larger, generally to the next full inch, and include an allowance for mortar between each unit.
For purposes of this report, blocks include two main product types:
- structural concrete block
- interlocking wall block, including segmental retaining wall (SRW) blocks.
For bricks, a number of different types are evaluated, including:
- building brick
- clay paving brick
- facing brick
- chemical resistant brick
- fire brick
- specialty bricks including industrial floor brick, and sewer and manhole brick
This category also includes glazed brick, hollow brick, and thin brick (brick veneer), which are not broken out in the study. For purposes of this report, refractory brick and glass blocks are excluded.
The study includes both brick manufacturing processes of extrusion and molding:
- Extrusion creates a more uniform brick shape with cores through the center.
- Molding, a more costly process used primarily in high-end applications, creates bricks that have a more artisanal appearance and are often solid or have frogs (indentations) on non-visible faces.
Pavers are categorized by two types:
- standard design
- permeable design, allowing water to pass easily between the units and seep into the ground
Pavers are made primarily from concrete although they are also made from alternative materials such as recycled plastics. Both types are included in this report.
The market scope of the study consists of the following types:
- residential markets (conventional single-family houses, multifamily structures such as apartments, and manufactured housing)
- commercial markets (institutional buildings; office, trade, and lodging structures; industrial facilities; and other commercial facilities such as airport and bus terminals, recreational buildings, police stations, fire stations, and prisons)
- nonbuilding markets, including transportation infrastructure such as highways and streets; and utilities, including sewer and water supply, power, and telecommunications infrastructure
All markets include both new construction and renovation.
Bricks, blocks, and pavers have a variety of applications, most related to construction. Leading applications include:
- structural (primarily foundations and structural walls)
- hardscaping (paving, walls, steps, fire pits, outdoor fireplaces, and other decorative landscaping)
- siding
- indoor fireplaces and chimneys
Demand for blocks, bricks, and pavers is also segmented by the following US geographic regions:
- Northeast
- Midwest
- South
- West
Historical Trends
Demand for bricks, blocks, and pavers is closely linked to construction activity as these products are used not only in the construction of buildings but also for infrastructure projects and hardscaping.
The construction industry tends to be cyclical, and thus demand for basic construction products such as bricks and blocks and, to a lesser extent, pavers is also cyclical. However, the widespread use of these products helps to temper this cyclicality somewhat, as does use in renovation projects.
Demand for pavers has been somewhat insulated from the overall cyclicality of the construction sector for several reasons, including their:
- rising intensity of use in both residential and commercial markets
- popularity with homeowners as an easy way to improve their homes
- prevalence in the renovation market, which tends to see steadier market growth than new construction
Demand for bricks, blocks, and pavers generally lags growth in construction spending. A key factor in this phenomenon is that many of these products are used more toward the end of the construction process (such as in siding and most hardscaping applications).
Demand by Market
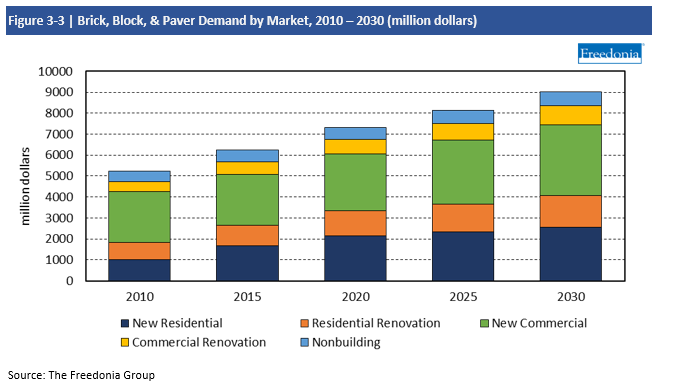
Demand for brick, block, and paver products is projected to rise through 2025 to $8.1 billion:
- The commercial market will remain the leading application for brick, block, and paver demand and post the strongest demand gains through 2024, driven in part by rising construction spending on institutional structures.
- The residential market will moderate from the prior period due to a slowing down of residential building construction and renovation after strong growth in 2020 and 2021.
Bricks, blocks, and pavers are primarily building materials and, as such, are used across the entire construction spectrum:
- Brick is used largely as a siding material although it is also employed in paving and landscaping applications, as well as in specialty uses such as sewer brick and firebrick. Demand for brick is heavily concentrated in residential markets, where it holds a significant position as a siding material.
- Structural concrete blocks tend to be more heavily concentrated in commercial markets, where they function primarily as a structural wall material. Interlocking wall blocks are primarily used in the construction of decorative and retaining walls, with demand concentrated in the commercial market.
- Pavers are used in paving applications chiefly in the residential market but also in the commercial building and nonbuilding markets.
US demand for bricks, blocks, and pavers is expected to increase 2.1% annually through 2025 to $8.1 billion, with most gains stemming from price increases. Unit growth will be restrained by:
- increased brick siding competition from other materials (such as fiber cement) that can mimic the brick aesthetic at a lower cost
- declining interest in indoor fireplaces, especially those faced in brick, in newly constructed homes
Additionally, demand was already at a high base in 2020, when the residential market was surprisingly strong. While unit sales of bricks, blocks, and pavers will remain elevated into 2022, they will begin to decline from their peak before 2025, dragging down average growth.
Supporting growth in all markets will be the rising popularity of hardscaping and outdoor living, which benefits installation of paved patios, outdoor fireplaces, and retaining walls.
Interest in Outdoor Living to Fuel Hardscaping Gains
Already a growing trend pre-pandemic, interest in outdoor living increased significantly in 2020 as homeowners sought to improve the functionality of their outdoor spaces in order to provide a safe and aesthetically pleasing area to socialize and entertain. The rising popularity of outdoor living will continue to spur a variety of home renovation projects, many of which will involve the use of bricks, blocks, and pavers. This impact will be strongest in 2021 as homeowners take on projects – including walkways, backyard gardens, patios, installation of fencing, and entertainment areas – they did not complete in 2020.
Brick Demand Supported by Residential Aesthetics & Outdoor Trends
Rising spending on residential buildings, particularly single-family homes, will boost demand for bricks used in a variety of applications. The majority of these gains will occur in hardscaping and siding:
- While brick continues to face competition from other siding materials, such as fiber cement and synthetic brick, its durability and aesthetic remains popular, particularly in the South where most new homes are being built.
- The increasing popularity of outdoor living has boosted demand for site-built outdoor fireplaces and fire pits, which are frequently made of brick.
Spending on Commercial Structures Following the Pandemic to Support Concrete Blocks
Commercial building construction declined in 2020 and has remained weak in 2021 due to caution on the part of developers and uncertainty among occupants regarding how much spaces is needed near term. However, spending on these structures is expected to recover beginning in 2022 and expand annually through 2025, driving demand gains for structural concrete blocks, which are used both in foundations and in above-grade structural walls in a variety of commercial buildings. Demand growth will be strongest for institutional buildings such as educational and healthcare structures, where concrete masonry is used intensely. Concrete block demand is also expected to increase in office buildings, retail establishments, and industrial facilities.
- Executive Summary
- Figure 1-1 - US Brick, Block, & Paver Market
- COVID-19 Pandemic
- Overview
- Impact on the Economy
- Table | Macroeconomic Indicators, 2019 - 2022
- Figure 2-1 - Real GDP by Economic Sector, 2019 - 2022
- Impact on the Construction Industry
- Table | Construction Expenditures, 2019 - 2022
- Impact on the Bricks, Blocks, & Pavers Industry
- Table | Annual Brick, Block, & Paver Demand by Product, 2019 - 2021
- Table | Annual Brick, Block, & Paver Demand by Market, 2019 - 2021
- Figure 2-2 - Annual Brick, Block, & Paver Demand Growth, 2018 - 2024
- Overview
- Study Scope & Standard Measurements
- Figure 3-1 - Study Scope: Product Examples & Applications
- Historical Trends
- Table | Brick, Block, & Paver Demand, 2010 - 2020
- Figure 3-2 - Brick, Block, & Paver Demand, 2000 - 2020
- Demand by Market
- Table | Brick, Block, & Paver Demand by Market, 2010 - 2030
- Figure 3-3 - Brick, Block, & Paver Demand by Market, 2010 - 2030
- Demand by Product
- Table | Brick, Block, & Paver Demand by Product, 2010 - 2030
- Figure 3-4 - Brick, Block, & Paver Demand by Product, 2010 - 2030
- Production & Foreign Trade
- Table | Brick, Block, & Paver Supply & Demand, 2010 - 2030
- Figure 3-5 - Brick, Block, & Paver Trade, 2010 - 2020
- Pricing Trends
- Table | Pricing for Select Brick, Block, & Paver Products, 2010 - 2030
- Sustainability Initiatives
- Recycling & Recycled Content
- Energy Efficiency
- Green Building Design & LEED
- Building Codes
- Study Scope & Standard Measurements
- Blocks
- Demand by Type
- Table | Block Demand by Type, 2010 - 2030
- Structural Concrete Block
- Scope & Product Description
- Figure 4-1 - Structural Concrete Blocks: Product Examples
- Demand by Market
- Table | Structural Concrete Block Demand by Market, 2010 - 2030
- Figure 4-2 - Structural Concrete Block Demand by Market, 2010 - 2030
- Demand by Application
- Figure 4-3 - Structural Concrete Block Demand by Application, 2010 - 2030
- Demand by Weight
- Table | Structural Block Demand by Weight, 2010 - 2030
- Competitive Products
- Figure 4-4 - Blocks: Comparative Growth with Competitive Products, 2020 - 2025
- Key Suppliers
- Scope & Product Description
- Interlocking Wall Block
- Scope & Product Description
- Figure 4-5 - Interlocking Wall Blocks: Product Examples
- Demand by Market
- Table | Interlocking Wall Block Demand by Market, 2010 - 2030
- Demand by Application
- Figure 4-6 - Hardscape Interlocking Wall Block Demand, 2000 - 2025
- Competitive Products
- Figure 4-7 - Interlocking Wall Blocks: Comparative Growth with Competitive Products, 2020 - 2025
- Key Suppliers
- Scope & Product Description
- Demand by Type
- Bricks
- Scope & Product Description
- Figure 5-1 - Bricks: Product Examples
- Demand by Market
- Table | Brick Demand by Market, 2010 - 2030
- Figure 5-2 - Brick Demand by Market, 2010 - 2030
- Demand by Application
- Table | Brick Demand by Application, 2010 - 2030
- Figure 5-3 - Brick Demand by Application, 2010 - 2030
- Product Format
- Demand by Format
- Table | Brick Demand by Format, 2010 - 2030
- Building Brick
- Paving Brick
- Facing Brick
- Chemical Resistant Brick
- Fire Brick
- Other Brick Products
- Demand by Format
- Production Process
- Table | Brick Demand by Production Process, 2010 - 2030
- Materials
- Demand by Material
- Table | Brick Demand by Material, 2010 - 2030
- Clay Bricks
- Table | Clay Brick Demand by Market, 2010 - 2030
- Concrete Bricks
- Table | Concrete Brick Demand by Market, 2010 - 2030
- Demand by Material
- Competitive Products
- Key Suppliers
- Scope & Product Description
- Pavers
- Scope & Product Description
- Figure 6-1 - Pavers: Product Examples
- Demand by Market
- Table | Paver Demand by Market, 2010 - 2030
- Figure 6-2 - Paver Demand by Market, 2010 - 2030
- Demand by Application
- Figure 6-3 - Paver Demand, 2010 - 2025
- Demand by Material
- Table | Paver Demand by Material, 2010 - 2030
- Figure 6-4 - Paver Demand by Material, 2010 - 2030
- Demand by Type
- Table | Paver Demand by Type, 2010 - 2030
- Competitive Products
- Figure 6-5 - Pavers: Comparative Growth with Competitive Products, 2020 - 2025
- Key Suppliers
- Scope & Product Description
- Residential Markets
- Market Scope
- Demand by Product
- Figure 7-1 - Residential Brick, Block, & Paver Demand by Product, 2010 - 2030
- Demand by Application
- Table | Residential Brick, Block, & Paver Demand by Application, 2010 - 2030
- Figure 7-2 - Residential Brick, Block, & Paver Demand by Application, 2010 - 2030
- Demand by Region
- Figure 7-3 - Residential Brick, Block, & Paver Demand by Region 2010 - 2030
- Market Sectors
- Demand by Market Sector
- Table | Residential Brick, Block, & Paver Demand by Market Sector, 2010 - 2030
- New Construction
- Table | New Residential Brick, Block, & Paver Demand by Application, 2010 - 2030
- Renovation
- Table | Residential Renovation Brick, Block, & Paver Demand by Application, 2010 - 2030
- Demand by Market Sector
- Housing Types
- Demand by Housing Type
- Table | Residential Brick, Block, & Paver Demand by Housing Type, 2010 - 2030
- Single-Family Homes
- Table | Single-Family Brick, Block, & Paver Demand by Market Sector, 2010 - 2030
- Multifamily Buildings
- Table | Multifamily Brick, Block, & Paver Demand by Market Sector, 2010 - 2030
- Manufactured Housing
- Table | Manufactured Housing Brick, Block, & Paver Demand by Market Sector, 2010 - 2030
- Demand by Housing Type
- Commercial Markets
- Market Scope
- Demand by Product
- Figure 8-1 - Commercial Brick, Block, & Paver Demand by Product, 2010 - 2030
- Demand by Application
- Table | Commercial Brick, Block, & Paver Demand by Application, 2010 - 2030
- Figure 8-2 - Commercial Brick, Block, & Paver Demand by Application, 2010 - 2030
- Demand by Region
- Figure 8-3 - Commercial Brick, Block, & Paver Demand by Region, 2010 - 2030
- Market Sectors
- Demand by Market Sector
- Table | Commercial Brick, Block, & Paver Demand by Market Sector, 2010 - 2030
- New Construction
- Table | New Commercial Brick, Block, & Paver Demand by Application, 2010 - 2030
- Renovation
- Table | Commercial Renovation Brick, Block, & Paver Demand by Application, 2010 - 2030
- Demand by Market Sector
- Building Types
- Demand by Building Type
- Table | Commercial Brick, Block, & Paver Demand by Building Type, 2010 - 2030
- Institutional Buildings
- Figure 8-4 - Institutional Brick, Block, & Paver Demand, 2010 - 2030
- Retail & Lodging Buildings
- Figure 8-5 - Retail & Lodging Brick, Block, & Paver Demand, 2010 - 2030
- Office Buildings
- Figure 8-6 - Office Brick, Block, & Paver Demand, 2010 - 2030
- Industrial & Other Commercial Buildings
- Figure 8-7 - Industrial & Other Commercial Brick, Block, & Paver Demand, 2010 - 2030
- Demand by Building Type
- Nonbuilding Markets
- Market Scope
- Demand by Product
- Figure 9-1 - Nonbuilding Brick, Block, & Paver Demand by Product, 2010 - 2030
- Demand by Application
- Table | Nonbuilding Brick, Block, & Paver Demand by Application, 2010 - 2030
- Figure 9-2 - Nonbuilding Brick, Block, & Paver Demand by Application, 2010 - 2030
- Demand by Region
- Figure 9-3 - Nonbuilding Brick, Block, & Paver Demand by Region, 2010 - 2030
- Applications
- Demand by Application
- Table | Brick, Block, & Paver Demand by Application, 2010 - 2030
- Figure 10-1 - Brick, Block, & Paver Demand by Application, 2010 - 2030
- Structural
- Table | Brick, Block, & Paver Demand in Structural Applications, 2010 - 2030
- Hardscaping
- Table | Hardscaping Brick, Block, & Paver Demand by Application, 2010 - 2030
- Paving
- Retaining Walls
- Outdoor Fireplaces & Fire Pits
- Other Hardscaping
- Siding
- Table | Brick, Block, & Paver Demand in Siding Applications, 2010 - 2030
- Indoor Fireplaces & Chimneys
- Table | Brick, Block, & Paver Demand in Indoor Fireplace Applications, 2010 - 2030
- Other Applications
- Table | Brick, Block, & Paver Demand in Other Applications, 2010 - 2030
- Demand by Application
- Regions
- Demand by Region
- Table | Brick, Block, & Paver Demand by Region, 2010 - 2030
- Figure 11-1 - Brick, Block, & Paver Demand by Region, 2010 - 2030
- Northeast
- Demand by Subregion & Market
- Table | Northeast: Brick, Block, & Paver Demand by Subregion & Market, 2010 - 2030
- New England
- Middle Atlantic
- Demand by Subregion & Market
- Midwest
- Demand by Subregion & Market
- Table | Midwest: Brick, Block, & Paver Demand by Subregion & Market, 2010 - 2030
- East North Central
- West North Central
- Demand by Subregion & Market
- South
- Demand by Subregion & Market
- Table | South: Brick, Block, & Paver Demand by Subregion & Market, 2010 - 2030
- South Atlantic
- East South Central
- West South Central
- Demand by Subregion & Market
- West
- Demand by Subregion & Market
- Table | West: Brick, Block, & Paver Demand by Subregion & Market, 2010 - 2030
- Mountain
- Pacific
- Demand by Subregion & Market
- Demand by Region
- Key Suppliers & Market Share
- Industry Composition
- Table | Brick, Block, & Paver Sales by Company, 2020
- Market Share
- Figure 12-1 - Brick, Block, & Paver Market Share by Company, 2020
- CRH
- Figure 12-2 - Brick, Block, & Paver Market, 2020: Leading Supplier
- CEMEX
- Figure 12-3 - Brick, Block, & Paver Market, 2020: Second Leading Supplier
- QUIKRETE
- Figure 12-4 - Brick, Block, & Paver Market, 2020: Third Leading Supplier
- Berkshire Hathaway
- Figure 12-5 - Brick, Block, & Paver Market, 2020: Fourth Leading Supplier
- Mergers & Acquisitions
- Table | Selected Mergers & Acquisitions
- List of Industry Participants
- Table | Selected Industry Participants
- Industry Composition
- Appendix
- Scope
- Table | Study Scope: US Geographic Regions & Subregions
- Table | Relevant Industry Codes
- Table | Relevant HS Codes
- Definitions
- General
- Markets
- Products
- Abbreviations
- Table | Abbreviations & Acronyms Used in Study
- Freedonia Methodology
- A Comprehensive Approach to Data Analysis
- High-Quality, Industry-Leading Market Research
- Study-Specific Methodology
- Sources
- Associations & Agencies
- Related Studies & Reports
- Freedonia Group US Studies
- Freedonia Group Global Studies
- Freedonia Focus Reports
- Knowledge Center
- Macroeconomic Assumptions
- Economic Environment
- Table | Macroeconomic Indicators, 2010 - 2030
- Demographic Trends
- Table | Population & Households, 2010 - 2030
- Building Construction
- Table | Building Construction Expenditures, 2010 - 2030
- Residential Building Construction
- Table | Residential Building Construction Expenditures, 2010 - 2030
- Residential Improvement & Repair
- Table | Residential Improvement & Repair Expenditures, 2010 - 2030
- Commercial Building Construction
- Table | Commercial Building Construction Expenditures, 2010 - 2030
- Commercial Improvement & Repair
- Table | Commercial Building Improvement & Repair Expenditures, 2010 - 2030
- Nonbuilding Construction
- Table | Nonbuilding Construction Expenditures, 2010 - 2030
- New Housing Units
- Table | New Housing Indicators, 2010 - 2030
- Housing Stock
- Table | Housing Stock by Type, 2010 - 2030
- Figure 13-1 - Housing Stock: Share by Year of Construction, 2020
- Economic Environment
- Scope
For the purposes of this study, brick units are defined as having dimensions of 3-5/8 inches by 2-1/4 inches by 7-5/8 inches. These are known in the industry as “standard brick units”, the production of clay bricks of other dimensions are converted into an equivalent volume of standard brick units.
US demand for bricks, blocks, and pavers is expected to increase 2.1% annually through 2025 to $8.1 billion, with most gains stemming from price increases.
Unit growth will be restrained by increased brick siding competition from other materials and declining interest in indoor fireplaces, especially those faces in brick in newly constructed homes