Building Envelope in North America
This report analyzes the $103 billion building envelope industry in North America, presenting historical sales data (2014, 2019, and 2024) and forecasts (2029 and 2034) by market, product, and country.
Free Sample Report
Request a free sample of this report and our team will email it to you.
Report Overview
Building Envelope Breakthroughs: What’s Next for North America?
Key Themes Covered in this Study- Advances in insulation technologies, such as aerogels and spray foam, are improving energy efficiency in buildings.
- Building envelopes are being designed for extreme weather resilience, including high wind resistance, fireproofing, and water-tightness.
- Retrofitting existing buildings with modern insulation, windows, and cladding is crucial for meeting updated energy standards.
- Demand for customizable building facades, including engineered wood siding and decorative cladding, is growing.
Featuring 52 Tables and 56 Figures!

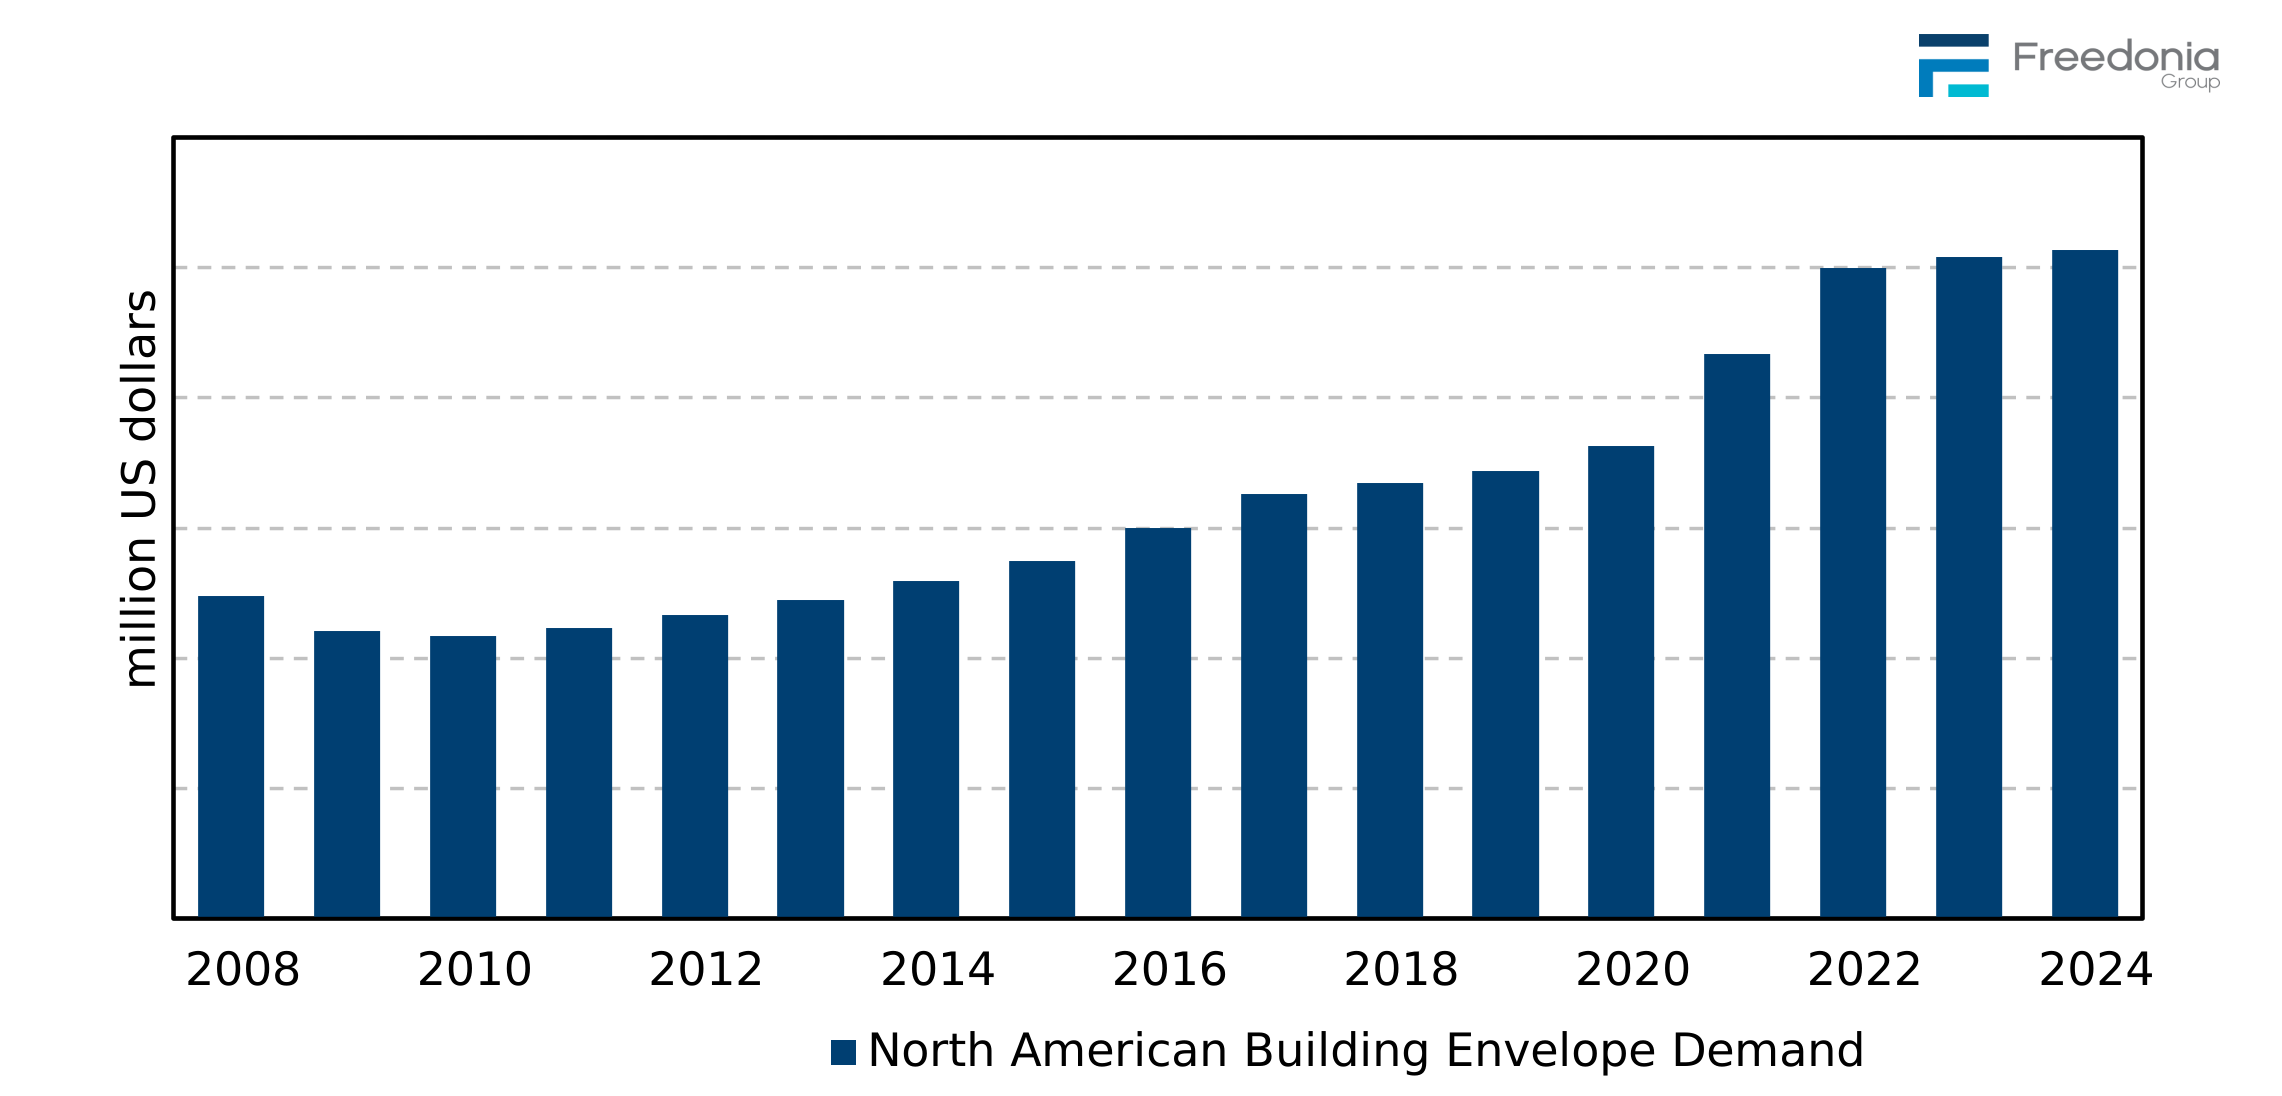
Demand for building envelope products in North America totaled $103 billion in 2024 and is forecast to rise 2.7% per year to $117 billion in 2029:
- Stricter energy codes and incentives are driving demand for energy-efficient materials like insulation, windows, and doors, offering opportunities for products that improve thermal performance and use recycled materials.
- Low-maintenance, durable materials like metal roofing and fiber cement siding are in high demand.
- Demand for weather-resistant products, such as impact-resistant windows and doors, is growing in coastal and northern regions.
- Retrofitting older buildings for energy efficiency is increasing demand for advanced insulation and air and water barriers.
Sustainable Materials Drive Demand for High-Performance Building Solutions
The shift toward sustainability in the construction industry is propelling the demand for building envelope products that offer energy efficiency and environmental benefits. Higher R-value insulation, low-emissivity windows, and durable roofing systems are becoming essential in new developments and retrofits. Stricter building codes, government incentives, and green certifications like LEED and Passive House are fueling this trend. In addition, the increasing need for climate resilience is driving the use of weather-resistant materials to protect buildings from extreme conditions.
Cityscapes Transformed: Retrofits Drive Building Envelope Market
As infrastructure ages and cities grow, the building retrofit and reroofing market is expanding rapidly. Urbanization, especially in major cities like Toronto, Vancouver, and New York City, is driving the need for advanced building envelope solutions. With stricter energy efficiency standards and government incentives encouraging renovations, both residential and commercial sectors are upgrading to high-performance materials like insulation, energy-efficient windows, and roofing systems. The boom in urban development is also increasing demand for air and water barriers, further accelerating the need for building envelopes that enhance energy efficiency, longevity, and resilience.
The Smart, Airtight Future of Building Envelopes
The rise of smart building technologies and a focus on airtightness are shaping the future of building envelopes:
- Innovations like smart windows that adjust tints based on sunlight exposure and sensors that monitor air quality, temperature, and moisture are revolutionizing energy efficiency and building performance.
- Airtightness is becoming a critical focus, with advanced air barriers and sealing systems emerging as key components in reducing energy loss.
These technologies not only improve occupant comfort but also contribute to sustainability goals, creating a significant opportunity for manufacturers to provide advanced, responsive solutions in the evolving market.
Historical Market Trends & Growth Drivers
Shifts in demand for building envelope products can vary from year to year and are determined by numerous factors, primarily those related to building construction activity. They include:
-
levels of housing starts, particularly in the single-family housing segment
-
the size and age of the US and Canadian housing stock
-
interest rates – low interest rates may encourage home and business owners to take out lines of credit often used to fund repair and replacement projects
-
the number and type of commercial buildings erected or repaired in any given year
-
the types of building envelope materials most often specified by contractors and other consumers in a particular region of the US or Canada
-
building envelope materials originally installed
Multiple other variables can affect demand for building envelope products in a particular year or over a short period of time. Among these are:
-
weather conditions, especially outbreaks of severe weather that can cause widespread damage to building structures, especially roofs (e.g., hurricanes and tropical storms, tornadoes, hailstorms, and winter storms)
-
modifications to state/province and local building codes
-
changes in the price of raw materials (e.g., asphalt, metal, acrylics, plastics) that can cause the cost of building envelope materials to increase or decrease sharply
Demand by Product
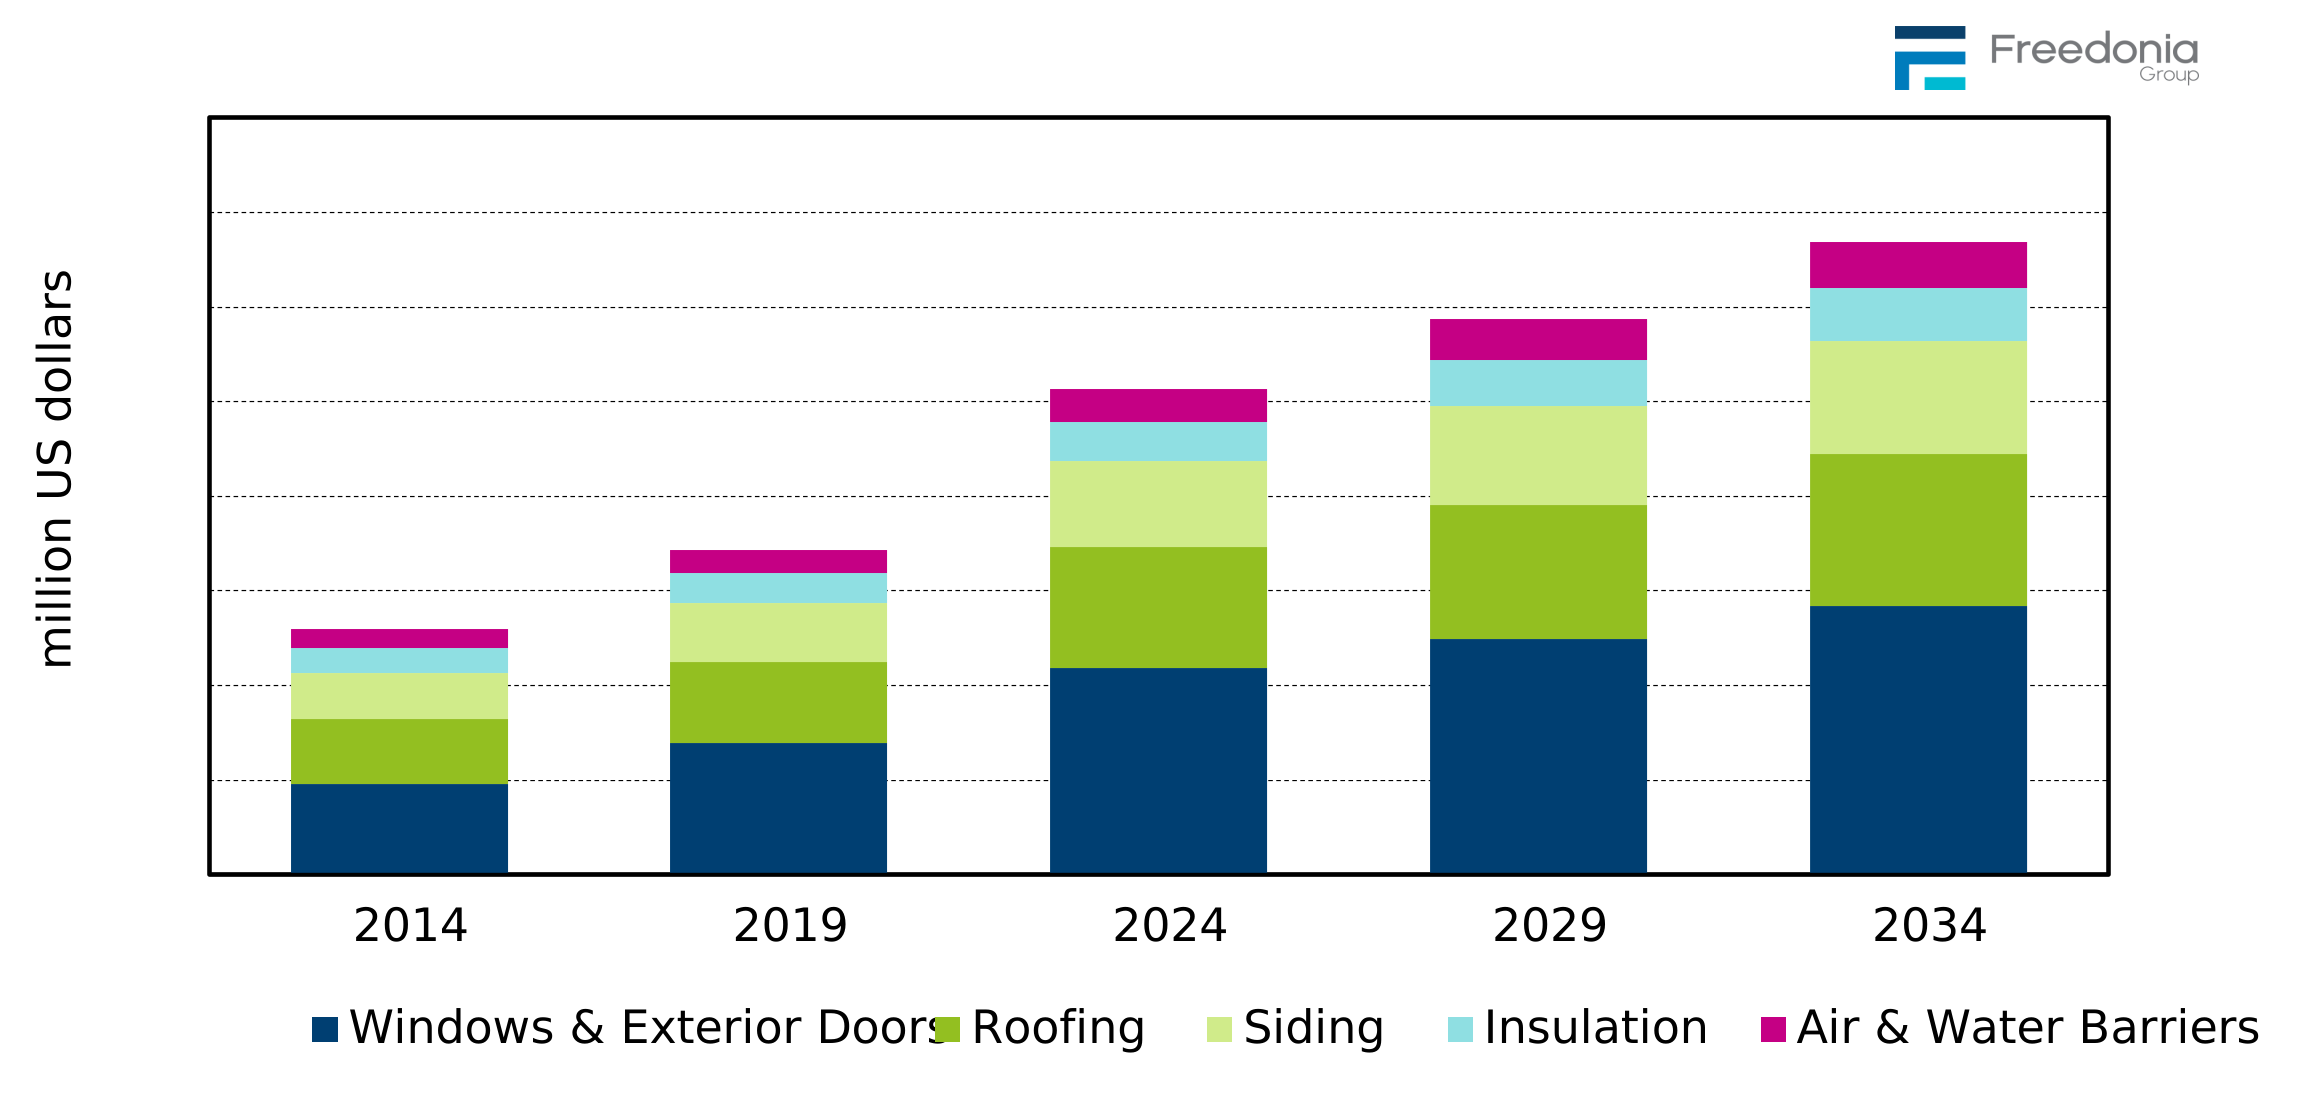
The market for building envelopes in North America is projected to grow at an annual rate of 2.7%, reaching $117 billion in 2029.
-
In windows, energy-efficient options like double-glazed and insulated models are growing, particularly in residential and commercial sectors, with energy-efficient and decorative exterior doors also in demand.
-
The roofing market remains dominated by asphalt shingles, but alternatives like metal and solar roofing are gaining ground due to their performance and aesthetic benefits.
-
In the siding market, vinyl leads in volume terms due to affordability, though fiber cement and engineered wood are gaining popularity for durability, fire resistance, and sustainability. Residential demand for roofing and siding remains strong, especially for energy-efficient solutions, with colder regions preferring more durable and insulated products.
-
Insulation demand is also growing, especially for energy efficiency, with fiberglass leading in both the US and Canada. Foamed plastic and mineral wool are seeing increased use due to tighter building codes and sustainability goals.
-
The air and water barriers market is growing as building codes and extreme weather events push for better moisture management and energy efficiency. In both countries, there is a focus on green building certifications like LEED, and government incentives further drive demand for energy-efficient products across all sectors.
Markets Overview (Residential vs. Commercial)
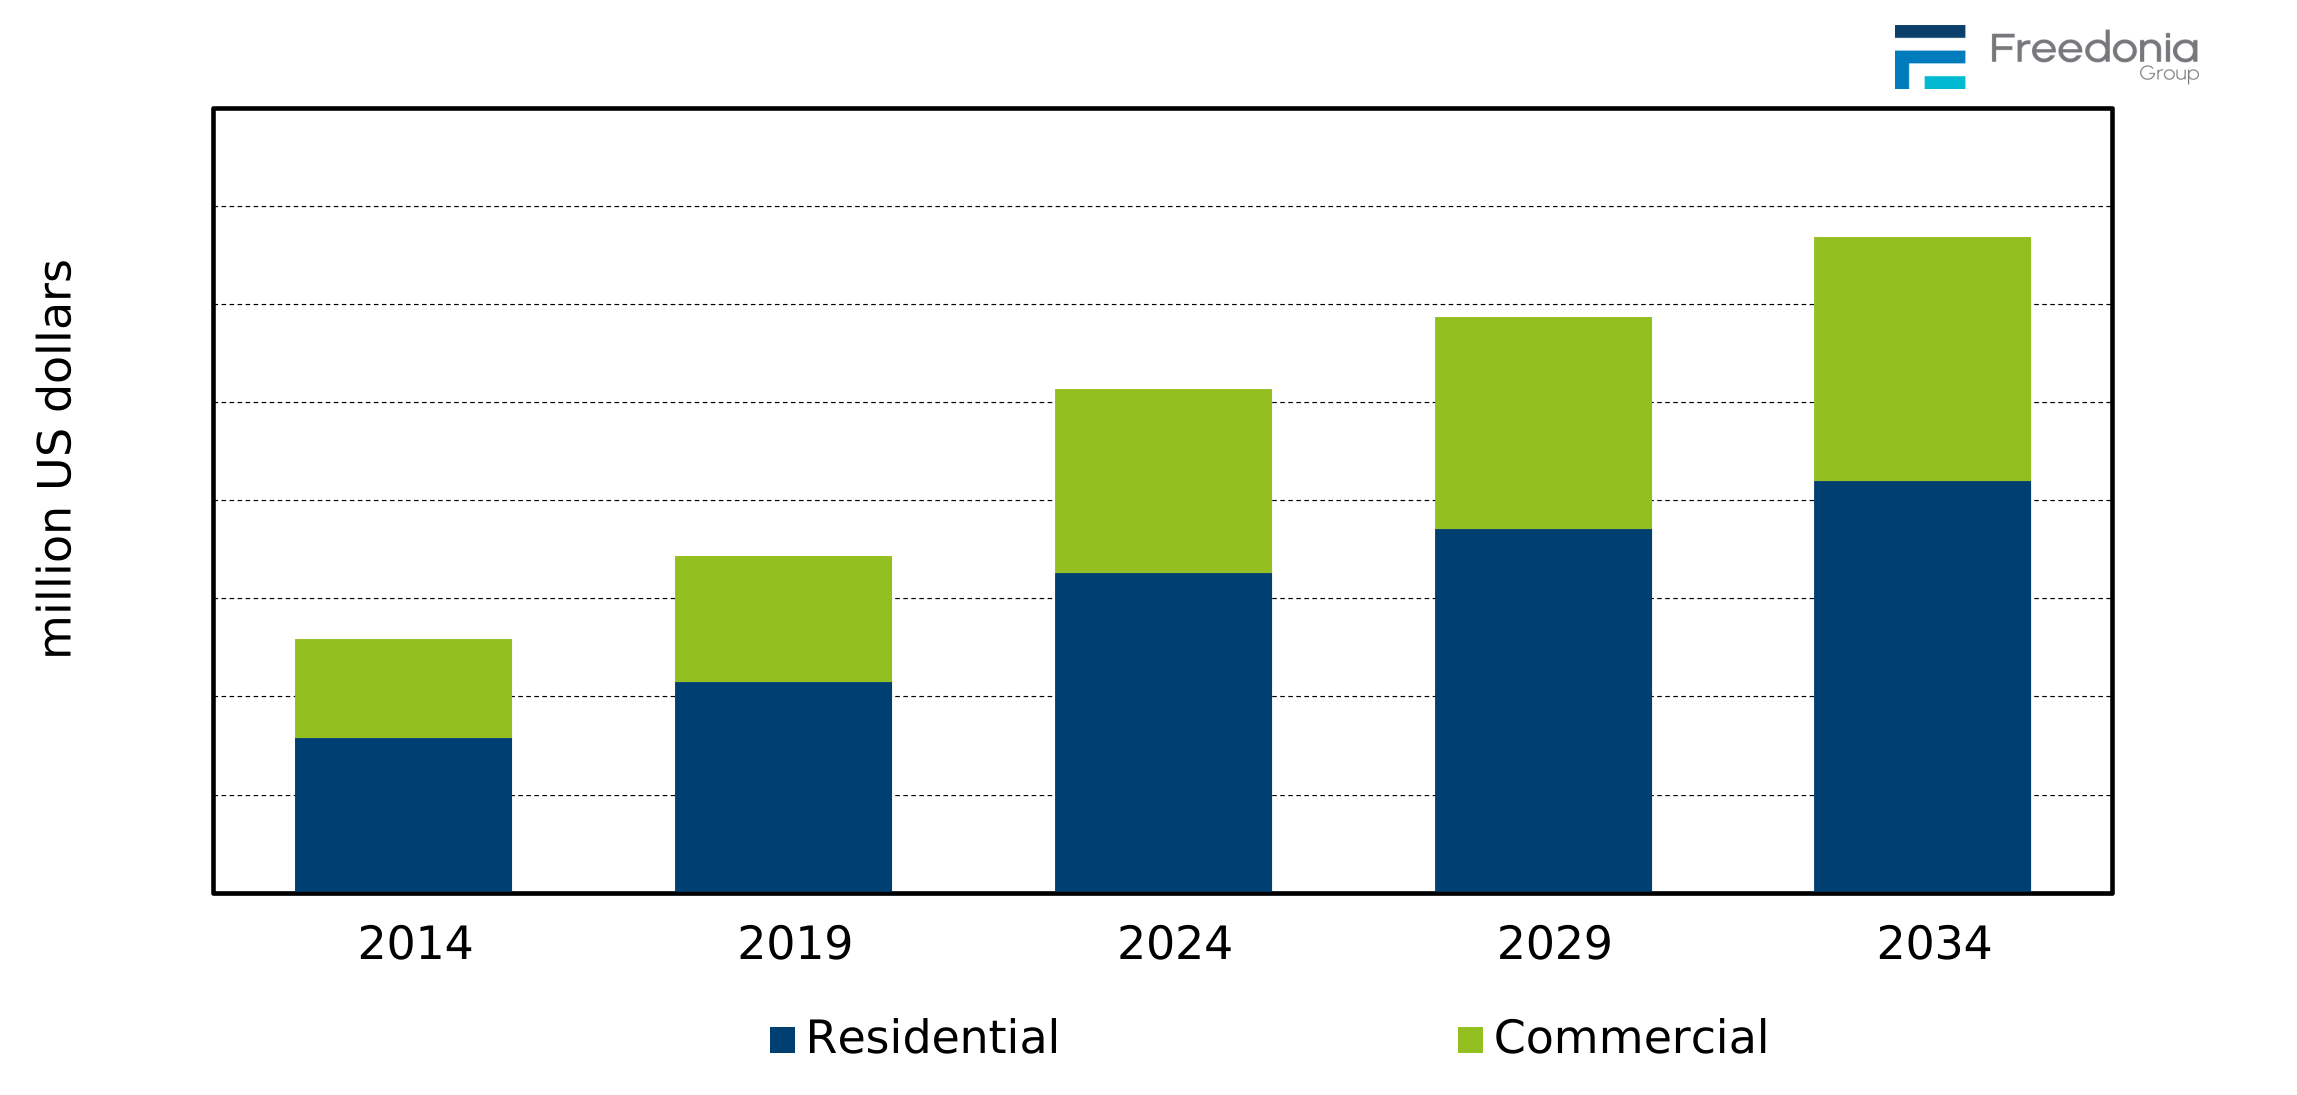
Residential markets accounted for most building envelope product sales in 2024, which is in line with the greater share of total building construction activity held by residential buildings. Residential buildings are significant users of building envelope products due to the:
-
large number of new homes, especially single-family residences, erected each year compared to commercial structures
-
higher levels of homeowner interest in building products for aesthetic reasons (such as to improve curb appeal) – a factor considered less often among commercial property owners
-
more frequent replacement of residential building envelope products (which are often less durable than commercial products)
Gains in the residential market will be supported by an increase in new single-family housing and ongoing growth in home improvement and repair activity. Market value will also be supported by the increasing use of higher-value products.
Growth in the commercial market will be supported by an improved outlook for commercial building construction, as well as growing demand for high-performance building envelope to increase the energy efficiency of commercial buildings.
Pricing & Inflation Impact
Building envelope product price levels differ greatly. Factors impacting the price of building envelope products in general include:
-
the prices of key raw materials (e.g., asphalt, metal, plastic resins, lumber, vinyl, fiberglass)
-
production costs (manufacturing equipment, energy)
-
transportation and distribution expenses for finished products
-
labor, as many industries have trouble finding trained, skilled workers to operate and maintain production equipment
In both 2021 and 2022, pricing for building envelope products was affected by significant supply chain issues that plagued numerous industries. Product shortages and higher raw material costs continued to elevate building envelope prices, especially for products that require crude oil. However, many of these issues began to ease in 2023, and pricing began to normalize in both 2023 and 2024.
Going forward, average prices will be supported by manufacturers offering products with enhanced performance and aesthetic properties that justify higher price points. These often use raw materials more intensively, boosting the unit price of the finished product. Examples include:
-
polymer-modified bituminous membranes
-
fiber cement siding, as products become better suited for high-end residential applications
-
more durable and aesthetically appealing vinyl siding
-
plastic and rubber roofing membranes with thicker backings
-
self-adhered air and water barrier products
Building Construction Outlook
A key factor affecting demand for building envelope products is the health and composition of the North American construction industry. These products, which are designed to protect structures (and their interiors) from the elements, are necessary for properly functioning building envelopes. Therefore, some type of building envelope product is installed on virtually every structure, and they can play important roles in improving energy efficiency. The types of products used can, however, vary significantly depending on the structure’s intended use (residential or commercial) and whether it is new construction or renovation.
Building construction activity in North America is forecast to grow 1.6% per year to $2.1 trillion in 2029. Ongoing growth in the US and a rebound in both residential and nonresidential building construction will support gains.
Related Industry Codes
| NAICS Code | Code Description |
|---|---|
| 238160 | Roofing Contractors |
| 321113 | Sawmills |
| 321911 | Wood Window & Door Manufacturing |
| 321912 | Cut Stock, Resawing Lumber, & Planing |
| 321219 | Reconstituted Wood Product Manufacturing |
| 324122 | Asphalt Shingle & Coating Materials Manufacturing |
| 325510 | Paint & Coating Manufacturing |
| 326140 | Polystyrene Foam Product Manufacturing |
| 326150 | Urethane & Other Foam Product (Except Polystyrene) Manufacturing |
| 326199 | All Other Plastic Products Manufacturing |
| 326299 | All Other Rubber Product Manufacturing |
| 327120 | Clay Building Material & Refractories Manufacturing |
| 327212 | Other Pressed & Blown Glass & Glassware Manufacturing |
| 327331 | Concrete Block & Brick Manufacturing |
| 327390 | Other Concrete Product Manufacturing |
| 327420 | Gypsum Product Manufacturing |
| 327991 | Cut Stone & Stone Product Manufacturing |
| 327992 | Ground or Treated Mineral & Earth Manufacturing |
| 327993 | Mineral Wool Manufacturing |
| 331222 | Steel Wire Drawing |
| 332311 | Prefabricated Metal Building & Component Manufacturing |
| 332321 | Metal Window & Door Manufacturing |
| 332322 | Sheet Metal Work Manufacturing |
| 423330 | Roofing, Siding, & Insulation Material Merchant Wholesalers |
Report Coverage for Building Envelope in North America
| Current Total Market Size | $103 billion |
| Forecast Total Market Growth Rate | 2.7% CAGR from 2024-2029 |
| Historical Period | 2014, 2019, 2022-2024 |
| Forecast Period | 2025, 2026, 2029, 2034 |
| Units Covered | Revenue in million USD, volume |
| Regions | North America (US & Canada) |
| Countries Individually Covered | n/a |
| Products | Windows, exterior doors, roofing, siding, insulation, air and water barriers |
| Markets | Residential, Commercial |
| Point Where Data is Measured | Manufacturer’s Level, Ex Factory |
| Additional Elements | Market Share, Short Term Industry Trends, Pricing & Inflation |
Key Industry Participants Driving Trends
| Owens Corning |
| GAF Materials |
| CertainTeed |
| Andersen |
| Cornerstone Building Brands |
| James Hardie |
| Carlisle Companies |
| Johns Manville |
| Knauf |
| DuPont |
Building Envelope in North America Report Scope
This report covers the market for building envelope products in the US and Canada. Historical data are presented for 2014, 2019, and 2024, with forecasts given for 2029 and 2034, in US dollars. Annual demand from 2021 to 2028 is also included. Demand in area and/or volume terms is provided for certain products.
Demand is provided separately for the US and Canada, as well as by market in terms of residential and commercial sales.
Building envelope products and materials covered in this study include:
-
windows and exterior doors (metal, wood, vinyl, fiberglass)
-
primary roofing materials (e.g., asphalt shingles, metal, bituminous, plastic, wood)
-
siding (e.g., brick, concrete, stone, vinyl, fiber cement, metal panels, stucco, EIFS, wood)
-
building insulation (e.g., fiberglass, foamed plastic, mineral wool)
-
air and water barriers
-
flashing
-
roofing underlayment
-
exterior wall water-resistive barriers
-
below-grade waterproofing
-
Excluded from the scope of this study are:
-
adhesives and sealants
-
aftermarket hardware and components
-
air barrier systems that are not applied to exterior wall sheathing
-
cover board
-
insulation for appliances
-
interior doors
-
sheathing
- Executive Summary
- Figure 1-1. North American Building Envelope Market Overview
- Short-Term Analysis
- Economic Forecast
- Table | North American Gross Domestic Product, 2022 - 2026 (billion 2023 US dollars)
- Short-Term Building Construction Outlook
- Table | North American Building Construction Expenditures, 2022 - 2026 (billion 2022 US dollars)
- Short-Term Building Envelope Industry Trends
- Table | North America: Annual Building Envelope Demand by Country & Product, 2022 - 2026 (million US dollars
- Figure 2-1. North America: Building Envelope Demand, 2022 - 2026 (million US dollars)
- Economic Forecast
- Overview
- What Is the Building Envelope?
- Study Scope
- Importance of the Building Envelope
- Historical Market Trends & Growth Drivers
- Table | North America: Building Envelope Demand by Country, 2014 - 2024 (million US dollars)
- Figure 3-1. North America: Building Envelope Demand, 2008 - 2024 (million US dollars)
- Regional Trends
- North American Demand
- Table | North America: Building Envelope Demand by Country, 2014, 2019, 2024, 2029, &2034 (million US dollar
- Table | North America: Annual Building Envelope Demand by Country, 2021 - 2028 (million US dollars)
- Figure 3-2. North America: Building Envelope Demand by Country, 2014, 2019, 2024, 2029, &2034 (milli
- United States
- Table | United States: Building Envelope Demand by Product & Market, 2014, 2019, 2024, 2029, &2034 (million
- Table | United States: Annual Building Envelope Demand by Product & Market, 2021 - 2028 (million US dollars)
- Canada
- Table | Canada: Building Envelope Demand by Product & Market, 2014, 2019, 2024, 2029, &2034 (million US doll
- Table | Canada: Annual Building Envelope Demand by Product & Market, 2021 - 2028 (million US dollars)
- North American Demand
- Demand by Product
- Table | North America: Building Envelope Demand by Product, 2014, 2019, 2024, 2029, &2034 (million US dollar
- Table | North America: Annual Building Envelope Demand by Product, 2021 - 2028 (million US dollars)
- Figure 3-3. North America: Building Envelope Demand by Product, 2014, 2019, 2024, 2029, &2034 (milli
- Markets Overview (Residential vs. Commercial)
- Table | North America: Building Envelope Demand by Market, 2014, 2019, 2024, 2029, &2034 (million US dollars
- Table | North America: Annual Building Envelope Demand by Market, 2021 - 2028 (million US dollars)
- Figure 3-4. North America: Building Envelope Demand by Market, 2014, 2019, 2024, 2029, &2034 (millio
- Pricing & Inflation Impact
- Table | North America: Building Envelope Price Deflator & Prices by Product, 2014, 2019, 2024, 2029, &2034 (
- Table | North America: Annual Building Envelope Price Deflator & Prices by Product, 2021 - 2028 (2024=100, U
- What Is the Building Envelope?
- Factors Impacting the Building Envelope Market
- Building Construction Outlook
- Table | North America: Building Construction Expenditures by Country & Market, 2014, 2019, 2024, 2029, &2034
- Building Standards & Regulations
- Building Codes
- Green Building Certification
- Health & Safety Regulations
- Labor Supply Issues
- Sustainability Initiatives
- Recycling & Recycled Content
- Building Heating & Cooling
- Product Emissions
- Energy-Efficient Production & Transportation
- Building Construction Outlook
- Windows & Exterior Doors
- Scope & Product Description
- Figure 5-1. Windows & Doors: Product Examples
- Role in Building Envelope
- Figure 5-2. Windows & Doors: Key Functions for the Building Envelope
- Regional Trends
- Demand Overview
- Table | North America: Window & Exterior Door Demand by Country, 2014, 2019, 2024, 2029, &2034 (million US d
- Figure 5-3. North America: Window & Exterior Door Demand by Country, 2014, 2019, 2024, 2029, &2034 (
- United States
- Table | United States: Window & Exterior Door Demand by Product, Material, &Market, 2014, 2019, 2024, 2029,
- Canada
- Table | Canada: Window & Exterior Door Demand by Product, Material, &Market, 2014, 2019, 2024, 2029, &2034 (
- Demand Overview
- Products
- Demand Overview
- Table | North America: Window & Exterior Door Demand by Product, 2014, 2019, 2024, 2029, &2034 (million US d
- Windows
- Figure 5-4. North America: Window Demand by Country, 2001 - 2029 (million US dollars)
- Exterior Doors
- Figure 5-5. North America: Exterior Door Demand by Country, 2001 - 2029 (million US dollars)
- Demand Overview
- Material Trends
- Table | North America: Window & Exterior Door Demand by Material, 2014, 2019, 2024, 2029, &2034 (million US
- Figure 5-6. North America: Window & Exterior Door Demand by Material, 2014, 2019, 2024, 2029, &2034
- Markets
- Demand by Market
- Table | North America: Window & Exterior Door Demand by Market, 2014, 2019, 2024, 2029, &2034 (million US do
- Residential
- Figure 5-7. North America: Residential Window & Exterior Door Demand by Country, 2001 - 2029 (millio
- Commercial
- Figure 5-8. North America: Commercial Window & Exterior Door Demand by Country, 2001 - 2029 (million
- Demand by Market
- New Product Development
- Smart Windows
- Figure 5-9. Smart Windows: Product Examples
- Hurricane Resistance
- Figure 5-10. Hurricane Resistance: Product Examples
- Thin Triple-Pane Windows
- Figure 5-11. Thin Triple-Pane Windows: Product Examples
- Smart Windows
- Key Suppliers
- Scope & Product Description
- Roofing
- Scope & Product Description
- Figure 6-1. Roofing: Products Examples
- Role in Building Envelope
- Figure 6-2. Roofing: Key Functions for the Building Envelope
- Regional Trends
- Demand Overview
- Table | North America: Roofing Demand by Country, 2014, 2019, 2024, 2029, &2034 (million US dollars & millio
- Figure 6-3. North America: Roofing Demand by Country, 2014, 2019, 2024, 2029, &2034 (million US doll
- United States
- Table | United States: Roofing Demand by Material & Market, 2014, 2019, 2024, 2029, &2034 (million US dollar
- Canada
- Table | Canada: Roofing Demand by Material & Market, 2014, 2019, 2024, 2029, &2034 (million US dollars & mil
- Demand Overview
- Materials Trends
- Table | North America: Roofing Demand by Material, 2014, 2019, 2024, 2029, &2034 (million US dollars)
- Figure 6-4. North America: Roofing Demand by Material, 2014, 2019, 2024, 2029, &2034 (million US dol
- Markets
- Demand by Market
- Table | North America: Roofing Demand by Market, 2014, 2019, 2024, 2029, &2034 (million US dollars)
- Residential
- Figure 6-5. North America: Residential Roofing Demand by Country, 2001 - 2029 (million US dollars)
- Commercial
- Figure 6-6. North America: Commercial Roofing Demand by Country, 2001 - 2029 (million US dollars)
- Demand by Market
- New Product Development
- More Durable, Long-Lasting Roof Materials
- Figure 6-7. More Durable, Long-Lasting Roofing Materials: Product Examples
- Labor Saving Roofing Products
- Figure 6-8. Labor Saving Roofing Products: Product Examples
- Solar Roofing
- Figure 6-9. Solar Roofing: Product Examples
- More Durable, Long-Lasting Roof Materials
- Key Suppliers
- Scope & Product Description
- Siding
- Scope & Product Description
- Figure 7-1. Siding: Product Examples
- Role in Building Envelope
- Figure 7-2. Siding: Key Functions for the Building Envelope
- Regional Trends
- Demand Overview
- Table | North America: Siding Demand by Country, 2014, 2019, 2024, 2029, &2034 (million US dollars & million
- Figure 7-3. North America: Siding Demand by Country, 2014, 2019, 2024, 2029, &2034 (million US dolla
- United States
- Table | United States: Siding Demand by Material & Market, 2014, 2019, 2024, 2029, &2034 (million US dollars
- Canada
- Table | Canada: Siding Demand by Material & Market, 2014, 2019, 2024, 2029, &2034 (million US dollars & mill
- Demand Overview
- Materials Trends
- Table | North America: Siding Demand by Material, 2014, 2019, 2024, 2029, &2034 (million US dollars)
- Markets
- Demand by Market
- Table | North America: Roofing Demand by Market, 2014, 2019, 2024, 2029, &2034 (million US dollars)
- Residential
- Figure 7-4. North America: Residential Siding Demand by Country, 2001 - 2029 (million US dollars)
- Commercial
- Figure 7-5. North America: Commercial Siding Demand by Country, 2001 - 2029 (million US dollars)
- Demand by Market
- New Product Development
- New Styles & Aesthetic Improvements
- Figure 7-6. Product Examples: New Styles & Aesthetic Improvements
- Improved Performance of Vinyl Siding
- Figure 7-7. Improved Performance of Vinyl Siding: Product Examples
- Recycled Content & Recyclability of Siding
- Figure 7-8. Recycled Content & Recyclability of Siding: Product Examples
- New Styles & Aesthetic Improvements
- Key Suppliers
- Scope & Product Description
- Insulation
- Scope & Product Description
- Figure 8-1. Thermal Building Insulation: Product Examples
- Role in Building Envelope
- Figure 8-2. Thermal Building Insulation: Key Functions for the Building Envelope
- Regional Trends
- Demand Overview
- Table | North America: Thermal Building Insulation Demand by Country, 2014, 2019, 2024, 2029, &2034 (million
- Figure 8-3. North America: Thermal Building Insulation Demand by Country, 2014, 2019, 2024, 2029, &2
- United States
- Table | United States: Thermal Building Insulation Demand by Material & Market, 2014, 2019, 2024, 2029, &203
- Canada
- Table | Canada: Thermal Building Insulation Demand by Material & Market, 2014, 2019, 2024, 2029, &2034 (mill
- Demand Overview
- Materials Trends
- Table | North America: Thermal Building Insulation Demand by Material, 2014, 2019, 2024, 2029, &2034 (millio
- Markets
- Demand by Market
- Table | North America: Thermal Building Insulation Demand by Market, 2014, 2019, 2024, 2029, &2034 (million
- Residential
- Figure 8-4. North America: Residential Thermal Insulation Demand by Country, 2001 - 2029 (million US
- Commercial
- Figure 8-5. North America: Commercial Thermal Insulation Demand by Country, 2001 - 2029 (million US
- Demand by Market
- New Product Development
- Eco-Friendly Blowing Agents for Spray-Foam Plastic Insulation
- Figure 8-6. Eco-Friendly Blowing Agents for Spray Foam Insulation: Product Example
- Sustainable Materials
- Figure 8-7. Sustainable Insulation Materials: Product Examples
- Safer & Faster to Install Products
- Figure 8-8. Safer and Faster to Install Products: Product Example
- Eco-Friendly Blowing Agents for Spray-Foam Plastic Insulation
- Key Suppliers
- Scope & Product Description
- Air & Water Barriers
- Scope & Product Description
- Figure 9-1. Air & Water Barriers: Product Examples
- Role in Building Envelope
- Figure 9-2. Air & Water Barriers: Key Functions for the Building Envelope
- Regional Trends
- Demand Overview
- Table | North America: Air & Water Barrier Demand by Country, 2014, 2019, 2024, 2029, &2034 (million US doll
- Figure 9-3. North America: Air & Water Barrier Demand by Country, 2014, 2019, 2024, 2029, &2034 (mil
- United States
- Table | United States: Air & Water Barrier Demand by Product & Market, 2014, 2019, 2024, 2029, &2034 (millio
- Canada
- Table | Canada: Air & Water Barrier Demand by Product & Market, 2014, 2019, 2024, 2029, &2034 (million US do
- Demand Overview
- Products
- Demand by Product
- Table | North America: Air & Water Barrier Demand by Product, 2014, 2019, 2024, 2029, &2034 (million US doll
- Flashing
- Figure 9-4. North America: Flashing Demand by Country, 2001 - 2029 (million US dollars)
- Roofing Underlayment
- Figure 9-5. North America: Roofing Underlayment Demand by Country, 2001 - 2029 (million US dollars)
- Exterior Wall Water-Resistive Barriers
- Figure 9-6. North America: Exterior Wall Water-Resistive Barrier Demand by Country, 2001 - 2029 (mil
- Below-Grade Waterproofing
- Figure 9-7. North America: Below-Grade Waterproofing Demand by Country, 2001 - 2029 (million US doll
- Demand by Product
- Markets
- Demand by Market
- Table | North America: Air & Water Barrier Demand by Market, 2014, 2019, 2024, 2029, &2034 (million US dolla
- Residential
- Table | North America: Residential Air & Water Barrier Demand by Country, 2014, 2019, 2024, 2029, &2034 (mil
- Commercial
- Table | North America: Commercial Air & Water Barrier Demand by Country, 2014, 2019, 2024, 2029, &2034 (mill
- Demand by Market
- New Product Development
- Fluid/Liquid-Applied Products
- Figure 9-8. Fluid/Liquid-Applied Products: Product Examples
- Easy-to-Install Products
- Figure 9-9. Easy-to-Install Products: Product Examples
- Recycled Content & Recyclability of Air & Water Barriers
- Figure 9-10. Recycling Content & Recyclability of Air & Water Barriers: Product Examples
- Fluid/Liquid-Applied Products
- Key Suppliers
- Scope & Product Description
- Competitive Analysis
- Which Companies Supply Building Envelope Products?
- Market Share
- Figure 10-1. North America Building Envelope Market Share by Company, 2024 (billion US dollars)
- Figure 10-2. North America Building Envelope Market: Leading Supplier, 2024
- Figure 10-3. North America Building Envelope Market: Second Leading Supplier, 2024
- Figure 10-4. North America Building Envelope Market: Third Leading Supplier, 2024
- Distribution Channels
- Appendix
- Report Details
- Table | Relevant Industry Codes
- Table | Relevant HS Codes
- Definitions
- Abbreviations
- Table | Abbreviations & Acronyms Used in Study
- Freedonia Methodology
- Study-Specific Methodology
- Data Changes from Previous Versions
- Sources
- Associations & Agencies
- Related Studies & Reports
- Macroeconomic Assumptions
- Economic Environment
- Table | North America: Macroeconomic Indicators, 2014, 2019, 2024, 2029, &2034 (billion US 2022 dollars)
- Demographic Trends
- Table | North America: Population & Households, 2014, 2019, 2024, 2029, &2034 (million persons)
- Residential Building Construction
- Table | North America: Residential Building Construction Expenditures, 2014, 2019, 2024, 2029, &2034 (billio
- Commercial Building Construction
- Table | North America: Commercial Building Construction Expenditures, 2014, 2019, 2024, 2029, &2034 (billion
- Economic Environment
- Report Details
In both 2025 and 2026, the building envelope market in North America is forecast to advance at healthy rates, supported by growth in building construction activity and ongoing efforts to increase energy efficiency in both the residential and commercial markets.
Building envelope products in North America totaled $103 billion in 2024.
In 2024, the North American building envelope market was led by three companies – Owens Corning, CertainTeed (Saint-Gobain), and GAF Materials (Standard Industries).