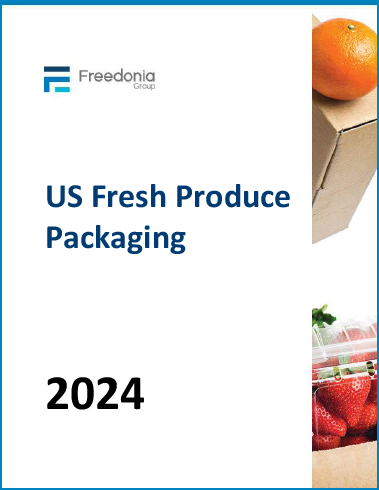
US Fresh Produce Packaging
This Freedonia industry study analyzes the $6.1 billion US market for fresh produce packaging. It presents historical demand data (2013, 2018, and 2023) and forecasts (2028 and 2033) as well as annual data for years 2020-2027.
Free Sample Report
Request a free sample of this report and our team will email it to you.
Report Overview
Freshness and shelf life are key to fresh produce packaging. How will new technology benefit consumers?
This Freedonia industry study analyzes the $6.1 billion US market for fresh produce packaging. It presents historical demand data (2013, 2018, and 2023) and forecasts (2028 and 2033) as well as annual data for years 2020-2027. Unit demand and value demand data is shown for fresh produce packaging by material (plastic, paper & paperboard, molded fiber, and other materials), product type (clamshells, two-piece containers, tubs & cups, pails, boxes & cartons, trays, platters, baskets & punnets, wood crates, RPCs, bags, pouches, wrap, lidding) and market (fruits, vegetables, and salad & greens). The study also evaluates company market share and competitive analysis on industry competitors including International Paper, WestRock, Packaging Corporation of America, Georgia-Pacific, and Sonoco Products.
Featuring 107 tables and 60 figures – available in Excel and Powerpoint! Learn More
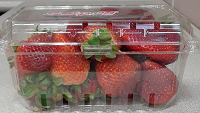 Demand for fresh produce packaging is forecast to increase 2.4% per year to $7.3 billion in 2028 or 59 billion units. Market value gains will be supported by modest growth in unit sales as well as by:
-
rising demand for value-added produce packaging, such as resealable trays and stand-up pouches
-
a continued transition from pillow pouches to higher value plastic trays with lidding and plastic containers for salads and leafy greens
-
increasing sales of fresh-cut produce – such as prechopped celery or ready-to-eat mixed berries – which are typically sold in tubs, cups, or other higher value containers
Plastic Trays & Containers to Outpace Other Major Packaging Types
Plastic trays with lidding, tubs, cups, and two-piece containers are expected to outperform bags and pillow pouches in retail markets due to their strong performance across numerous key applications, including salads, berries, and fresh-cut produce. Despite rising concerns over the sustainability of plastic packaging, paper and molded fiber alternatives have struggled to capture significant market share due to plastic’s strong protective abilities, clarity, and capacity to extend shelf-life.
See the blog Packaged Healthy Food in the Food Packaging Industry
Apples & Salad to Drive Overall Produce Packaging Demand
Apples and salad will outperform other types of produce throughout the forecast period and combined will account for a majority of absolute gains in unit and value terms through 2028:
-
Unit gains for apple packaging will be aided by the increase in packaged apples as opposed to unpackaged options, while market value will be boosted by the growth of value-added items (such as resealable stand-up pouches and large clamshells) over traditional bags.
-
Salad’s market position will be supported by the growing consumer preference for leafy greens and salad mixes over head lettuce. Additionally, a transition to higher-value packaging – such as trays with resealable lidding and modified atmosphere packaging (MAP) – will boost market value.
Convenience is King as Consumers Seek to Incorporate More Fresh Produce into Their Diets
Trends toward healthy eating have spurred increased fresh produce consumption and growth in direct-to-consumer outlets, such as farmer’s markets and roadside stands. However, consumers increasingly seek convenient ways of incorporating fresh fruits and vegetables into their busy schedules.
Ready-to-eat (RTE) and fresh-cut options have become a significant portion of the fresh produce market over the past decade. These products are generally packaged in rigid plastic containers, often in single-serving format, to support snacking and on-the-go eating.
Historical Market Trends
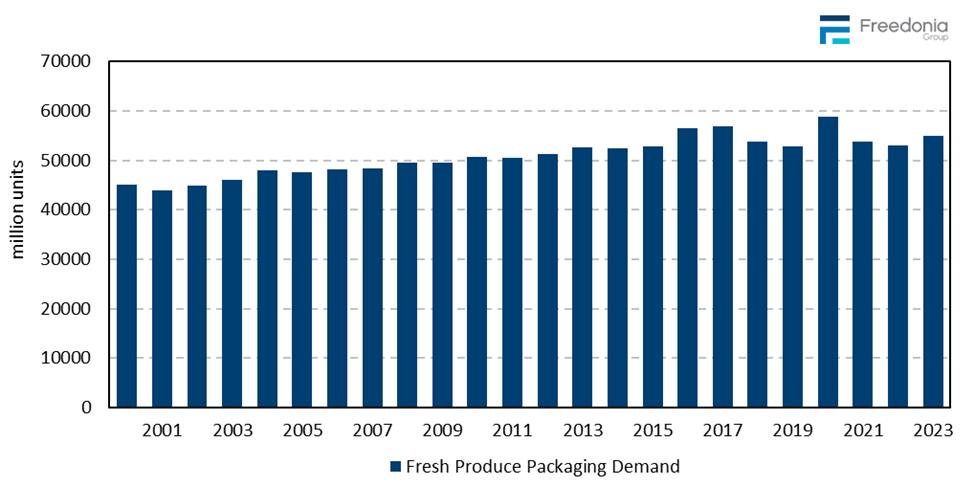
Demand for produce packaging is at its most basic level determined by the amount and type of fresh produce that requires packaging each year:
-
Products such as salad mixes, cherry tomatoes, berries, and fresh-cut produce are heavy users of packaging, while others such as whole melons or winter squash are typically sold without packaging.
-
Different types of produce require different types of packaging based on their size, shape, and hardiness. All of these factors result in variations on a year-to-year basis in packaging requirements.
Other factors that impact sales of produce packaging include:
-
sustainability initiatives, which may favor one type of packaging over another, especially in terms of the materials used
-
the volume of produce going to end users such as restaurants or processed food manufacturers as these users require different sizes or types of packaging compared to retail stores
-
retailer trends, such as growth in the ALDI store chain in the US, which more heavily packages produce items
-
the amount of produce imported or exported in its final packaging versus in bulk quantities
-
consumer preferences, which can be a positive or negative factor in packaging demand
These factors not only can change the volume of packaging needed but also affect market value depending on their impact on the packaging product mix. For example, as users switch to more expensive, more environmentally friendly packaging, this generally results in an increase in average prices and a boost to packaging market value.
Packaging Product Trends
Demand by Packaging Category: Rigid vs Flexible
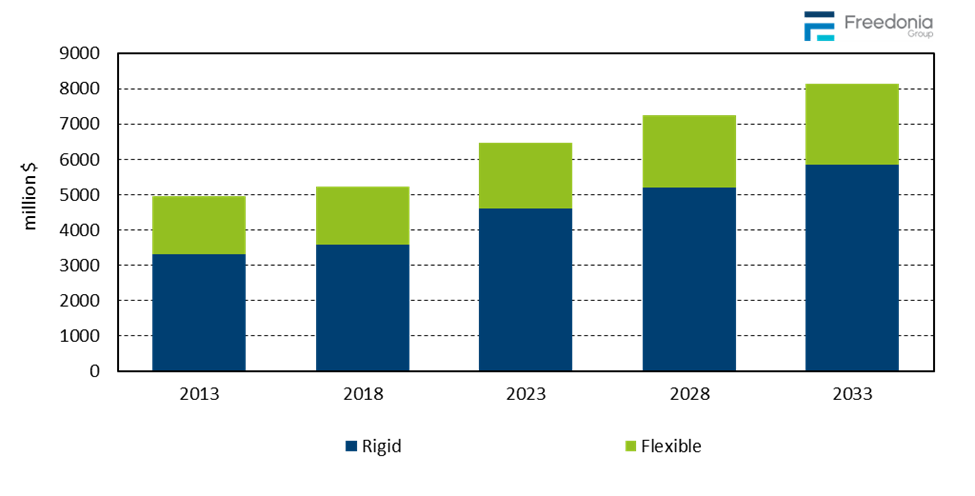
Demand for fresh produce packaging is projected to increase 2.4% per year to $7.3 billion in 2028. In unit terms, demand will rise 1.3% annually to 59 billion units. Despite relatively slow growth in domestic produce output, advances will result from increases in the amount of produce sold in retail packaging. In addition, value gains will benefit from greater use of higher-value packaging types for fresh-cut produce that offer consumer convenience, ease-of-use features (for both store personnel and customers), and improved performance characteristics to keep the contents fresh for longer.
Rigid products will increase their share of the fresh produce packaging market in both value and unit terms:
-
Corrugated packaging will remain popular despite RPCs gaining share in bulk applications.
-
Plastic containers will benefit from consumer preferences for RTE products and other fresh-cut offerings in clamshells, tubs, and other container types.
Sales of flexible packaging products – including bags, pouches, and film wrap and lidding – will continue to benefit from greater demand for packaged and fresh-cut fruits and vegetables and more intensive use of higher-value stand-up pouches. Nonetheless, bags and pouches face strong competition from rigid plastic containers and top-seal trays in areas such as salad mixes, greens, and pre-cut produce, mainly for their protective abilities.
Materials Competition
Produce packaging can be produced from a variety of materials; the most common are plastic, paper and paperboard, and molded fiber, although materials such as mesh and wood also see use.
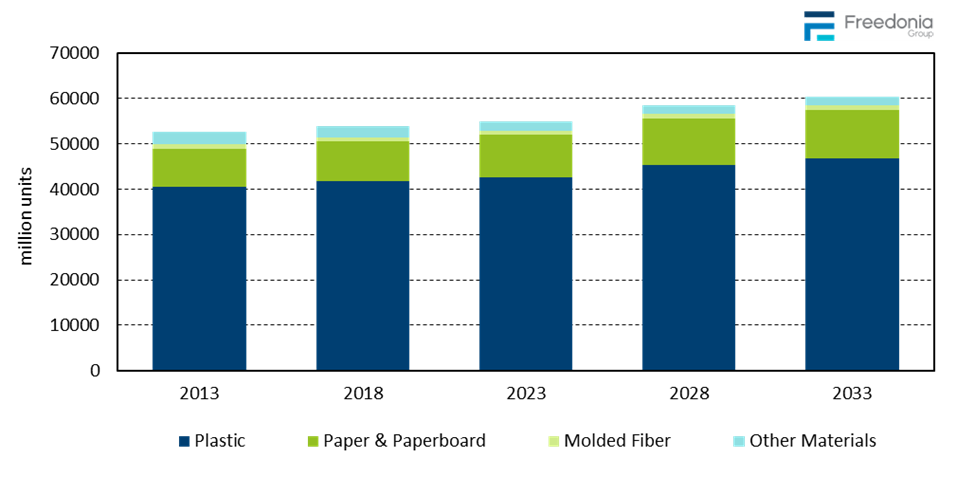
Demand for produce packaging is forecast to increase 2.4% per year to $7.3 billion in 2028, reaching 58.6 billion units.
Plastic will continue to account for the majority share of packaging sales as it is the most common option for rigid packaging such as clamshells and other plastic containers; trays and platters; baskets; and flexible packaging such as bags, pouches, wrap, and lidding.
Plastic has maintained its dominance due to performance advantages, like its light weight, moisture resistance, enhanced barrier properties, and puncture resistance. Source reduction efforts have also favored flexible plastic packaging formats (such as pouches).
The sustainability comparison between plastic and competitive materials like paper and molded fiber for produce packaging is complex:
-
Manufacture of plastic packaging generally involves the production of fewer greenhouse gases, less water, and less solid waste compared to paper. Plastic’s superior protective properties also help reduce food waste. However, bags, pouches, and other flexible plastic packaging formats are not recyclable in many locations (although an increasing number of plastic packages are made with postconsumer recycled content).
-
Paper and molded fiber packaging are positioned as renewable and have good environmental perceptions among consumers. However, both materials face performance issues like moisture resistance and durability. Some folding cartons and paper or molded fiber trays are manufactured with plastic coatings that help with moisture issues but frequently limit their recycling.
Whether paper and molded fiber are generally more sustainable than plastic, many companies are capitalizing on the notion that these materials are more eco-friendly alternatives. To that end, multiple players are developing new paper and molder fiber packaging technologies that can stand up to plastic’s performance properties.
Campaigns to improve public awareness of the energy and emissions savings related to plastic will help promote the use of plastic packaging. However, some produce suppliers – especially producers of organic or other specialty types – opt for paper or molded fiber packaging that consumers will perceive as eco-friendly.
Pricing & Inflation
The produce market for packaging is highly competitive, and pricing plays an important role in packaging choice. However, the decision process is usually more complicated than a direct comparison of unit prices.
Some of the fastest-growing types of produce packaging – such as stand-up pouches and purpose-specific plastic containers – can cost considerably more than the packaging formats with which they directly compete. However, these packaging types also offer advantages that can result in overall cost savings, higher product sales, or additional profits:
-
Display-ready corrugated boxes can be moved from storage directly onto the sales floor, saving on time and labor costs.
-
Clamshells and other plastic containers can stack, making it easier to restock and to maintain an orderly produce display.
-
Handled pouches offer a convenience factor that customers appreciate, while also making it easier to move in the produce department and at checkout.
-
Pouches, trays, and other containers that are suitable for use as cooking containers offer convenience to the consumer.
Input costs – most notably raw material costs – are the principal factor that determines packaging prices, although product complexity and manufacturing requirements are also important. For produce packaging, raw materials mainly include paperboard, pulp, and plastic resins.
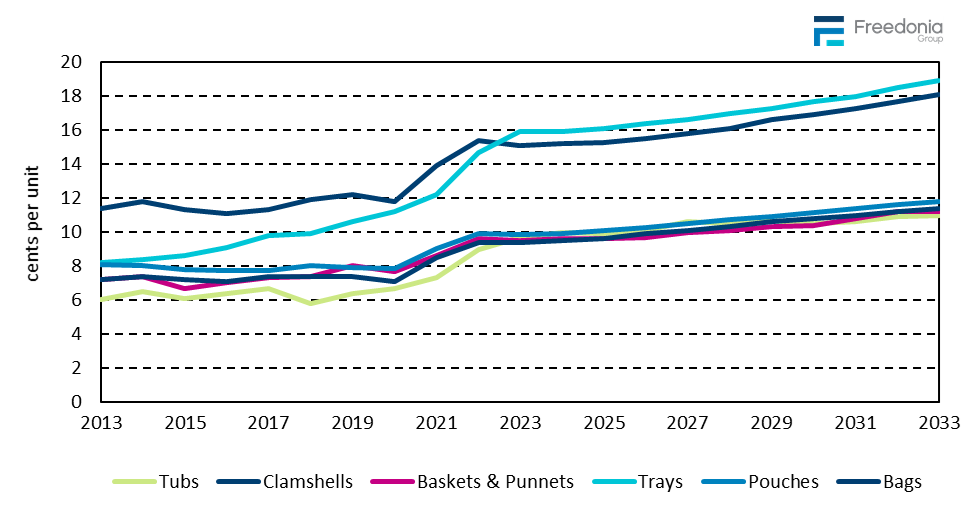
Through 2028, the average produce packaging price is expected to increase 1.2% per year – hewing closer to historical norms after a high inflationary period – to 12.4 cents per unit. Predicted price increases will mainly be supported by:
-
more intensive use of better quality materials and recycled content
-
the inclusion of higher quality graphics
-
a continued shift in the product mix to more expensive types of packaging, such as stand-up pouches and RPCs
- Executive Summary
- Figure 1-1. US Fresh Produce Packaging Market
- Short-Term Analysis
- Economic Forecast
- Table | Macroeconomic Indicators, 2021 - 2025
- Short-Term Produce Packaging Trends
- Table | Annual Fresh Produce Packaging Demand by Type, 2021 - 2025
- Figure 2-1. Fresh Produce Packaging Demand, 2021 – 2026
- Economic Forecast
- Overview
- Study Scope
- Figure 3-1. Fresh Produce Packaging: Product Examples
- Historical Market Trends
- Table | Fresh Produce Packaging Demand, 2013 – 2023
- Figure 3-2. Fresh Produce Packaging Demand, 2000 - 2023
- Packaging Product Trends
- Demand by Packaging Category: Rigid vs Flexible
- Table | Fresh Produce Packaging Demand: Rigid vs Flexible, 2013, 2018, 2023, 2028, &2033
- Table | Annual Fresh Produce Packaging Demand: Rigid vs Flexible, 2020 - 2027
- Figure 3-3. Fresh Produce Packaging Demand: Rigid vs Flexible, 2013, 2018, 2023, 2028, &2033
- Rigid Packaging for Produce
- Table | Rigid Fresh Produce Packaging Demand by Packaging Category, 2013, 2018, 2023, 2028, &2033
- Table | Annual Rigid Fresh Produce Packaging Demand by Packaging Category, 2020 - 2027
- Figure 3-4. Rigid Produce Packaging Demand by Packaging Category, 2013, 2018, 2023, 2028, &2033
- Flexible Packaging for Produce
- Table | Flexible Fresh Produce Packaging Demand by Type, 2013, 2018, 2023, 2028, &2033
- Table | Annual Flexible Fresh Produce Packaging Demand by Type, 2020 - 2027
- Figure 3-5. Flexible Fresh Produce Packaging Demand by Type, 2013, 2018, 2023, 2028, &2033
- Demand by Packaging Category: Rigid vs Flexible
- Materials Competition
- Table | Fresh Produce Packaging Demand by Material, 2013, 2018, 2023, 2028, &2033
- Table | Annual Fresh Produce Packaging Demand by Material, 2020 - 2027
- Figure 3-6. Fresh Produce Packaging Demand by Material, 2013, 2018, 2023, 2028, &2033
- Produce Categories (Vegetables, Fruit, Salad, Lettuce & Greens)
- Table | Fresh Produce Packaging Demand by Produce Category, 2013, 2018, 2023, 2028, &2033
- Table | Annual Fresh Produce Packaging Demand by Produce Category, 2020 - 2027
- Figure 3-7. Fresh Produce Packaging Demand by Produce Category, 2013, 2018, 2023, 2028, &2033
- Pricing & Inflation
- Table | Produce Packaging Average Prices, 2013, 2018, 2023, 2028, &2033
- Figure 3-8. Produce Packaging Average Prices, 2013 – 2033
- Study Scope
- Factors Impacting Packaging Demand
- Fresh Produce Distribution/Supply Chain
- Fresh Produce Production Trends
- Production by Category
- Table | US Fresh Produce Production & Consumption, 2013, 2018, 2023, 2028, &2033
- Fresh Vegetable Production Trends
- Table | US Fresh Vegetable Production, 2013, 2018, 2023, 2028, &2033
- Fresh Fruit Production Trends
- Table | US Fresh Fruit Production, 2013, 2018, 2023, 2028, &2033
- Salad, Lettuce, &Greens Production
- Table | US Fresh Salad, Lettuce, &Greens Production, 2013, 2018, 2023, 2028, &2033
- Production by Category
- Packaging Technology & Product Innovation
- MAP/CAP (Modified Atmosphere/Controlled Atmosphere)
- Table | Selected Fresh Produce MAP/CAP Suppliers
- Vacuum Packaging
- Ethylene Absorption
- Smart Packaging
- MAP/CAP (Modified Atmosphere/Controlled Atmosphere)
- Produce Processing Trends
- Fresh-Cut & Ready-to-Eat Produce
- Table | Produce Production by Processing Type, 2013, 2018, 2023, 2028, &2033
- Figure 4-1. Fresh-Cut/Ready-to-Eat Produce: Product Examples
- Microwavable/Steamable Products
- Figure 4-2. Microwavable/Steamable Packages: Product Examples
- Fresh-Cut & Ready-to-Eat Produce
- Farm to Table (Field to Fork) Product Distribution & Packaging
- Regulations
- Overview
- Food Safety
- Produce Quality Standards
- Labeling & Traceability Requirements
- Sustainability Initiatives
- Food Waste/Shelf Life
- Recycling & Recycled Content
- Biobased/Renewable Materials Use
- Consumer Insights
- Produce Forms
- Table | "In Which Form Do You Buy the Following Products?", 2024
- Fresh Produce Packaging
- Table | "In Which Type of Packaging Do You Buy Fresh or Refrigerated Produce?", 2024
- Fresh Produce Packaging Priorities
- Table | Priority of Various Packaging Features When Shopping For Produce, 2024
- Consumer Attitudes About Fresh Produce
- Table | Consumer Attitudes About Fresh Produce, by Gender, Generation, Household Income Grouping, &Eating Ha
- Attitudes About Bulk v. Packaged Fresh Produce
- Table | Consumer Attitudes About Bulk v. Packaged Fresh Produce, by Gender, Generation, Household Income Gro
- Consumer Attitudes About Sell-By Dates & Produce
- Table | Consumer Attitudes About Sell-By Dates & Produce, by Gender, Generation, Household Income Grouping,
- Produce Forms
- Plastic Packaging for Produce
- Scope & Product Description
- Figure 5-1. Plastic Packaging for Produce: Product Examples
- Advantages & Disadvantages
- Figure 5-2. Plastic Packaging for Produce: Key Advantages & Disadvantages
- Packaging Product Trends
- Table | Plastic Produce Packaging Demand by Product Category, 2013, 2018, 2023, 2028, &2033
- Materials Trends (Rigid, Flexible, Foam)
- Table | Plastic Produce Packaging Demand: Rigid, Flexible & Foam, 2013, 2018, 2023, 2028, &2033
- Produce Categories (Vegetables, Fruit, Salad, Lettuce, &Greens)
- Table | Plastic Produce Packaging Demand by Produce Category, 2013, 2018, 2023, 2028, &2033
- Key Suppliers
- Scope & Product Description
- Paper & Paperboard Packaging for Fresh Produce
- Scope & Product Description
- Figure 6-1. Paper & Paperboard Packaging for Produce: Product Examples
- Advantages & Disadvantages
- Figure 6-2. Paper & Paperboard Packaging for Produce: Key Advantages & Disadvantages
- Packaging Product Trends
- Table | Paper & Paperboard Produce Packaging Demand by Product Category, 2013, 2018, 2023, 2028, &2033
- Materials Trends (Paper, Paperboard)
- Table | Paper & Paperboard Produce Packaging Demand by Material 2013, 2018, 2023, 2028, &2033
- Produce Categories (Vegetables, Fruit, Salad, Lettuce, &Greens)
- Table | Paper & Paperboard Produce Packaging Demand by Produce Category, 2013, 2018, 2023, 2028, &2033
- Key Suppliers
- Scope & Product Description
- Molded Fiber (Molded Pulp) Packaging for Fresh Produce
- Scope & Product Description
- Figure 7-1. Molded Fiber Packaging for Produce: Product Examples
- Advantages & Disadvantages
- Figure 7-2. Molded Fiber Packaging for Produce: Key Advantages & Disadvantages
- Packaging Product Trends
- Table | Molded Fiber Produce Packaging Demand by Product Category, 2013, 2018, 2023, 2028, &2033
- Produce Categories (Vegetables, Fruit, Salad, Lettuce, &Greens)
- Table | Molded Fiber Produce Packaging Demand by Produce Category, 2013, 2018, 2023, 2028, &2033
- Key Suppliers
- Scope & Product Description
- Boxes & Cartons in Produce Packaging
- Scope & Product Description
- Figure 8-1. Boxes & Cartons for Produce Packaging: Product Examples
- Table | Commonly Used Corrugated Box Sizes for Selected Produce Types
- Advantages & Disadvantages
- Figure 8-2. Corrugated Boxes for Produce Packaging: Key Advantages & Disadvantages
- Competitive Products
- Figure 8-3. Produce Boxes: Value Growth Compared to Competitive Products, 2018 - 2028
- Demand by Box Type
- Demand Outlook
- Table | Boxes & Cartons Demand in Produce Packaging by Box Type, 2013, 2018, 2023, 2028, &2033
- Corrugated Boxes
- Table | Corrugated Box Demand for Fresh Produce by Box Type, 2013, 2018, 2023, 2028, &2033
- Folding Cartons
- Figure 8-4. Folding Carton Demand, 2013, 2018, 2023, 2028, &2033
- Demand Outlook
- Demand by Produce Category
- Table | Box & Carton Demand by Produce Category, 2013, 2018, 2023, 2028, &2033
- Market Share & Key Suppliers
- Figure 8-5. Produce Box & Carton Market Share by Company, 2023
- Table | Selected Fresh Produce Box & Carton Suppliers
- Scope & Product Description
- Produce Packaging Containers
- Scope & Product Description
- Figure 9-1. Containers for Produce Packaging: Product Examples
- Advantages & Disadvantages
- Figure 9-2. Containers for Produce Packaging: Key Advantages & Disadvantages
- Competitive Products
- Figure 9-3. Produce Containers: Value Growth Compared to Competitive Products, 2018 - 2028
- Packaging Product Trends
- Demand by Container Type
- Table | Produce Container Demand by Container Type, 2013, 2018, 2023, 2028, &2033
- Figure 9-4. Produce Container Demand by Container Type, 2013, 2018, 2023, 2028, &2033
- Clamshells
- Table | Produce Clamshell Demand by Material & Produce Category, 2013, 2018, 2023, 2028, &2033
- Tubs & Cups
- Table | Tub & Cup Demand in Fresh Produce Packaging, 2013, 2018, 2023, 2028, &2033
- Foam Boxes
- Table | Foam Box Demand in Fresh Produce Packaging, 2013, 2018, 2023, 2028, &2033
- Other Containers (Two-Piece Containers, Pails & Buckets)
- Table | Other Container Demand in Fresh Produce Packaging by Produce Category, 2013, 2018, 2023, 2028, &2033
- Demand by Container Type
- Materials Competition
- Table | Container Demand in Fresh Produce Packaging by Material, 2013, 2018, 2023, 2028, &2033
- Table | Annual Produce Container Demand by Material, 2020 - 2027
- Demand by Produce Category
- Table | Container Demand in Fresh Produce Packaging by Produce Category, 2013, 2018, 2023, 2028, &2033
- Market Share & Key Suppliers
- Figure 9-5 Fresh Produce Container Market Share by Company, 2023
- Table | Selected Fresh Produce Container Producers
- Scope & Product Description
- Bags & Liners in Produce Packaging
- Scope & Product Description
- Figure 10-1. Bags for Produce Packaging: Product Examples
- Advantages & Disadvantages
- Figure 10-2. Bags for Produce Packaging: Key Advantages & Disadvantages
- Competitive Products
- Figure 10-3. Produce Bags: Value Growth Compared to Competitive Products, 2018 - 2028
- Materials Competition
- Demand by Material
- Table | Produce Bag & Liners Demand by Material, 2013, 2018, 2023, 2028, &2033
- Figure 10-4. Produce Bag & Liner Demand by Material, 2013, 2018, 2023, 2028, &2033
- Plastic Bags & Liners
- Table | Plastic Produce Bag & Liner Demand, 2013, 2018, 2023, 2028, &2033
- Mesh Bags
- Table | Mesh Produce Bag Demand, 2013, 2018, 2023, 2028, &2033
- Paper Bags
- Table | Paper Produce Bag Demand, 2013, 2018, 2023, 2028, &2033
- Other Materials Bags
- Table | Other Materials Produce Bag Demand, 2013, 2018, 2023, 2028, &2033
- Demand by Material
- Demand by Produce Category
- Table | Produce Bag & Liner Demand by Produce Category, 2013, 2018, 2023, 2028, &2033
- Market Share & Key Suppliers
- Figure 10-5. Produce Bag Market Share by Company, 2023
- Table | Selected Fresh Produce Bag Producers
- Scope & Product Description
- Pouches in Produce Packaging
- Scope & Product Description
- Figure 11-1. Pouches for Produce Packaging: Product Examples
- Advantages & Disadvantages
- Figure 11-2. Pouches for Produce Packaging: Key Advantages & Disadvantages
- Competitive Products
- Figure 11-3. Pouches in Produce Packaging: Comparative Value Growth with Competitive Products, 2018
- Packaging Product Trends
- Demand by Pouch Type
- Table | Produce Pouch Demand by Type, 2013, 2018, 2023, 2028, &2033
- Figure 11-4. Produce Pouch Demand by Pouch Type, 2013, 2018, 2023, 2028, &2033
- Pillow & Side Seal Pouches
- Table | Produce Pillow & Side Seal Pouch Demand by Produce Category, 2013, 2018, 2023, 2028, &2033
- Stand-Up Pouches
- Table | Produce Stand-Up Pouch Demand by Produce Category, 2013, 2018, 2023, 2028, &2033
- Demand by Pouch Type
- Demand by Produce Category
- Table | Produce Pouch Demand by Produce Category, 2013, 2018, 2023, 2028, &2033
- Market Share & Key Suppliers
- Figure 11-5. Product Pouch Market Share by Company, 2023
- Table | Selected Fresh Produce Pouch Producers
- Scope & Product Description
- Trays & Platters in Produce Packaging
- Scope & Product Description
- Figure 12-1. Trays & Platters for Produce Packaging: Product Examples
- Advantages & Disadvantages
- Figure 12-2. Trays & Platters for Produce Packaging: Key Advantages & Disadvantages
- Competitive Products
- Figure 12-3. Produce Trays & Platters: Value Growth Compared to Competitive Products, 2018 - 2028
- Materials Competition
- Demand by Material
- Table | Produce Tray & Platter Demand by Material, 2013, 2018, 2023, 2028, &2033
- Rigid Plastic
- Table | Rigid Plastic Produce Tray & Platter Demand by Produce Category, 2013, 2018, 2023, 2028, &2033
- Foam
- Table | Foam Produce Tray & Platter Demand by Produce Category, 2013, 2018, 2023, 2028, &2033
- Molded Fiber
- Table | Molded Fiber Produce Tray & Platter Demand by Produce Category, 2013, 2018, 2023, 2028, &2033
- Paperboard & Other Materials
- Table | Paperboard & Other Material Produce Tray & Platter Demand by Produce Category, 2013, 2018, 2023, 202
- Demand by Material
- Demand by Produce Category
- Table | Produce Tray & Platter Demand by Produce Category, 2013, 2018, 2023, 2028, &2033
- Market Share & Key Suppliers
- Scope & Product Description
- Wrap & Lidding in Produce Packaging
- Scope & Product Description
- Figure 13-1. Wrap & Lidding for Produce Packaging: Product Examples
- Packaging Product Trends
- Demand by Type
- Table | Produce Wrap & Lidding Demand by Product Type, 2013, 2018, 2023, 2028, &2033
- Figure 13-2. Produce Wrap & Lidding Demand by Product Type, 2013, 2018, 2023, 2028, &2033
- Wrap
- Table | Produce Wrap Demand by Produce Category, 2013, 2018, 2023, 2028, &2033
- Lidding
- Table | Produce Lidding Demand by Produce Category, 2013, 2018, 2023, 2028, &2033
- Demand by Type
- Demand by Produce Category
- Table | Produce Wrap & Lidding Demand by Produce Category, 2013, 2018, 2023, 2028, &2033
- Key Suppliers
- Table | Selected Fresh Produce Wrap & Lidding Producers
- Scope & Product Description
- Baskets & Punnets
- Scope & Product Description
- Figure 14-1. Baskets & Punnets for Produce Packaging: Product Examples
- Competitive Products
- Figure 14-2. Produce Baskets & Punnets: Value Growth Compared to Competitive Products, 2018 - 2028
- Materials Competition
- Rigid Plastic
- Molded Fiber
- Paperboard
- Demand by Produce Category
- Table | Produce Basket & Punnet Demand by Produce Category, 2013, 2018, 2023, 2028, &2033
- Key Suppliers
- Scope & Product Description
- Fresh Vegetable Packaging
- Scope & Product Description
- Figure 15-1. Fresh Vegetable Packaging: Product Examples
- Demand by Packaging Type
- Table | Fresh Vegetable Packaging Demand by Type, 2013, 2018, 2023, 2028, &2033
- Figure 15-2. Fresh Vegetable Packaging Demand by Packaging Type, 2013, 2018, 2023, 2028, &2033
- Fresh-Cut/Ready-to-Eat/Ready to Cook Vegetable Packaging
- Table | Fresh-Cut/Ready-to-Eat/Ready to Cook Vegetable Packaging Demand, 2013, 2018, 2023, 2028, &2033
- Demand by Vegetable Type
- Table | Fresh Vegetable Packaging Demand by Vegetable Type, 2013, 2018, 2023, 2028, &2033
- Root Vegetables (Potatoes, Onions, Carrots, Other Root Crops)
- Table | Root Vegetable Packaging Demand by Produce Type & Product, 2013, 2018, 2023, 2028, &2033
- Tomatoes
- Table | Tomato Packaging Demand by Product, 2013, 2018, 2023, 2028, &2033
- Mushrooms
- Table | Mushroom Packaging Demand by Product, 2013, 2018, 2023, 2028, &2033
- Peppers
- Table | Pepper Packaging Demand by Product, 2013, 2018, 2023, 2028, &2033
- Other Vegetables
- Table | Other Vegetable Packaging Demand by Product, 2013, 2018, 2023, 2028, &2033
- Scope & Product Description
- Fresh Fruit Packaging
- Scope & Product Description
- Figure 16-1. Fresh Fruit Packaging: Product Examples
- Demand by Packaging Type
- Table | Fresh Fruit Packaging Demand by Type, 2013, 2018, 2023, 2028, &2033
- Figure 16-2. Fresh Fruit Packaging Demand by Type, 2013, 2018, 2023, 2028, &2033
- Fresh-Cut & Ready-to-Eat Fresh Fruit
- Table | Fresh Fruit Packaging Demand by Format, 2013, 2018, 2023, 2028, &2033
- Demand by Fruit Category
- Table | Fresh Fruit Packaging Demand by Fruit Type, 2013, 2018, 2023, 2028, &2033
- Berries & Grapes (Small Fruit)
- Table | Berries & Grapes (Small Fruit) Packaging Demand by Product, 2013, 2018, 2023, 2028, &2033
- Apples
- Table | Apple Packaging Demand by Product, 2013, 2018, 2023, 2028, &2033
- Citrus Fruit
- Table | Citrus Packaging Demand by Product, 2013, 2018, 2023, 2028, &2033
- Other Fresh Fruit
- Table | Other Fresh Fruit Packaging Demand by Product, 2013, 2018, 2023, 2028, &2033
- Scope & Product Description
- Salad, Lettuce, &Greens Packaging
- Scope & Product Description
- Figure 17-1. Fresh Salad, Lettuce, &Greens Packaging: Product Examples
- Demand by Packaging Type
- Table | Fresh Salad, Lettuce, &Greens Packaging Demand by Type, 2013, 2018, 2023, 2028, &2033
- Table | Annual Fresh Salad, Lettuce, &Greens Packaging Demand by Type, 2020 - 2027
- Figure 17-2. Fresh Salad, Lettuce, &Greens Packaging Demand by Type, 2013, 2018, 2023, 2028, &2033
- Fresh-Cut/Ready-to-Eat Salad, Lettuce, &Greens
- Table | Fresh Salad, Lettuce, &Greens Packaging Demand by Format, 2013, 2018, 2023, 2028, &2033
- Demand by Type
- Demand Outlook
- Table | Fresh Salad, Lettuce, &Greens Packaging Demand by Type, 2013, 2018, 2023, 2028, &2033
- Salad & Fresh-Cut Leafy Greens
- Figure 17-3. Salad Packaging Types
- Table | Salad Packaging Demand by Product, 2013, 2018, 2023, 2028, &2033
- Whole Lettuce
- Table | Lettuce Packaging Demand by Product, 2013, 2018, 2023, 2028, &2033
- Cabbage & Other Whole Greens (Kale, Collards, Asian Greens)
- Table | Cabbage & Other Whole Greens Packaging Demand by Product, 2013, 2018, 2023, 2028, &2033
- Demand Outlook
- Scope & Product Description
- Current Trends & Future Opportunities
- Key Findings
- Growth in Fresh-Cut & Ready-to-Eat Produce
- Figure 18-1. Ready-to-Eat Produce Packaging: Product Examples
- Growth of ALDI & Similar Low Price Grocery Chains
- E-Commerce Sales of Fresh Produce
- Introduction of New Produce Varieties
- Increasing Popularity of Locally Grown Produce
- The Walmart Effect
- Organic Produce Sales Continue to Increase
- Steamable Fresh Pouches: Will They Match Success of Frozen?
- Figure 18-2. Steamable Produce Pouches: Product Examples
- Packagers & End Users
- Produce Packager Trends
- Demand by Packager
- Table | Produce Packaging Demand by Packager, 2013, 2018, 2023, 2028, &2033
- Growers/Shippers
- Repackers & Distributors
- Retail Stores
- Demand by Packager
- End Users (Retail Sale, Foodservice, Processed Food Manufacturers)
- Produce Packager Trends
- Key Suppliers & Markets Share
- Industry Composition
- Table | US Fresh Produce Packaging Sales by Company, 2023
- Market Share
- Figure 20-1. US Fresh Produce Packaging Market Share, 2023,
- Figure 20-2. US Fresh Produce Packaging Market: Leading Supplier, 2023
- Figure 20-3. US Fresh Produce Packaging Market: Second Leading Supplier, 2023
- Figure 20-4. US Fresh Produce Packaging Market: Third Leading Supplier, 2023
- Figure 20-5. US Fresh Produce Packaging Market: Fourth Leading Supplier, 2023
- Figure 20-6. US Fresh Produce Packaging Market: Fifth Leading Supplier, 2023
- Mergers & Acquisitions
- Table | Selected Mergers & Acquisitions
- Marketing & Distribution
- Research & Development
- Competitive Strategies
- List of Industry Participants
- Table | Selected Industry Participants
- Industry Composition
- Appendix
- Report Details
- Table | Relevant HS Codes
- Table | Relevant Industry Codes
- Definitions
- Abbreviations
- Table | Abbreviations & Acronyms Used in Study
- Freedonia Methodology
- Study-Specific Methodology
- Data Changes from Previous Version
- Sources
- Associations & Agencies
- Related Studies & Reports
- Macroeconomic Assumptions
- Economic Environment
- Table | Macroeconomic Indicators, 2013, 2018, 2023, 2028, &2033
- Demographic Trends
- Table | Population & Households, 2013, 2018, 2023, 2028, &2033
- Fresh Produce Production
- Table | US Fresh Produce Production, 2013, 2018, 2023, 2028, &2033
- Table | US Fresh Vegetable Production, 2013, 2018, 2023, 2028, &2033
- Table | US Fresh Fruit Production, 2013, 2018, 2023, 2028, &2033
- Table | US Fresh Salad, Lettuce, &Greens Production, 2013, 2018, 2023, 2028, &2033
- Economic Environment
- Report Details
The market size for fresh produce packaging is $6.6 billion in 2024.
Rigid products will increase their share of the fresh produce packaging market in both value and unit terms.
The top five produce packaging companies include International Paper, WestRock, Packaging Corporation of America, Sonoco Products, and Georgia-Pacific.