Report Overview
Featuring 59 tables and 32 figures – now available in Excel and Powerpoint! Learn More

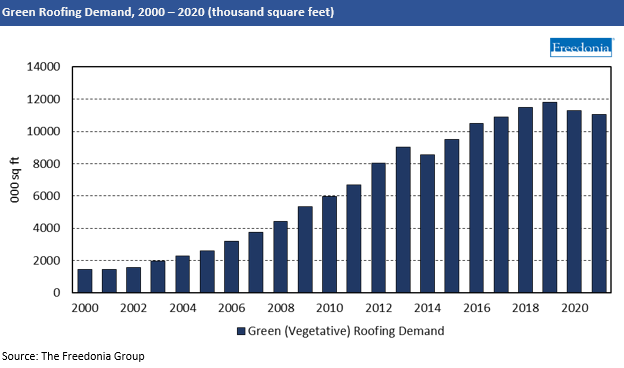
Demand for green (also called vegetative) roofing systems in the US is forecast to rise 5.1% per year to $207 million in 2025 with demand in area terms projected to reach 11.8 million square feet. Advances will be driven a post-pandemic rebound in construction of commercial buildings – such as government offices, educational facilities, and warehouses and manufacturing plants – as most green roofs are installed on these types of buildings. Additional factors supporting growth include:
- rising awareness of both the public and the private benefits of green roofs – such as reducing urban heat island effects and increasing local biodiversity while also lowering building utility costs
- the expanding number of cities with green roofing mandates and/or incentive programs that promote property owners to install green roofs
- the aesthetic appeal and recreational benefits of green space amenities
- the ability of green roofing systems to earn LEED credits for buildings
However, faster increases will be limited by the glut of vacant commercial properties in the wake of the pandemic, hindering new construction (green roofs are most often installed on new buildings) and the market will remain relatively small due in part to the relative scarcity of green roofing mandates or incentive programs throughout much of the country.
Post-Pandemic Rebound in Commercial Building Construction to Drive Market Growth
Demand for green roofing systems fell in 2020 and 2021 due to pandemic-related weakness in commercial building construction, where the vast majority of green roofs are installed. Even as economic conditions improve, many building owners and managers remain reluctant to invest in such large-scale and generally optional projects as green roofs, limiting the number of installations in the near term. Nevertheless, green roofing sales are projected to return to growth in 2022 and accelerate through 2025 as commercial building construction continues to rebound, and recently implemented green roof mandates (e.g., New York City’s 2019 Climate Mobilization Act) make a greater impact on the market.
The South Will Continue to Lead US Regions, But West to See Faster Growth
The South will remain the leading regional green roofing market through 2025, bolstered by the relatively large number of installations each year in South Atlantic cities such as Washington, DC, Atlanta, Baltimore, and Miami. However, the West will continue to post faster growth, driven by the expanding impact of green roofing initiatives in cities in the Pacific subregion, such as San Francisco and Portland, Oregon. Green roofing suppliers in these areas benefit from significant government support for vegetative roofing, as well as from warm climates that support investments to improve energy efficiency.
Sika Acquires American Hydrotech to Become Market Leader
In July 2021, Sika acquired American Hydrotech – maker of the popular Garden Roof vegetative roof system and other green roofing products – as part of a strategy to become the leading green roofing supplier in North America. The acquisition complements Sika’s existing roofing and waterproofing portfolio with a range of sustainable roofing products. Other notable acquisitions include Holcim’s April 2021 purchase of Firestone Building Products from Bridgestone and Carlisle’s July 2021 agreement to acquire Henry.

Historical Market Trends
The US green roofing market totaled 11.3 million square feet of coverage area valued at $162 million in 2020. While accounting for a very small share of the roofing industry, vegetative roofing has expanded quickly since its beginnings in the US during the 1990s. Historically, the US has lagged Europe in green roofing policies and installations. Due in part to the market’s small size, materials and installation costs in the US have remained considerably higher than those in countries such as France or Germany. Canada has also been a comparatively intensive installer of green roofs, implementing North America’s first green roofing mandate in 2009 in Toronto.
Nonetheless, demand in the US has expanded rapidly since the early 2000s (from a small base), supported by:
- media attention regarding sustainable building construction
- the availability of incentives and financial support for green building infrastructure, including green roofs
- numerous professional research projects and conferences dedicated to analyzing vegetative roof technologies and to spreading awareness about the benefits of green roofs
- the passage of the Energy Independence and Security Act of 2007, requiring federal agencies to limit stormwater runoff from federal development projects
- the implementation of stormwater retention standards and urban heat reduction programs in many US states and municipalities
- the passage of the American Recovery and Reinvestment Act of 2009, which offered federal funds for green construction spending, including the installation of vegetative roofs on several institutional buildings
- increased overall familiarity with vegetative roof technologies among building owners and installers
As in the larger roofing industry, shifts in demand for green roofing systems can vary from year to year, determined by a number of factors, including:
- the number and types of buildings erected or repaired in any given year (green roofs are most commonly installed on commercial buildings such as offices and schools and multifamily residential buildings)
- the type of roof (e.g., steep-slope or low-slope) installed on a structure (low-slope roofs are better able to support the load weight of a green roofing system)
- interest rates – low interest rates may encourage home and business owners to take out lines of credit often used to fund roof repair and replacement projects
- passage of legislation promoting installation of green roofing, such as New York City’s 2019 Climate Mobilization Act, which requires newly constructed buildings have green roofs
This study analyzes US demand for green (or vegetative) roofing by market, system type, component, and geographic region. Historical data (2010, 2015, and 2020) and forecasts for 2025 and 2030 are presented for green roofing demand in current US dollars (including inflation) and in square feet.
Data are presented at the manufacturers’ level and exclude the value of mark-ups or installation. Demand also excludes the value of existing components (e.g., waterproof membrane, insulation) that are not replaced and installed as part of the new vegetative roof assembly. For roofs that are partially covered by vegetative roofing, only the area of green roof coverage is included in the scope of this study.
Other exclusions include rooftop container gardens, living walls and vegetative building façades, decorative rooftop elements (e.g., pavers, edging), and separately sold sprinkler systems.
Green roofs are segmented by market in terms of:
- new construction
- retrofit
Demand is segmented by system type in terms of:
- extensive
- semi-intensive
- intensive
Green roof assemblies consist of a layer of vegetation planted over a waterproofing system that is installed directly on a (typically low-slope) roof. Demand in this study is segmented by the different layers typically found in a vegetative roof system, including:
- vegetation
- growing media
- geotextiles and a drainage layer
- insulation
- waterproof membrane
- other components, such as built-in irrigation components, membrane protection boards, and edging that is not part of the drainage layer
Additionally, green roofing demand is broken out for the following US geographic regions:
Northeast, Midwest, South, West.
Green roofing demand is also provided for Canada in square feet and US dollars.