Heat Pump Market in the US by Type, Market and Region
Heat pumps are a more energy efficient option for comfort cooling compared to other types of HVAC equipment, helping boost market gains.

Free Sample Report
Request a free sample of this report and our team will email it to you.
Report Overview
Continued Strength in Construction Spending to Support Sales, but Expiration of Federal Tax Credits will Prevent Faster Gains
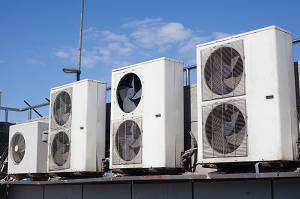
US demand for heat pumps will see a reversal from recent market declines, but the expiration of federal tax credits at the end of 2016 will result in sales continuing to stay below the highs recorded before the Great Recession. Nevertheless, ongoing strength in US building construction expenditures will support sales increases. Additionally, heat pumps are a more energy efficient option for comfort cooling compared to other types of HVAC equipment, helping boost market gains.
Key Findings in the Heat Pump Study:
Air Source Heat Pumps to Remain the Dominant Product Type
Air source heat pumps are a viable HVAC equipment option in most building settings, and have a much lower installation cost than geothermal units. Moreover, many air source heat pumps utilize the same distribution method as unitary air conditioners, and thus can replace these units as a more energy efficient type of cooling equipment that can also provide supplemental heating.
Residential Installations to Post Faster Demand Gains
Demand for heat pumps used in residential buildings is expected to climb at a faster rate through 2021 than commercial building product sales, reversing a long term trend. Strong anticipated increases in new housing completions and residential building construction expenditures will provide the main impetus to growth.
Heat Pump Demand to Remain Concentrated in the South
The climate in most Southern states, with warm summers and mild winters, is optimal for heat pump use. As a result, the region comprises more than two-thirds of total heat pump demand and will account for the majority of all additional heat pump sales through 2021. However, demand in the West will increase at a faster rate through 2021. Product improvements have enabled heat pumps to better perform in areas with colder winters and, as a result, growth in heat pump demand in the West has outpaced sales in other US regions in recent years. This trend is expected to continue through 2021.
Study Coverage
This study presents historical demand data (2006, 2011, and 2016) and forecasts (2021) by product (air source, including air-to-air and air-to water; and geothermal, including closed loop and open loop), market (residential and commercial), and US region (Northeast, Midwest, South, and West). The study also evaluates company market share and competitive analysis on industry competitors including AAON, Daikin Industries, Electrolux, GD Midea, Ingersoll-Rand, Johnson Controls, Lennox, Melrose Industries, NIBE Industrier, Paloma, and United Technologies.
- EXECUTIVE SUMMARY
- Figure 1-1 | Key Trends in the US Heat Pump Market
- OVERVIEW
- Key Findings
- Figure 2-1 | Key Trends in the Heat Pump Market
- Factors Influencing Heat Pump Demand
- Climate Zones
- Energy Profile
- Table | Average Retail Energy Costs in the US by Source, 2006-2021
- Energy Efficiency & Variable Refrigerant Flow
- Impact of Tax Credits on HVAC Equipment Demand
- Refrigerant Regulations
- Pricing Trends
- Table | Heat Pump Pricing Trends, 2006-2021
- Figure 2-2 | Heat Pump Pricing Trends, 2006-2021
- Market Volatility
- Figure 2-3 | Heat Pump Demand, 2006-2016
- Foreign Trade
- Table | Foreign Trade in Heat Pumps, 2006-2021
- Figure 2-4 | US Foreign Trade in Heat Pumps, 2006-2016
- Imports
- Table | Heat Pump Imports by Source, 2006-2016
- Figure 2-5 | Heat Pump Imports by Source, 2006-2016
- Exports
- Table | Heat Pump Exports by Destination, 2006-2016
- Figure 2-6 | US Heat Pump Exports by Destination, 2006-2016
- Key Findings
- PRODUCTS
- Key Findings
- Figure 3-1 | Key Trends in Heat Pump Products
- Heat Pump Historical Trends
- Heat Pump Forecasts
- Table | Heat Pump Supply & Demand, 2006-2021
- Figure 3-2 | Heat Pump Demand, 2006-2016
- Demand by Product
- Table | Heat Pump Demand by Product, 2006-2021
- Figure 3-3 | Heat Pump Demand by Value & Volume, 2016
- Air Source
- Table | Air Source Heat Pump Demand, 2006-2021
- Table | Air Source Heat Pump Demand by Energy Source, 2006-2021
- Figure 3-4 | Air Source Heat Pump Demand in Value Terms by Energy Source, 2006-2021
- Table | Air-to-Air Heat Pump Demand, 2006-2021
- Figure 3-5 | Air-to-Air Heat Pump Demand by Type, 2016
- Table | Air-to-Water Heat Pump Demand, 2006-2021
- Geothermal
- Table | Geothermal Heat Pump Demand, 2006-2021
- Key Findings
- MARKETS
- Key Findings
- Figure 4-1 | Key Trends in Heat Pump Markets
- Heat Pump Demand by Market
- Table | Heat Pump Demand by Market, 2006-2021
- Figure 4-2 | Heat Pump Demand by Market, 2006-2021
- Commercial
- Table | Commercial Heat Pump Demand, 2006-2021
- Figure 4-3 | Commercial Heat Pump Demand, 2006-2016
- Demand by Building Type
- Table | Commercial Heat Pump Demand by Building Type, 2006-2021
- Figure 4-4 | Commercial Heat Pump Demand by Building Type, 2016
- Residential
- Table | Residential Heat Pump Demand, 2006-2021
- New Buildings
- Figure 4-5 | New Residential Building Heat Pump Demand by Value, 2006-2016
- Existing Buildings
- Figure 4-6 | Heat Pump Demand in Existing Buildings by Value, 2006-2016
- Demand by Building Type
- Table | Residential Heat Pump Demand by Building Type, 2006-2021
- Figure 4-7 | Residential Heat Pump Demand by Building Type, 2016
- Key Findings
- REGIONS
- Key Findings
- Figure 5-1 | Key Trends in Heat Pump Regions
- Climatic Factors Influencing Heat Pump Installation
- Figure 5-2 | Percent of New Single & Multifamily Residential Buildings with Heat Pumps Installed by
- Heat Pump Demand by Region
- Table | Heat Pump Demand by Region, 2006-2021
- Figure 5-3 | Heat Pump Demand by Region, 2016
- South
- Table | South Heat Pump Demand, 2006-2021
- West
- Table | West Heat Pump Demand, 2006-2021
- Midwest
- Table | Midwest Heat Pump Demand, 2006-2021
- Northeast
- Table | Northeast Heat Pump Demand, 2006-2021
- Key Findings
- INDUSTRY STRUCTURE
- Key Findings
- Industry Composition
- Table | Heat Pump Sales by Company, 2016
- Market Share
- Figure 6-1 | US Heat Pump Market Share, 2016
- Daikin
- Figure 6-2 | Heat Pumps: Overall Leading Supplier
- United Technologies
- Figure 6-3 | Heat Pumps: Second Leading Supplier
- Lennox
- Figure 6-4 | Heat Pumps: Third Leading Supplier
- Ingersoll-Rand
- Figure 6-5 | Heat Pumps: Fourth Leading Supplier
- Other Heat Pump Suppliers
- Table | Other Heat Pump Suppliers by Product Type
- Competitive Strategies
- Product Development & Manufacturing
- Table | R&D Spending for Selected Heat Pump Companies, 2016
- Marketing
- Distribution
- Cooperative Agreements
- Table | Selected Cooperative Agreements
- Mergers, Acquisitions, &Industry Restructuring
- Table | Selected Acquisitions & Divestitures
- List of Industry Participants
- APPENDIX
- Scope
- Table | Study Scope: US Regions
- Table | Relevant NAICS Codes
- Methodology
- Sources
- Associations & Agencies
- Related Freedonia Group Studies
- US Studies
- Global Studies
- Upcoming Studies
- Definitions
- General
- Markets
- Heat Pumps
- Abbreviations
- Table | Abbreviations & Acronyms Used in Study
- Climate Zones
- Figure 7-1 | Continental US Climate Zones*
- Macroeconomic Assumptions
- Table | Macroeconomic Indicators, 2006-2021
- Figure 7-2 | Annual Growth in Real GDP, 2000-2016, compared to 1980-2005 average
- Demographic Trends
- Figure 7-3 | Annual Population Growth, 2001-2016
- Table | Population & Households, 2006-2021
- Consumer Spending
- Table | Personal Consumption Expenditures, 2006-2021
- Building Construction
- Table | Building Construction Expenditures, 2006-2021
- Residential
- Table | Residential Building Construction, 2006-2021
- Table | New Housing Indicators, 2006-2021
- Table | Housing Stock by Type, 2006-2021
- Figure 7-4 | Housing Stock by Year of Construction, 2016
- Table | Residential Improvement & Repair Expenditures, 2006-2021
- Nonresidential
- Table | Nonresidential Building Construction Expenditures, 2006-2021
- Scope