US HVAC Equipment
The $20.7 billion US HVAC equipment industry differs between regions due to variances in climate, heating and cooling requirements, and type of buildings constructed.

Free Sample Report
Request a free sample of this report and our team will email it to you.
Report Overview
7th Edition
The $20.7 billion US HVAC equipment industry differs between regions due to variances in climate, heating and cooling requirements, and type of buildings constructed. Competition from imported products has grown considerably as suppliers have relocated production to Mexico. Average HVAC equipment prices rose between 2.0% and 3.0% per year between 2008 and 2018. Price increases in 2018 were partly the result of import tariffs on steel and aluminum imposed by the Trump administration.
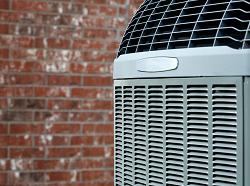
This study analyzes the United States market for heating, ventilation, and air conditioning (HVAC) equipment
Featuring 91 tables and 89 figures – now available in Excel and Powerpoint! Learn More
Scope and Summary
Products covered include:
- air conditioning equipment, including unitary air conditioners, room air conditioners, packaged terminal air conditioners, chillers, and absorption chillers
- heating equipment, including warm air furnaces, boilers, and room and zone heating equipment
- heat pumps
- whole building dehumidifiers and humidifiers
Products excluded from the scope of this report include:
- portable HVAC equipment, including air conditioners, heaters, dehumidifiers, and humidifiers
- ventilation equipment, including ductwork, radiators, and distribution pipes
- parts and attachments
Demand for HVAC equipment is examined by product type, energy source, market, and region in US dollars at the manufacturers’ level. Unit demand estimates are also provided by product and market. Shipments are provided by product type in US dollars. Historical data for 2008, 2013, and 2018 and forecasts to 2023 are presented in current dollars (which are not adjusted to account for inflation).
Product Definitions:
Air Source Heat Pump
Function by transferring heat from one location to another. To warm the air in a buildings, the heat pumps pull heat from the outside air and transfer it into the home ductwork or individual air handlers. To cool the home, the process is reversed; the heat pump pulls heat from inside the structure and transfers it out of the home.
Boiler
Either generate hot water to provide space heating or are used as a piece of industrial process equipment. However, some models provide both space heating and hot water generation. District heating boilers, including large-scale boilers and series of large-scale central boilers that generate hot water to provide heat for an industrial complex or a densely populated urban area, are included in this study. However, products associated with combined heat and power generation systems are not covered in this study, even though they are also radiant heat systems.
Central Air Conditioning
Air conditioning system that provides comfort cooling to an entire structure. Unitary air conditioners can also be described as central air conditioners.
Condensing Boiler
Boilers that have the ability to condense water vapor in the exhaust gas to recover additional heat that improves the efficiency of the unit compared to non-condensing boilers.
Heat Pump
As a type of heat transfer equipment, heat pumps function similarly to air conditioners but can also provide heat. They are also referred to as “reverse cycle heating”, “reverse cycle air conditioning”, “inverted air conditioners”, or “dual capacity air conditioners”. Heat pumps consist of the following major components: a compressor, a fan, condensing coils, evaporator coils, a metering valve, and a reversing valve. The system operates by using a compressor to pump the refrigerant to the coils..
Mini-Split Room Air Conditioner
Room air conditioners that have the condenser and compressor separate from the air handling components. Sometimes referred to as ductless mini-splits.
Packaged Unitary Air Conditioners
Consist of a central air conditioner that combines both condenser and air handling capabilities into a single unit.
Room Air Conditioner
Room air conditioners function similarly to unitary air conditioners and the cooling cycle of heat pumps, but they are designed to operate on a smaller scale. The condenser, compressor, and air handling components in a room air conditioner are located in the same cabinet, which is typically mounted in a window but can be installed in an opening in the wall. Portable units that operate as a free-standing unit with a duct that expels warm air through an exhaust vent in the wall, fireplace, window, or other venting location are also available.
Split Unitary Air Conditioners
The compressor and condenser are installed outside of the building, and an air handling unit is installed inside the building. Split systems are widely used in residential applications. Multi-split systems incorporate one central unit outside and a series of air handling units in several areas of a building. Multi-split systems are increasingly common in newer urban construction throughout the world.
Unitary Air Conditioner
Unitary is a term used to refer to the fact that all the components needed to cool, dehumidify, and move the air are included in one or more factory-made assemblies. These systems provide central cooling for an entire building. Although many of these systems incorporate a heating component within the same assembly, they differ from heat pumps in that the system does not reverse direction.
Warm Air Furnace
Warm air furnaces heat buildings by drawing air from rooms through ductwork and a filter into the furnace, where the air is heated using natural gas, electricity, or heating oil. The warm air then moves back into the rooms through the ductwork. Older warm air furnaces are known as gravity furnaces because the air is delivered by natural convection movement as warm air rises and cold air falls, but the majority of newer versions are known as forced air furnaces because the air is returned using a fan.
US demand for heating, ventilation, and air conditioning (HVAC) equipment is forecast to reach $25.1 billion in 2023 on increases of 3.9% per year, a deceleration from the rate of the 2013-2018 period due to two main factors:
- moderating replacement sales, as pent-up demand following the Great Recession has been alleviated
- slowing building construction, which will reduce the number of HVAC systems installed in new buildings
The majority of expected demand increases will continue to stem from the replacement of existing equipment that has reached the end of its operational lifespan with better performing, and typically higher value, equipment.
Key Findings in the HVAC Equipment Study:
Sales of Heat Pumps Tied To Availability of Tax Credits
Heat pump sales have surged since 2013 due to their greater energy efficiency, growing consumer awareness, their ability to control the temperature by room, and the existence of federal tax credits. However, the Residential Energy Efficiency Tax Credit expired at the end of 2017, dampening sales in the short term. The credit was reinstated for geothermal heat pumps in 2018, which will boost sales until its expiration in 2021, after which there is expected to be a drop in geothermal heat pump sales.
The South Will Remain the Largest Regional Market with Best Opportunities
The South accounts for the largest share of US HVAC equipment demand in any given year and had 45% of US sales in 2018. The South has the largest building stock of any region and a warm climate, resulting in the widespread use of nearly all types of HVAC equipment – particularly air conditioning equipment and heat pumps – resulting in a substantial replacement market. Through 2023, the South is forecast to see the fastest sales growth and will account for 47% of all gains due to its large, growing population and building stock.
Lack of Refrigerant Regulations Creating Uncertainty for Industry Participants
Manufacturers of air conditioning equipment and heat pumps are continuing to develop new refrigerants that meet or exceed enforced guidelines for environmental impact. However, the US – which withdrew from the Paris Agreement in 2017 and has not yet ratified the Kigali Amendment – is lagging many other developed nations in the introduction of equipment that utilizes alternative refrigerants. This has prompted certain states in the US – namely California, Maryland, and New York – to propose or enact state regulations concerning refrigerant use.
Such activity at the state level makes it difficult for industry participants to efficiently meet customers’ needs. As a result, many participants are lobbying for a national regulation, as well as the adoption of requirements from the Paris Agreement and Kigali Amendment to stay ahead of a potential change in regulations in the US. If adopted, these regulations will boost the average value of HVAC equipment across the country.
Study Coverage
This Freedonia industry study analyzes the $20.7 billion US HVAC equipment market. It presents historical demand data (2008, 2013, and 2018) and forecasts for 2023 by product (air conditioning equipment, heating equipment, heat pumps, dehumidifiers & humidifiers), market (commercial buildings, residential buildings), and US region (Northeast, Midwest, South, West). The study also evaluates company market and analyzes industry competitors including Daikin Industries, Ingersoll-Rand, Johnson Controls, Lennox, LG Electronics, Nortek, Rheem, SPX, and United Technologies.
- EXECUTIVE SUMMARY
- Figure 1-1 | US HVAC Equipment Demand
- OVERVIEW
- Key Findings
- Figure 2-1 | Key Trends in the US HVAC Equipment Market
- Factors Influencing HVAC Equipment Demand
- Considerations Influencing HVAC Equipment Purchases
- Energy Costs
- Table | Average Retail Energy Costs in the US by Type, 2008 – 2023
- Figure 2-2 | Average Retail Energy Costs in the US, 2003 – 2018
- Energy Efficiency
- Tax Credits
- Refrigerant Regulations
- Pricing Trends
- Table | HVAC Equipment Pricing Trends, 2008 – 2023
- Figure 2-3 | HVAC Equipment Pricing Trends, 2008 – 2023
- Historical Demand Trends
- Figure 2-4 | HVAC Equipment Demand, 2005 – 2018
- HVAC Equipment Supply & Demand
- Demand by Product Type
- Table | HVAC Equipment Demand by Product Type, 2008 – 2023
- Figure 2-5 | HVAC Equipment Value Demand, 2006 – 2023
- Shipments by Product Type
- Table | HVAC Equipment Shipments by Product Type, 2008 – 2023
- Figure 2-6 | HVAC Equipment Shipments Share by Product Type, 2018
- Trade
- Table | Foreign Trade in HVAC Equipment, 2008 – 2023
- Figure 2-7 | US Foreign Trade in HVAC Equipment, 2005 – 2018
- Imports by Source
- Table | HVAC Equipment Imports by Source, 2008 – 2018
- Figure 2-8 | HVAC Equipment Imports by Source, 2008 – 2018
- Exports by Destination
- Table | HVAC Equipment Exports by Destination, 2008 – 2018
- Figure 2-9 | HVAC Equipment Exports by Destination, 2008 – 2018
- Demand by Product Type
- Demand by Market
- Table | HVAC Equipment Demand by Market, 2008 – 2023
- Demand by Region
- Table | HVAC Equipment Demand by Region, 2008 – 2023
- Figure 2-10 | US States by Regions & Subregions
- Key Findings
- AIR CONDITIONING EQUIPMENT
- Key Findings
- Figure 3-1 | US Air Conditioning Equipment Trends
- Air Conditioning Equipment: Historical Trends
- Figure 3-2 | Air Conditioning Equipment Demand, 2005 – 2018
- Air Conditioning Equipment: Supply & Demand
- Table | Air Conditioning Equipment Supply & Demand, 2008 – 2023
- Figure 3-3 | US Foreign Trade in Air Conditioning Equipment, 2005 – 2018
- Air Conditioning Equipment: Products
- Demand by Product
- Table | Air Conditioning Equipment Demand by Product, 2008 – 2023
- Figure 3-4 | Air Conditioning Equipment Demand Share by Product, 2018
- Unitary Air Conditioners
- Table | Unitary Air Conditioner Supply & Demand, 2008 – 2023
- Figure 3-5 | Unitary Air Conditioner Value Demand, 2006 – 2018
- Table | Unitary Air Conditioner Demand by Type, 2008 – 2023
- Figure 3-6 | Unitary Air Conditioner Value Demand Share by Type, 2008 – 2023
- Room Air Conditioners
- Table | Room Air Conditioner Supply & Demand, 2008 – 2023
- Figure 3-7 | Room Air Conditioner Share of Air Conditioning Equipment Demand, 2018
- Packaged Terminal Air Conditioners
- Table | Packaged Terminal Air Conditioner Supply & Demand, 2008 – 2023
- Figure 3-8 | Packaged Terminal Air Conditioner Value Demand, 2006 – 2018
- Chillers
- Table | Chiller Supply & Demand, 2008 – 2023
- Figure 3-9 | Chiller Value Demand, 2006 – 2018
- Absorption Chillers
- Table | Absorption Chiller Supply & Demand, 2008 – 2023
- Figure 3-10 | Absorption Chiller Value Demand, 2006 – 2018
- Demand by Product
- Air Conditioning Equipment: Markets
- Air Conditioning Equipment: Demand by Market & Segment
- Table | Air Conditioning Equipment Demand by Market & Segment, 2008 – 2023
- Figure 3-11 | Air Conditioning Equipment Demand Value Share by Market, 2008 – 2023
- Air Conditioning Equipment Markets: Commercial Buildings
- Table | Commercial Air Conditioning Equipment Demand by Product, 2008 – 2023
- Figure 3-12 | Commercial Air Conditioning Equipment Demand Share by Product, 2018
- Table | Commercial Air Conditioning Equipment Demand by Segment, 2008 – 2023
- Figure 3-13 | Commercial Air Conditioning Equipment Demand, 2005 – 2018
- Table | Commercial Air Conditioning Equipment Demand by Building Type, 2008 – 2023
- Figure 3-14 | Commercial Air Conditioning Equipment Demand Share by Building Type, 2018
- Air Conditioning Equipment Markets: Residential Buildings
- Table | Residential Air Conditioning Equipment Demand by Product, 2008 – 2023
- Figure 3-15 | Residential Air Conditioning Equipment Demand Share by Product, 2018
- Table | Residential Air Conditioning Equipment Demand by Segment, 2008 – 2023
- Figure 3-16 | Air Conditioning Equipment Demand in Existing Residential Buildings, 2005 – 2018
- Figure 3-17 | Air Conditioning Equipment Demand in New Residential Buildings, 2005 – 2018
- Table | Residential Air Conditioning Equipment Demand by Building Type, 2008 – 2023
- Figure 3-18 | Residential Air Conditioning Equipment Value Demand Share by Building Type, 2008 – 202
- Air Conditioning Equipment: Demand by Market & Segment
- Air Conditioning Equipment: Regions
- Air Conditioning Equipment: Demand by Region
- Table | Air Conditioning Equipment Demand by Region, 2008 – 2023
- Figure 3-19 | Air Conditioning Equipment Value Demand Share by Region, 2008 – 2023
- Air Conditioning Equipment Regional Demand: Northeast
- Table | Northeast: Air Conditioning Equipment Demand by Product & Market, 2008 – 2023
- Figure 3-20 | Northeast: Air Conditioning Equipment Demand Share by Product, 2018
- Air Conditioning Equipment Regional Demand: Midwest
- Table | Midwest: Air Conditioning Equipment Demand by Product & Market, 2008 – 2023
- Figure 3-21 | Midwest: Air Conditioning Equipment Demand Share by Product, 2018
- Air Conditioning Equipment Regional Demand: South
- Table | South: Air Conditioning Equipment Demand by Product & Market, 2008 – 2023
- Figure 3-22 | South: Air Conditioning Equipment Demand Share by Product, 2018
- Air Conditioning Equipment Regional Demand: West
- Table | West: Air Conditioning Equipment Demand by Product & Market, 2008 – 2023
- Figure 3-23 | West: Air Conditioning Equipment Demand Share by Product, 2018
- Air Conditioning Equipment: Demand by Region
- Air Conditioning Equipment: Market Share
- Figure 3-24 | Air Conditioning Equipment: Market Share by Company, 2018
- Key Findings
- HEATING EQUIPMENT
- Key Findings
- Figure 4-1 | US Heating Equipment Trends
- Heating Equipment: Historical Trends
- Figure 4-2 | Heating Equipment Demand by Product, 2005 – 2018
- Heating Equipment: Supply & Demand
- Table | Heating Equipment Supply & Demand, 2008 – 2023
- Figure 4-3 | US Foreign Trade in Heating Equipment, 2005 – 2018
- Heating Equipment: Demand by Energy Source
- Table | Heating Equipment Demand by Energy Source, 2008 – 2023
- Figure 4-4 | Heating Equipment Demand Share by Energy Source, 2018
- Heating Equipment: Products
- Heating Equipment: Demand by Product
- Table | Heating Equipment Demand by Product, 2008 – 2023
- Figure 4-5 | Heating Equipment Demand Share by Product, 2018
- Warm Air Furnaces
- Table | Warm Air Furnace Supply & Demand, 2008 – 2023
- Figure 4-6 | Warm Air Furnace Value Demand, 2006 – 2018
- Table | Warm Air Furnace Demand by Energy Source, 2008 – 2023
- Figure 4-7 | Warm Air Furnace Demand Share by Energy Source, 2018
- Boilers
- Table | Boiler Supply & Demand, 2008 – 2023
- Figure 4-8 | Boiler Value Demand, 2006 – 2018
- Table | Boiler Demand by Type & Energy Source, 2008 – 2023
- Figure 4-9 | Boiler Value Demand Share by Type, 2008 – 2023
- Room & Zone Heating Equipment
- Table | Room & Zone Heating Equipment Supply & Demand, 2008 – 2023
- Table | Room & Zone Heating Equipment Demand by Energy Source, 2008 – 2023
- Table | Selected Commercial & Residential Building Applications for Room & Zone Heating Equipment
- Heating Equipment: Demand by Product
- Heating Equipment: Markets
- Heating Equipment: Demand by Market & Segment
- Table | Heating Equipment Demand by Market & Segment, 2008 – 2023
- Figure 4-11 | Heating Equipment Value Demand Share by Market, 2008 – 2023
- Heating Equipment Markets: Commercial Buildings
- Table | Commercial Heating Equipment Demand by Product, 2008 – 2023
- Figure 4-12 | Commercial Heating Equipment Demand Share by Product, 2018
- Table | Commercial Heating Equipment Demand by Segment, 2008 – 2023
- Figure 4-13 | Heating Equipment Demand in Commercial Buildings, 2005 – 2018
- Table | Commercial Heating Equipment Demand by Building Type, 2008 – 2023
- Figure 4-14 | Commercial Heating Equipment Demand Share by Building Type, 2018
- Heating Equipment Markets: Residential Buildings
- Table | Residential Heating Equipment Demand by Product, 2008 – 2023
- Figure 4-15 | Residential Heating Equipment Demand Share by Product, 2018
- Table | Residential Heating Equipment Demand by Segment, 2008 – 2023
- Figure 4-16 | Heating Equipment Demand in Existing Residential Buildings, 2005 – 2018
- Figure 4-17 | Heating Equipment Demand in New Residential Buildings, 2005 – 2018
- Table | Residential Heating Equipment Demand by Building Type, 2008 – 2023
- Figure 4-18 | Residential Heating Equipment Demand Share by Building Type, 2018
- Heating Equipment: Demand by Market & Segment
- Heating Equipment: Regions
- Heating Equipment: Demand by Region
- Table | Heating Equipment Demand by Region, 2008 – 2023
- Figure 4-19 | Heating Equipment Demand Share by Region, 2018
- Heating Equipment Regional Demand: Northeast
- Table | Northeast: Heating Equipment Demand by Product & Market, 2008 – 2023
- Figure 4-20 | Northeast: Heating Equipment Demand Share by Product, 2018
- Heating Equipment Regional Demand: Midwest
- Table | Midwest: Heating Equipment Demand by Product & Market, 2008 – 2023
- Figure 4-21 | Midwest: Heating Equipment Demand Share by Product, 2018
- Heating Equipment Regional Demand: South
- Table | South: Heating Equipment Demand by Product & Market, 2008 – 2023
- Figure 4-22 | South: Heating Equipment Demand Share by Product, 2018
- Heating Equipment Regional Demand: West
- Table | West: Heating Equipment Demand by Product & Market, 2008 – 2023
- Figure 4-23 | West: Heating Equipment Demand Share by Product, 2018
- Heating Equipment: Demand by Region
- Heating Equipment: Market Share
- Figure 4-24 | Heating Equipment: Market Share by Company, 2018
- Key Findings
- HEAT PUMPS
- Key Findings
- Figure 5-1 | US Heat Pump Trends
- Heat Pumps: Historical Trends
- Figure 5-2 | Heat Pump Demand by Product, 2005 – 2018
- Heat Pumps: Supply & Demand
- Table | Heat Pump Supply & Demand, 2008 – 2023
- Figure 5-3 | US Foreign Trade in Heat Pumps, 2005 – 2018
- Heat Pumps: Products
- Heat Pumps: Demand by Product
- Table | Heat Pump Demand by Product, 2008 – 2023
- Figure 5-4 | Heat Pump Demand Share by Product, 2018
- Air Source Heat Pumps
- Table | Air Source Heat Pump Demand by Type, 2008 – 2023
- Table | Air Source Heat Pump Demand by Energy Source, 2008 – 2023
- Figure 5-5 | Air Source Heat Pump Value Demand Share by Energy Source, 2008 – 2023
- Geothermal Heat Pumps
- Table | Geothermal Heat Pump Demand by Type, 2008 – 2023
- Heat Pumps: Demand by Product
- Heat Pumps: Markets
- Heat Pumps: Demand by Market
- Table | Heat Pump Demand by Market & Segment, 2008 – 2023
- Figure 5-6 | Heat Pump Value Demand Share by Market, 2008 – 2023
- Heat Pump Markets: Commercial Buildings
- Table | Commercial Heat Pump Demand by Segment, 2008 – 2023
- Figure 5-7 | Heat Pump Demand in Commercial Buildings, 2005 – 2018
- Table | Commercial Heat Pump Demand by Building Type, 2008 – 2023
- Figure 5-8 | Commercial Heat Pump Demand Share by Building Type, 2018
- Heat Pump Markets: Residential Buildings
- Table | Residential Heat Pump Demand by Segment, 2008 – 2023
- Figure 5-9 | Heat Pump Demand in Existing Residential Buildings, 2005 – 2018
- Figure 5-10 | Heat Pump Demand in New Residential Buildings, 2005 – 2018
- Table | Residential Heat Pump Demand by Building Type, 2008 – 2023
- Figure 5-11 | Residential Heat Pump Demand Share by Building Type, 2018
- Heat Pumps: Demand by Market
- Heat Pumps: Regions
- Heat Pumps: Demand by Region
- Table | Heat Pump Demand by Region, 2008 – 2023
- Figure 5-12 | Heat Pump Demand Share by Region, 2018
- Figure 5-13 | Share of New Single & Multifamily Building Units with Heat Pumps Installed by Region,
- Heat Pump Regional Demand: Northeast
- Table | Northeast: Heat Pump Demand, 2008 – 2023
- Heat Pump Regional Demand: Midwest
- Table | Midwest: Heat Pump Demand, 2008 – 2023
- Heat Pump Regional Demand: South
- Table | South: Heat Pump Demand, 2008 – 2023
- Heat Pump Regional Demand: West
- Table | West: Heat Pump Demand, 2008 – 2023
- Heat Pumps: Demand by Region
- Heat Pumps: Market Share
- Figure 5-14 | Heat Pumps: Market Share by Company, 2018
- Key Findings
- DEHUMIDIFIERS & HUMIDIFIERS
- Key Findings
- Figure 6-1 | US Dehumidifier & Humidifier Trends
- Dehumidifiers & Humidifiers: Historical Trends
- Figure 6-2 | Dehumidifier & Humidifier Demand, 2005 – 2018
- Dehumidifiers & Humidifiers: Supply & Demand
- Table | Dehumidifier & Humidifier Supply & Demand, 2008 – 2023
- Figure 6-3 | US Foreign Trade in Dehumidifiers & Humidifiers, 2005 – 2018
- Dehumidifiers & Humidifiers: Demand by Product
- Table | Dehumidifier & Humidifier Demand, 2008 – 2023
- Figure 6-4 | Dehumidifier & Humidifier Demand Share, 2018
- Dehumidifiers & Humidifiers: Markets
- Dehumidifiers & Humidifiers: Demand by Market
- Table | Dehumidifier & Humidifier Demand by Market, 2008 – 2023
- Dehumidifiers & Humidifiers: Commercial Buildings
- Table | Commercial Dehumidifier & Humidifier Demand by Segment & Building Type, 2008 – 2023
- Figure 6-5 | Dehumidifier & Humidifier Demand in Existing Commercial Buildings, 2005 – 2018
- Dehumidifiers & Humidifiers: Residential Buildings
- Table | Residential Dehumidifier & Humidifier Demand by Segment & Building Type, 2008 – 2023
- Figure 6-6 | Dehumidifier & Humidifier Demand in Existing Residential Buildings, 2005 – 2018
- Figure 6-7 | Dehumidifier & Humidifier Demand in New Residential Buildings, 2005 – 2018
- Dehumidifiers & Humidifiers: Demand by Market
- Dehumidifiers & Humidifiers: Demand by Region
- Table | Dehumidifier & Humidifier Demand by Region, 2008 – 2023
- Figure 6-8 | Dehumidifier & Humidifier Demand Share by Region, 2018
- Dehumidifiers & Humidifiers: Leading Suppliers
- Key Findings
- INDUSTRY STRUCTURE
- Key Findings & Industry Composition
- Table | HVAC Equipment Sales by Company, 2018
- Market Share
- Figure 7-1 | US HVAC Equipment Market Share by Company, 2018
- Figure 7-2 | HVAC Equipment: Leading Supplier
- Figure 7-3 | HVAC Equipment: Second Leading Supplier
- Figure 7-4 | HVAC Equipment: Third Leading Supplier
- Figure 7-5 | HVAC Equipment: Fourth Leading Supplier
- Competitive Strategies
- Research & Development
- Table | Research & Development Spending for Selected HVAC Equipment Companies, 2018
- Marketing
- Distribution
- Cooperative Agreements
- Table | Selected Cooperative Agreements
- Mergers & Acquisitions
- Table | Selected Mergers & Acquisitions
- List of Industry Participants
- Key Findings & Industry Composition
- APPENDIX
- Scope
- Table | Study Scope: HVAC Equipment Markets
- Table | Study Scope: US Regions
- Table | Relevant Industry Codes
- Table | Relevant HS Codes
- Definitions
- Abbreviations
- Table | Acronyms Used in Study
- Freedonia Methodology
- Study-Specific Methodology
- Sources
- Associations & Agencies
- Related Studies & Reports
- Climate Zones
- Figure 8-1 | Continental US Climate Zones
- Macroeconomic Assumptions
- Economic Environment
- Table | US Macroeconomic Indicators, 2008 – 2023
- Figure 8-2 | Annual Growth in Real GDP, 2000 – 2018, Compared to 1980 – 2005 Average
- Demographic Trends
- Table | US Population & Households, 2008 – 2023
- Figure 8-3 | Annual Population Growth, 2003 – 2018
- Consumer Spending
- Table | US Personal Consumption Expenditures, 2008 – 2023
- Building Construction
- Table | Building Construction Expenditures, 2008 – 2023
- Residential Building Construction
- Table | Residential Building Construction Expenditures, 2008 – 2023
- Housing Completions
- Table | New Housing Indicators, 2008 – 2023
- Housing Stock
- Table | Housing Stock by Type, 2008 – 2023
- Figure 8-4 | Housing Stock Share by Decade of Construction, 2018
- Residential Improvements & Repairs
- Table | Residential Improvement & Repair Expenditures, 2008 – 2023
- Commercial Building Construction
- Table | Commercial Building Construction Expenditures, 2008 – 2023
- Commercial Building Improvements & Repairs
- Table | Commercial Building Improvement & Repair Expenditures, 2008 – 2023
- Economic Environment
- Scope