Lawn & Garden Watering Products in the US Report
Discover how changing homeowner behavior and retail dynamics are influencing the US market for hoses, sprinklers, irrigation systems, and related watering products. Learn where the strongest growth opportunities are emerging heading into 2030.
Free Sample Report
Request a free sample of this report and our team will email it to you.
Report Overview
Watering products enter a reset year as smart tech, drought pressures, and post-inflation price shifts reorder the market
After years of pandemic-driven spikes and inflation-driven declines, demand is stabilizing –just as new pressures reshape how homeowners choose hoses, irrigation systems, and accessories. This report breaks down how shifting water regulations, smarter products, and changing consumer priorities are redefining where the real growth will come from through 2030.
Key Themes Covered in this Report:
- Water stress and shifting drought regulations are accelerating adoption of drip systems, tap timers, and other water-efficient products.
- Smart controllers and connected hose-end devices are moving from niche to mainstream, opening an entirely new performance-driven segment.
- High post-pandemic price levels are reshaping the competitive landscape – pushing buyers toward private labels, trade-down options, and selective upgrades.
Featuring 26 Tables & 65 Figures!
- continued consumer preference for lush, green lawns and beautiful gardens
- high participation in outdoor living and expansion of outdoor living spaces
- potential increases in home sales if interest rates decline further and homes become more affordable to buy
Ease-of-Use & Durability Key Consumer Purchase Drivers
Watering products are commodities that consumers generally buy based on functionality and price, with the latter gaining in importance due to consumers’ economic concerns. Two attributes are especially key influencers of consumer purchase:
-
Ease of use has grown in importance reflecting an aging consumer base and general frustration people have with a garden hoses’ weight, handling difficulty, and tendency to kink. Marketers continue to respond with expandable and other lightweight versions. Many consumers also have difficulty using nozzles and manufacturers have been active in incorporating ergonomic features that increase handling comfort.
-
Durability remains a key driver partially from the continued frustration with expandable hoses that have not improved appreciably in quality over the years. This is further reinforced by the increasing importance of hose material to consumers. Many consumers are also frustrated by hose reels that leak, nozzles that break, and other functional breakdowns. Marketers have innovated various ways to improve product durability across product categories.
E-Commerce Growth Far Outpaces Other Channels
E-commerce grew much faster than other channels over the last 10 years and will continue to grow at the fastest rate. The majority of e-commerce sales come from Amazon and retail e-commerce sites, particularly those of Home Depot and Lowe’s. Some watering products, like hose reels, sell particularly well online since their physical size and broad model range prevent many retailers from stocking them in-store. DIY irrigation systems comprising various components and SKUs also are well suited to online sales. One disadvantage of online retailing is the inability to touch products, which is relevant for hoses as consumers like to physically examine hoses to test for quality and durability. For this reason, retailers tend to stock hoses at relatively high levels in-store.
Private Labels Growing in Importance
Private labels, or store brands marketed by retailers, are a somewhat significant and increasing part of the lawn and garden watering products market. Typically less expensive than national brands, they have grown in importance over the last few years due to surging retail prices. Home Depot and Lowe’s have expanded the range of watering products sold under their private labels over the last several years. Under various labels they offer hoses, hose reels, nozzles, sprinklers, and accessories. Regional home improvement chain Menards also has strong brands, as do hardware chains True Value, Ace, and Do it Best. Walmart sells a range of watering products under its private label.
Lawn & Garden Watering Products in the US Report Details
| Current Total Market Size | $1.3 billion |
| Forecast Total Market Growth Rate | 2.6% CAGR from 2025-2030 |
| Historical Period | 2014-2024 |
| Forecast Period | 2024-2034 |
| Units Covered | US dollars and units |
| Countries Individually Covered | US |
| Products | Garden Hoses | DIY Irrigation Systems | Hose Nozzles | Sprinklers | Accessories & Other Watering Products |
| Point Where Data is Measured | Manufacturer’s Level |
| Additional Elements | Market Share in Total | Near-Term Trend Analysis | Retail Channel Analysis, including E-Commerce | Consumer Purchase Drivers (Ease of Use, Durability, Pricing) | Competitive Landscape Overview | Private Label Impact | Product Innovation Trends |
Leading Companies Driving Trends in the Lawn & Garden Watering Products Industry
| Ace Hardware | Lowe’s |
| Do it Best | Menards |
| Dramm | Melnor |
| Flexon Industries | Rain Bird |
| Giraffe Tools | RainPoint |
| Home Depot | Suncast |
| Husqvarna Group | Swan Products |
| K-Rain Manufacturing | Teknor Apex |
| Lawn & Garden LLC | True Value |
| Liberty Garden Products | Walmart |
Product & Consumer Trends Shaping the Market
Consumers increasingly expect watering products that fix long-running frustrations: hoses that kink, nozzles that break, and accessories that wear out quickly. As the market matures, innovation centers on ease of use, durability, and water efficiency, priorities that matter to older homeowners, budget-conscious first-time buyers, and gardeners working within limited outdoor space. Lightweight and hybrid hoses continue to gain traction as users look for products that are easier to maneuver and store. Ergonomic nozzles, improved connectors, and intuitive tap timers further reduce physical strain and offer greater control over watering routines.
Drought awareness also remains a powerful driver even when restrictions ease. Products that help reduce waste – such as soaker hoses, drip components, and programmable timers – consistently outperform lower-value alternatives among homeowners who want more efficient watering methods or need to comply with local conservation expectations.
Weather, Seasonality & the Retail Landscape
The industry is highly exposed to a short seasonal window, with most demand occurring from April through August. A warm, dry spring boosts early purchases, while excessive rainfall or heat suppresses store traffic and delays replacement buying. Because of this volatility, retailers rely heavily on omnichannel strategies to capture demand whenever it appears.
E-commerce continues to expand at the fastest pace in the category. Bulky, high-SKU items – especially hose reels and irrigation components – benefit from online assortments that exceed what stores can stock. At the same time, hoses remain a strong in-store category because many consumers want to physically test flexibility and perceived durability before making a purchase.
Lawn & Garden Watering Products in the US Report Scope
This report presents a detailed analysis of the US consumer market for residential do-it-yourself (DIY) lawn and garden watering products.
This report outlines key issues and trends affecting the overall market and analyzes relevant segments:
- garden hoses, including conventional hoses, soaker hoses, sprinkler hoses, expandable hoses, and other lightweight hoses such as expandable, compact, and coiled hoses as well as those made from materials such as polyurethane, polypropylene, or metal that are promoted as lighter in weight compared to conventional hoses; the value of nozzles sold attached to expandable lightweight hoses is also included here
- DIY irrigation systems, including basic and smart controllers; and underground, aboveground, and drip systems as well as kits that bundle all products necessary to create a system
- hose-end nozzles, including pattern nozzles, pistol nozzles, wands, and other nozzles such as twist and fan nozzles but excluding the value of nozzles sold attached to lightweight expandable hoses
- hose-end sprinklers, including oscillating sprinklers, pulsating/impact sprinklers, stationary/spot sprinklers, and other sprinklers such as rotating/revolving and traveling sprinklers
- hose reels, including stationary, portable, hideaway, and spring-loaded types
- accessories and other products, including tap timers, rain barrels, watering cans, hose menders, and couplers
Sprinklers that are included with irrigation systems are counted as part of DIY irrigation systems, as are individual system components that are sold separately.
The report does not include products/services sold to the following markets:
- agricultural
- commercial
- horticultural
- institutional
- professional
- recreational
All retail channels that sell consumer lawn and garden watering products are covered and considered in arriving at overall market size estimates, market trends, and competitive analysis.
- Executive Summary
- Figure 1-1. Lawn & Garden Watering Products Market Overview
- Short-Term Analysis
- Recent Economic Trends
- Table | Macroeconomic Indicators, 2024 – 2027 (billion 2017 dollars & billion dollars)
- Short-Term Lawn & Garden Industry Trends
- Table | Annual Lawn & Garden Watering Product Demand by Type, 2023 – 2027 (million dollars)
- Figure 2-1. Annual Lawn & Garden Watering Product Demand Growth, 2023 – 2027 (% annual change)
- Recent Economic Trends
- Overview
- Study Scope
- Figure 3-1. Lawn & Garden Watering Product Examples
- Historical Market Size & Growth Drivers
- Table | Lawn & Garden Watering Product Demand, 2015 – 2025 (million dollars & thousand units)
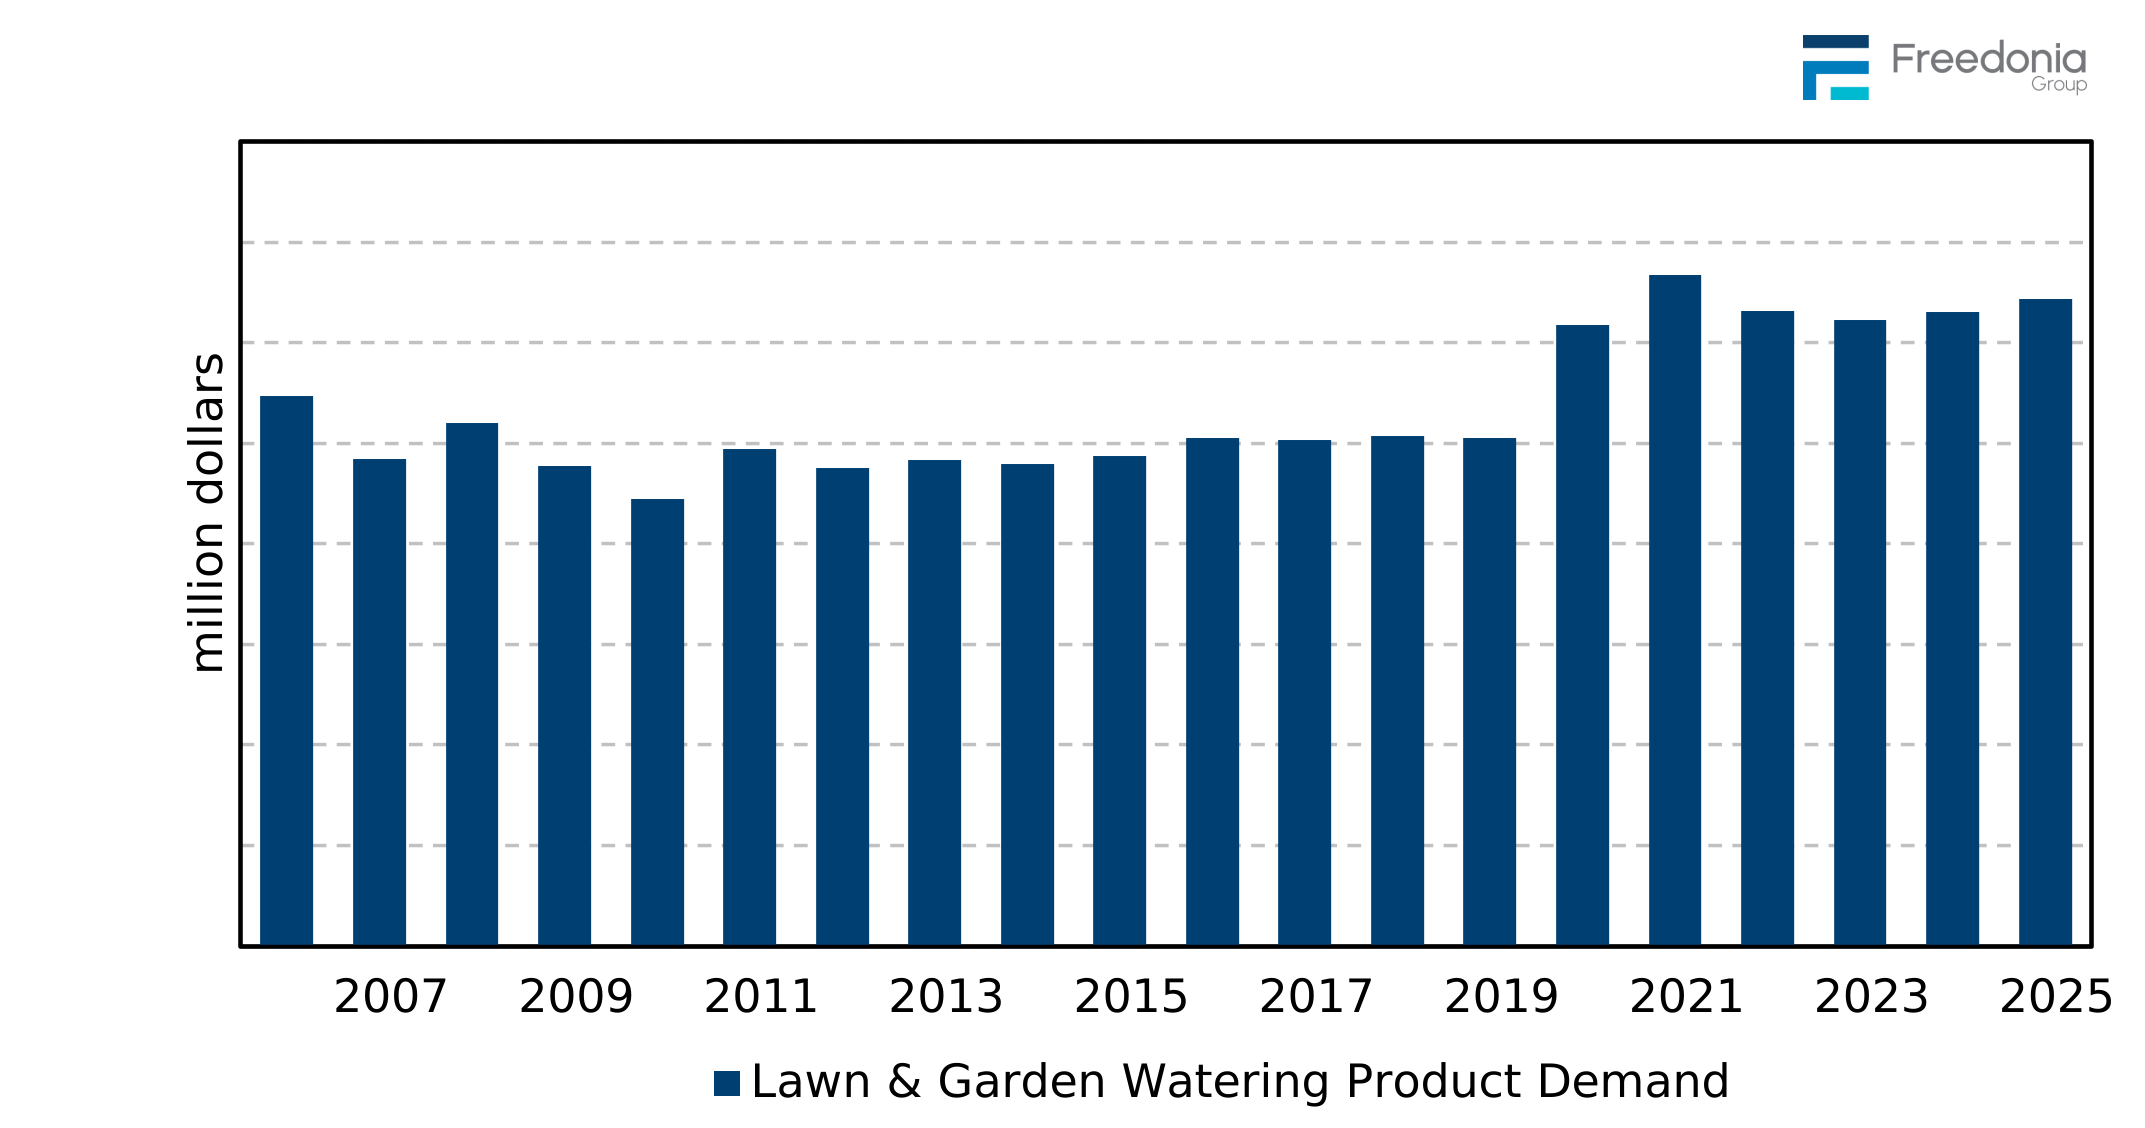
- Figure 3-2. Lawn & Garden Watering Product Demand, 2006 – 2025 (million dollars)
- Pricing & Inflation Impact
- Table | Lawn & Garden Watering Product Average Price for Selected Products, 2015, 2019, 2025, 2030, &2035 (d
- Figure 3-3. Lawn & Garden Watering Product Average Price for Selected Products, 2015 – 2030 (dollars
- Product Trends & Innovations
- Ease of Use
- Figure 3-4. Product Example: Flexi Hose
- Figure 3-5. Product Example: Hybrid Polymer Hoses
- Figure 3-6. Product Example: Swan Products' XFlex Hose
- Figure 3-7. Product Example: Ray Padula's Click-N-Spray 7-Pattern Hose Nozzle
- Figure 3-8. Product Example: Flexon's Guard-N-Grip Hose Connector
- Figure 3-9. Product Example: BLACK+DECKER SnakeWand
- Durability
- Figure 3-10. Product Example: Pocket Hose Copper Head Expandable Hose
- Figure 3-11. Product Example: Emson XHose DAC-5 Expandable Hose
- Figure 3-12. Product Example: zero-G NXT Hose
- Figure 3-13. Product Example: Lightweight Compact Hoses
- Figure 3-14. Product Example: Gilmour's FLEXOGEN Super Duty Hose
- Figure 3-15. Product Example: Metal Hoses
- Figure 3-16. Product Example: ELEY Hose Reel Attributes
- Figure 3-17. Product Example: GORILLA Hose Reel Features
- Water Conservation Features
- Figure 3-18. Product Example: Dramm ColorStorm Standard Soaker Hose
- Smart Products
- Figure 3-19. Product Example: OtO Smart Sprinkler
- Figure 3-20. Example: CalWEP's Direct Distribution Program
- Figure 3-21. Product Example: B-hyve XR Smart Sprinkler Controller
- Figure 3-22. Product Example: B-hyve XD Smart Tap Timer
- Figure 3-23. Product Example: Melnor's HydroLogic Digital Water Timer
- Ease of Use
- US Supply & Foreign Trade
- Study Scope
- Factors Impacting Watering Product Demand
- Product Replacement Rates
- Seasonality & Weather
- Drought, Water Shortages, &Conservation Regulations
- BPA, Lead, &Phthalate Content
- Products
- Demand by Product
- Table | Lawn & Garden Watering Product Demand by Type, 2015, 2019, 2025, 2030, &2035 (million dollars)
- Figure 5-1. Lawn & Garden Watering Product Demand by Type, 2015, 2019, 2025, 2030, &2035 (million do
- Garden Hoses
- Demand by Type
- Figure 5-2. Garden Hose Product Examples
- Table | Lawn & Garden Hose Demand by Type, 2015, 2019, 2025, 2030, &2035 (million dollars & thousand units)
- Figure 5-3. Lawn & Garden Hose Demand by Type, 2015, 2019, 2025, 2030, &2035 (million dollars)
- Conventional
- Soaker/Sprinkler
- Next Generation Lightweight (Expandable, Compact, Coiled, &Other)
- Key Suppliers
- Demand by Type
- DIY Irrigation Systems
- Demand by Type
- Figure 5-4. DIY Irrigation Systems: Product Examples
- Table | Lawn & Garden DIY Irrigation System Demand by Type, 2015, 2019, 2025, 2030, &2035 (million dollars)
- Figure 5-5. Lawn & Garden DIY Irrigation System Demand by Type, 2015, 2019, 2025, 2030, &2035 (milli
- Controllers (Basic & Smart)
- Other Systems (Underground, Aboveground, &Drip)
- Key Suppliers
- Demand by Type
- Hose Nozzles
- Demand by Type
- Figure 5-6. Hose Nozzles: Product Examples
- Table | Lawn & Garden Hose Nozzle Demand by Type, 2015, 2019, 2025, 2030, &2035 (million dollars & thousand
- Figure 5-7. Lawn & Garden Hose Nozzle Demand by Type, 2015, 2019, 2025, 2030, &2035 (million dollars
- Key Suppliers
- Demand by Type
- Sprinklers
- Demand by Type
- Figure 5-8. Sprinklers: Product Examples
- Table | Lawn & Garden Sprinkler Demand by Type, 2015, 2019, 2025, 2030, &2035 (million dollars & thousand un
- Figure 5-9. Lawn & Garden Sprinkler Demand by Type, 2015, 2019, 2025, 2030, &2035 (million dollars)
- Key Suppliers
- Demand by Type
- Hose Reels
- Demand Outlook
- Figure 5-10. Hose Reels: Product Examples
- Table | Lawn & Garden Hose Reel Demand, 2015, 2019, 2025, 2030, 2035 (million dollars & thousand units)
- Key Suppliers
- Demand Outlook
- Accessories & Other Watering Products
- Demand by Type
- Figure 5-11. Accessories & Other Watering Products: Examples
- Table | Lawn & Garden Accessories & Other Watering Products Demand by Type, 2015, 2019, 2025, 2030, &2035 (m
- Figure 5-12. Lawn & Garden Accessories & Other Watering Product Demand by Type, 2015, 2019, 2025, 20
- Key Suppliers
- Demand by Type
- Demand by Product
- Retail Sales
- Wholesale Distribution
- Retail Sales by Product
- Table | Lawn & Garden Watering Product Retail Sales by Type, 2015, 2019, 2025, 2030, &2035 (million dollars)
- Retail Sales by Channel
- Table | Lawn & Garden Watering Product Retail Sales by Channel, 2015, 2019, 2025, 2030, &2035 (million dolla
- Figure 6-1. Lawn & Garden Watering Product Retail Sales by Channel, 2015, 2019, 2025, 2030, &2035 (m
- Marketing Trends
- Omnichannel "Bricks & Clicks" Retailing Essential
- Multi-Dimensional Approach
- Private Labels
- Consumer Trends
- Homeownership Trends
- Ownership vs. Rental Rate
- Table | Homeownership & Rental of Residences, 2015 – 2025 (% of population)
- Age Brackets
- Figure 7-1. Homeownership & Rental of Residences by Age Group, 2012, 2022, &2025 (% of population)
- Household Income
- Table | Homeownership & Rental of Residences by Annual Household Income Bracket, 2015 – 2025 (% of populatio
- Ownership vs. Rental Rate
- Owned Land & Property Size
- Table | US Homeownership Rates by Property Size, 2015 – 2025 (% of respondents who own a single-family house
- Gardening as a Leisure Pursuit
- Table | Adults Who Gardened in the Last 12 Months by Gender, Age Group, &Ownership of Residence, 2015 – 2025
- Environmental Responsibility
- Table | Consumer Belief in Personal Environmental Responsibility by Gender, Age Group, &Ownership of Residen
- Attitudes about Lawns, Gardens, &Water Conservation
- Figure 7-2. Consumer Attitudes Regarding Lawns & Gardens, 2022 & 2025 (% of respondents)
- Figure 7-3. Consumer Attitudes Regarding Water Conservation, 2019. 2022, &2025 (% of respondents)
- Garden Hoses
- Factors Influencing Garden Hose Purchases
- Figure 7-4. Highest Priority Factors Influencing Garden Hose Purchase, 2019, 2022, &2025 (% of respo
- Main Uses of Garden Hoses
- Figure 7-5. Garden Hose Uses, 2019, 2022, &2025 (% of respondents)
- Garden Hose Ownership: Quantity & Type
- Figure 7-6. Garden Hose Ownership by Gender, Age Group, Urban vs. Rural Setting, &Type of Residence,
- Figure 7-7. Garden Hose Ownership Characteristics, 2019, 2022, &2025 (% of respondents)
- Garden Hose Ownership by Type of Residence
- Figure 7-8. Type of Garden Hose Owned by Type of Residence, 2019, 2022, &2025 (% of respondents)
- Garden Hose Ownership by Age Group
- Figure 7-9. Type of Garden Hose Owned by Age Group, 2022 & 2025 (% of respondents)
- Garden Hose Ownership by Population Density: Urban, Suburban, &Rural
- Figure 7-10. Type of Garden Hose Owned by Urban vs. Rural Setting, 2019, 2022, &2025 (% of responden
- Factors Influencing Garden Hose Purchases
- Irrigation Systems
- Types of Installed Home Irrigation Systems
- Figure 7-11. Home Irrigation System Characteristics, 2019, 2022, &2025 (% of respondents)
- Irrigation System Purchase Motivations
- Figure 7-12. Home Irrigation System Purchase Motivations 2025 (% of respondents)
- Reasons for Not Purchasing Home Irrigation System
- Figure 7-13. Reasons for Not Purchasing Home Irrigation System 2025 (% of respondents)
- Irrigation System Ownership by Type of Residence
- Figure 7-14. Type of Irrigation System Owned by Type of Residence, 2019, 2022, &2025 (% of responden
- Irrigation System Ownership by Age Group
- Figure 7-15. Type of Irrigation System Owned by Age Group, 2022 & 2025 (% of respondents)
- Irrigation System Ownership by Population Density
- Figure 7-16. Type of Irrigation System Owned by Urban vs. Rural Setting, 2019, 2022, &2025 (% of res
- Irrigation System Ownership by Region
- Figure 7-17. Type of Irrigation System Owned by Region, 2019, 2022, &2025 (% of respondents)
- Types of Installed Home Irrigation Systems
- Homeownership Trends
- Industry Structure
- Key Findings & Industry Composition
- Table | US Lawn & Garden Watering Product Sales by Company, 2025 (million dollars)
- Market Share
- Figure 8-1. US Lawn & Garden Watering Product Market Share by Company, 2025 (billion dollars)
- Figure 8-2. US Lawn & Garden Watering Product Market: Leading Supplier, 2025
- Figure 8-3. US Lawn & Garden Watering Product Market: Second Leading Supplier, 2025
- Figure 8-4. US Lawn & Garden Watering Product Market: Third Leading Supplier, 2025
- Figure 8-5. US Lawn & Garden Watering Product Market: Co-Fourth Leading Supplier, 2025
- Figure 8-6. US Lawn & Garden Watering Product Market: Co-Fourth Leading Supplier, 2025
- Figure 8-7. US Lawn & Garden Watering Product Market: Sixth Leading Supplier, 2025
- Figure 8-8. US Lawn & Garden Watering Product Market: Seventh Leading Supplier, 2025
- Competitive Strategies
- Mergers & Acquisitions
- Cooperative Agreements
- Table | Selected Cooperative Agreements
- Figure 8-9.Product Example: Exclusive Brands at Retailers
- Key Findings & Industry Composition
- Appendix
- Report Details
- Table | Relevant Industry Codes
- Definitions
- Abbreviations
- Table | Abbreviations & Acronyms Used in Study
- Freedonia Methodology
- Study-Specific Methodology
- Sources
- Associations & Agencies
- Related Studies & Reports
- Macroeconomic Assumptions
- Economic Environment
- Table | Macroeconomic Indicators, 2015, 2019, 2025, 2030, &2035 (billion 2017 dollars)
- Demographic Trends
- Table | Population & Households, 2015, 2019, 2025, 2030, &2035 (million persons)
- Consumer Spending
- Table | Personal Consumption Expenditures, 2015, 2019, 2025, 2030, &2035 (billion 2017 dollars)
- Housing Stock
- Table | Housing Stock by Type, 2015, 2019, 2025, 2030, &2035 (million units)
- Figure 9-1. Housing Stock: Share by Year of Construction, 2025 (percent)
- Economic Environment
- Report Details
Drought cycles and local water-use restrictions have become some of the most influential forces in this market. When restrictions tighten, consumers shift toward more efficient solutions such as tap timers, drip systems, soaker hoses, and smart controllers. In periods of prolonged or severe drought, some homeowners delay buying or upgrading watering products altogether if outdoor watering is limited or prohibited. As conditions ease, demand rebounds – often with heightened interest in products that help conserve water.
Ease of use and durability dominate purchase decisions. Consumers – especially aging homeowners – are increasingly frustrated by heavy, kink-prone hoses and difficult-to-operate nozzles. This has fueled demand for expandable and lightweight hoses, ergonomic nozzles, and accessories that simplify handling. At the same time, recurring quality issues with some lightweight hoses keep durability top-of-mind, pushing buyers toward products with reinforced materials, improved connectors, or long warranties.
Market leadership is concentrated among a small group of suppliers with strong distribution and broad product portfolios. Key players include Flexon Industries, Husqvarna Group (Orbit Irrigation, Gardena), Lawn & Garden (Gilmour), Melnor, Rain Bird, Swan Products, and Teknor Apex. These firms hold significant positions across hoses, nozzles, sprinklers, reels, and DIY irrigation systems, and together account for the majority of US market sales.