Lumber
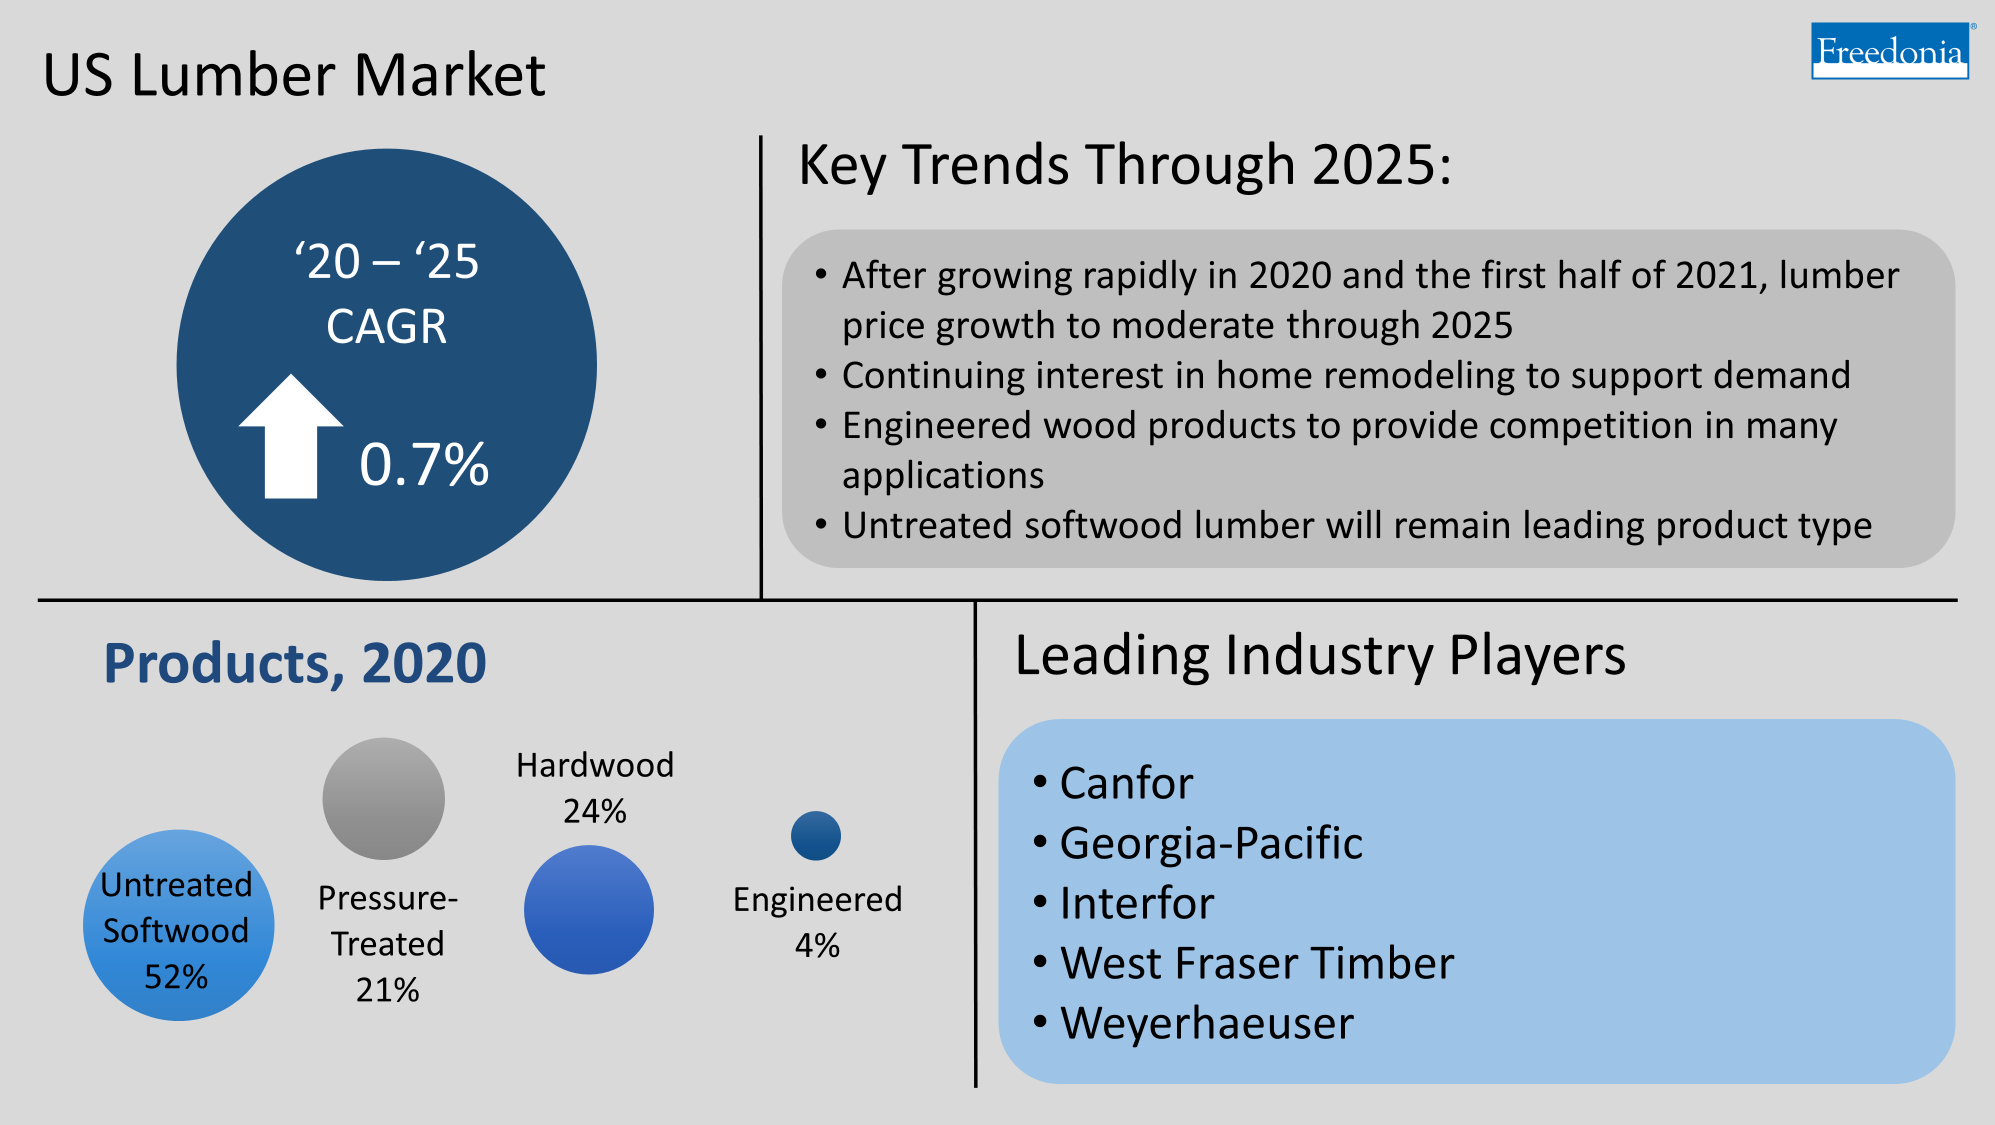
US demand for lumber is projected to advance 0.7% annually to 68.8 billion board feet in 2025.
Free Sample Report
Request a free sample of this report and our team will email it to you.
Report Overview
Featuring 87 tables and 24 figures – now available in Excel and Powerpoint! Learn More
This comprehensive study examines the US lumber industry. Demand is categorized by lumber type for both construction and industrial and commercial markets, with additional analysis by geographic region. The study also examines imports, exports, tariff impact, and industry sustainability. Historical data for 2010, 2015, and 2020 and forecasts to 2025 and 2030 are provided for lumber demand in both volume terms (board feet) and value terms (US dollars).
For the purposes of this study, lumber is defined as wood (taken from harvested trees, or timber) that has been cut and sawn into planks, beams, or boards of a desired size and shape. Lumber comprises both:
- rough cut lumber
- finished lumber
Types of lumber included in the scope of this study are:
- untreated softwood lumber
- pressure-treated softwood lumber
- hardwood lumber
- engineered lumber, such as I-joists, glulam, rim board, cross-laminated timbers (CLTs), structural composite lumber (SCL), laminated veneer lumber (LVL), parallel strand lumber (PSL), laminated strand lumber (LSL) and oriented strand lumber (OSL)
The value of OSB and plywood are included only when they are part of I-joists.
Products excluded from the scope of the study include engineered wood products, such as:
- particleboard
- plywood (except for that used to make I-joists)
- medium-density fiberboard (MDF)
- high-density fiberboard (HDF)
- hardboard
- oriented strand board (OSB), except for that used to make I-joists
These wood products differ from wood lumber in that engineered wood products consist of reformulated wood materials – sawdust, wood shavings, shells, and other materials – where lumber products are only made with solid wood lumber.
Lumber demand is segmented into the following applications:
- structural and framing (e.g., wall framing, roof framing, structural floors and foundations)
- exterior finish, including roofing, siding (or cladding), exterior trim, soffit and fascia, and shutters
- interior finish components (e.g., finish flooring, doors and windows, cabinets, interior moulding and trim, ceilings, countertops, stairs and railings, mantels)
- landscaping and outdoor lumber, such as decking, fencing, porches and patios, outdoor structures (e.g., gazebos, arbors, walls, pergolas), playgrounds, roads and bridges, piers, and boardwalks
Demand is also segmented into two major markets:
- construction, which is further segmented by lumber used in new residential building construction, residential repair and remodeling, nonresidential buildings, and nonbuilding
- industrial and commercial (e.g., pallets and crates, furniture, vehicles, signage, caskets, shelving, blinds, matting for large industrial equipment)
Finally, demand for lumber is broken out for the following US geographic regions and subregions:
- Northeast (Middle Atlantic and New England)
- Midwest (East North Central and West North Central)
- South (South Atlantic, East South Central, and West South Central)
- West (Mountain and Pacific)
Production & Trade
Shipments & Net Exports
Shipments of lumber are expected to rise 0.5% annually to 55.3 billion board feet in 2025. Gains will be supported by:
- continuing growth in domestic demand for lumber, which will encourage US sawmills to expand production capacity at existing facilities and erect new mills to process timber
- the continuance of tariffs levied against lumber imported from Canada that will make US-made lumber more cost competitive with foreign-sourced lumber
Imports
US imports of lumber totaled 15.0 billion board feet in 2020, with softwood lumber accounting for the large majority of US imports. Lumber imports to the US rose steadily between 2010 and 2016, fueled by rising domestic demand for lumber as new housing activity recovered from the collapse seen during the Great Recession. Rising demand for lumber in 2020 boosted Canadian imports as surging prices meant that even with tariffs, Canadian-made softwood lumber was finally less costly than domestically sourced materials.
Through 2025, imports of lumber to the US are forecast to rise at an annual average pace of 1.4% to 16.1 billion board feet. Increasing domestic demand for lumber will support this growth.
Canada was the leading importer of both softwood and hardwood lumber to the US in 2020 and will continue to account for the largest share of US lumber imports going forward.

Exports
US exports of lumber totaled 2.5 billion board feet in 2020, a decrease from 2015. Strong domestic demand for lumber encouraged sawmills to sell their product to local consumers, rather than those located in markets outside the US. Going forward, lumber exports are forecast to advance moderately through 2025 to 2.7 billion board feet.
China is the leading market for US hardwood lumber exports, as these materials can be made into engineered wood products or finished goods, such as furniture and hardwood flooring.
Mexico and Canada were the leading export markets for US softwood lumber in 2020. Mexico has very little timber stock and thus a small lumber industry; US firms are relied upon to supply that country with its lumber needs. Canadian firms often use US-made lumber (such as Southern yellow pine or various hardwoods) in finished goods, such as flooring and cabinetry.
Demand by Type & Market
US demand for lumber is projected to advance 0.7% annually to 68.8 billion board feet in 2025.
Solid wood lumber – which accounted for the large majority of lumber demand in 2020 – will remain the leading material in use going forward, with demand rising at an annual average of 0.7% to 66.2 billion board feet in 2025. Construction professionals will continue to opt for these products because of their low cost and favorable performance properties.
Engineered lumber materials will post more rapid growth than solid lumber, advancing at an average annual pace of 1.6% to 2.5 billion board feet in 2025.
Construction was the leading market for lumber in the US, with 75% of demand in 2020. Lumber sees extensive use in a wide range of construction applications, from structural framing, interior walls, and decks, to such related products as flooring, cabinets, and windows and doors.
Sustainability Issues
Green Building Practices
Green building practices have become increasingly important in recent decades as consumers and builders have become more concerned about the impact that building materials, including lumber, have on the environment. As a result, producers often tout their lumber and other items as green building materials because they can be eligible for tax credits and other benefits through the US Green Building Council’s Leadership in Energy and Environmental Design (LEED) program and/or the National Green Building Standard.
US demand for lumber is forecast to advance modestly through 2025 to 68.8 billion board feet valued at $51.0 billion. Although demand for lumber will remain strong in 2021 – bolstered by a high level of new housing activity and continuing consumer interest in home improvement projects – new housing activity will retreat by 2025, which will restrain gains for lumber. The building of a new single-family home one of the most intensive uses of lumber in the US.
Overall growth in demand for lumber over this time will be supported by:
- continuing interest in home improvement projects, such as kitchen and bathroom renovations and adding home offices and gyms
- the modest recovery in nonresidential construction activity from its pandemic-induced low base
High Demand & Shortage of Supply Drive Booming Softwood Lumber Prices
Untreated softwood lumber prices surged dramatically in 2020 as lumber mills – in expectation that demand would fall amid the pandemic – reduced production, particularly of the softwood lumber most often used in building and construction projects. However, demand for lumber was at an elevated level throughout much of 2020 and into 2021. New housing activity remained strong as people leaving urban cores sought out residences in suburban and exurban areas, while stuck-at-home homeowners took to DIY improvement projects to fill the time or economically complete home repairs. Lumber prices continued to climb into 2021 as demand remained strong and sawmills struggled to meet demand for the material. However, by mid-2021 prices have already begun to drop – from very high levels – as sawmills continue to ramp up production.
Tariffs Will Continue to Have an Impact on US Lumber Market
Tariffs levied against Canadian softwood lumber back in 2017 affected Canadian firms’ profit levels in the US, causing a number of them to stop selling products in the country. This became a significant issue in 2020, as lower lumber supplies caused prices to surge, making it expensive for professionals and consumers to acquire the lumber necessary to complete projects. As many domestic firms have started capacity expansions at mills located in the US to meet surging demand for lumber, they will prefer that these tariffs remain in effect, allowing them to better recoup their investments with less competition from Canadian-sourced lumber.
Interior Finish Applications to Post Strongest Growth Going Forward
Interior finish applications are expected to see the most rapid gains in lumber use. Rising homeowner interest in installing hardwood flooring because of its favorable aesthetic properties will boost demand for hardwood lumber, as will continuing growth in kitchen and bathroom remodeling – hardwood lumber is often used to build the cabinets installed during these renovation projects. Growth prospects for softwood lumber in interior applications will be supported by increasing use of interior moulding among home builders as a way to attract potential buyers by improving the interior appearance of their residences.
- Executive Summary
- Figure 1-1 | US Lumber Market
- COVID-19 Pandemic
- Overview
- Impact on the Economy
- Table | Macroeconomic Indicators, 2019 - 2022
- Impact on the Construction Industry
- Table | Construction Expenditures, 2019 - 2022
- Impact on the Lumber Industry
- Table | Annual Lumber Demand by Product, 2019 - 2021
- Table | Annual Lumber Demand by Market, 2019 - 2021
- Figure 2-1 | Annual Lumber Demand & Pricing, 2015 - 2025
- Overview
- Study Scope
- Historical Trends
- Table | Lumber Demand, 2010 - 2020
- Figure 3-1 | Lumber Demand, 2000 - 2020
- Production & Trade
- Shipments & Net Exports
- Table | Lumber Supply & Demand, 2010 - 2030
- Imports
- Table | Lumber Imports by Country, 2010 - 2020
- Figure 3-2 | Lumber Imports: Leading Sources, 2010 - 2020
- Exports
- Table | Lumber Exports by Country, 2010 - 2020
- Figure 3-3 | Lumber Exports: Leading Destinations, 2010 - 2020
- Impact of Tariffs
- Shipments & Net Exports
- Demand by Type & Market
- Table | Lumber Demand by Type & Market, 2010 - 2030
- Pricing Trends
- Table | Lumber Average Prices by Type, 2010 - 2030
- Figure 3-4 | Lumber Pricing, 2010 - 2025
- Sustainability Issues
- Green Building Practices
- Forest Management
- Recycling & Recycled Content
- Treatment Chemicals
- Construction Market
- Market Scope
- Figure 4-1 | Key Lumber Uses in the Construction Market
- Market Overview
- Demand by Market Sector
- Table | Construction Lumber Demand by Market Sector, 2010 - 2030
- New Residential Buildings
- Table | New Residential Lumber Demand by Application, 2010 - 2030
- Residential Repair & Remodeling
- Table | Residential Repair & Remodeling Lumber Demand by Application, 2010 - 2030
- Nonresidential Buildings
- Table | Nonresidential Lumber Demand by Application, 2010 - 2030
- Nonbuilding
- Table | Nonbuilding Lumber Demand by Application, 2010 - 2030
- Demand by Market Sector
- Products
- Table | Construction Lumber Demand by Product, 2010 - 2030
- Applications
- Table | Construction Lumber Demand by Application, 2010 - 2030
- Regional Trends
- Table | Construction Lumber Demand by Region, 2010 - 2030
- Market Scope
- Industrial & Commercial Markets
- Market Scope
- Figure 5-1 | Key Lumber Uses in Industrial & Commercial Markets
- Products
- Table | Industrial & Commercial Lumber Demand by Product, 2010 - 2030
- Applications
- Demand by Application
- Table | Industrial & Commercial Lumber Demand by Application, 2010 - 2030
- Pallets & Crates (Packaging & Shipping)
- Table | Pallet & Crate Lumber Demand by Product, 2010 - 2030
- Furniture
- Table | Furniture Lumber Demand by Product, 2010 - 2030
- Other Industrial & Commercial (Vehicles, Signage)
- Table | Other Industrial & Commercial Lumber Demand by Product, 2010 - 2030
- Demand by Application
- Regional Trends
- Table | Industrial & Commercial Lumber Demand by Region, 2010 - 2030
- Market Scope
- Solid Wood Lumber
- Scope & Product Description
- Shipments & Foreign Trade
- Table | Solid Wood Lumber Shipments & Foreign Trade, 2010 - 2030
- Types of Solid Wood Lumber
- Demand by Type
- Table | Solid Wood Lumber Demand by Type, 2010 - 2030
- Untreated Softwood Lumber
- Table | Untreated Softwood Lumber Demand by Application, 2010 - 2030
- Pressure-Treated Lumber
- Table | Pressure Treated Lumber Demand by Application, 2010 - 2030
- Hardwood Lumber
- Table | Hardwood Lumber Demand by Application, 2010 - 2030
- Demand by Type
- Markets & Applications
- Table | Solid Wood Lumber Demand by Application & Market, 2010 - 2030
- Market Share & Key Suppliers
- Figure 6-1 | Solid Wood Lumber Market Share by Company, 2020
- Engineered Lumber
- Scope & Product Description
- Shipments & Foreign Trade
- Table | Engineered Lumber Shipments & Foreign Trade, 2010 - 2030
- Demand by Type (I-Joists, Glulam, LVL, & Other)
- Table | Engineered Lumber Demand by Type, 2010 - 2030
- Markets & Applications
- Table | Engineered Lumber Demand by Market & Application, 2010 - 2030
- Key Suppliers
- Structural & Framing Lumber
- Scope
- Figure 8-1 | Key Lumber Uses in the Structural & Framing Lumber Market
- Applications
- Demand by Application
- Table | Structural & Framing Lumber Demand by Application, 2010 - 2030
- Wall Framing
- Table | Wall Framing Lumber Demand by Market & Product, 2010 - 2030
- Roof Framing
- Table | Roof Framing Lumber Demand by Market & Product, 2010 - 2030
- Structural Floors & Foundations
- Table | Structural Floor & Foundation Lumber Demand by Market & Product, 2010 - 2030
- Demand by Application
- Products
- Table | Structural & Framing Lumber Demand by Product, 2010 - 2030
- Regional Trends
- Table | Structural & Framing Lumber Demand by Region, 2010 - 2030
- Competitive Products
- Figure 8-2 |Structural & Framing Lumber vs. Competitive Products: Comparative Growth, 2020 - 2025
- Scope
- Exterior Finish Lumber
- Scope
- Figure 9-1 | Key Lumber Uses in the Exterior Finish Lumber Products Market
- Applications
- Demand by Application
- Table | Exterior Finish Lumber Demand by Application, 2010 - 2030
- Roofing
- Table | Roofing Lumber Demand by Market, 2010 - 2030
- Siding
- Table | Siding Lumber Demand by Market, 2010 - 2030
- Other Exterior Finish (Soffits & Fascia, Shutters, Exterior Trim)
- Table | Other Exterior Finish Lumber Demand by Market, 2010 - 2030
- Demand by Application
- Products
- Figure 9-2 | Exterior Finish Lumber Demand, 2000 - 2025
- Regional Trends
- Table | Exterior Finish Lumber Demand by Region, 2010 - 2030
- Competitive Products
- Figure 9-3 | Exterior Finish Lumber & Competitive Products: Comparative Growth, 2020 - 2025
- Scope
- Interior Finish Lumber
- Scope
- Figure 10-1 | Key Lumber Uses in the Interior Finish Lumber Products Market
- Applications
- Demand by Application
- Table | Interior Finish Lumber Demand by Application, 2010 - 2030
- Finish Flooring
- Table | Flooring Lumber Demand by Market & Product, 2010 - 2030
- Doors & Windows
- Table | Door & Window Lumber Demand by Market & Product, 2010 - 2030
- Cabinets
- Table | Cabinet Lumber Demand by Market & Product, 2010 - 2030
- Interior Moulding & Trim
- Table | Interior Moulding & Trim Lumber Demand by Market and Product, 2010 - 2030
- Other (Ceilings, Countertops, Paneling, Stairs & Railings, Mantels)
- Table | Other Interior Finish Applications Lumber Demand by Market & Product, 2010 - 2030
- Demand by Application
- Products
- Table | Interior Finish Lumber Demand by Product, 2010 - 2030
- Regional Trends
- Table | Interior Finish Lumber Demand by Region, 2010 - 2030
- Competitive Products
- Figure 10-2 | Interior Finish Lumber & Competitive Products: Comparative Growth, 2020 - 2025
- Scope
- Landscaping & Outdoor Lumber
- Scope
- Figure 11-1 | Key Lumber Uses in the Landscaping & Outdoor Market
- Applications
- Demand by Application
- Table | Landscaping & Outdoor Lumber Demand by Application, 2010 - 2030
- Decking
- Table | Decking Lumber Demand by Market & Product, 2010 - 2030
- Fencing
- Table | Fencing Lumber Demand by Market & Product, 2010 - 2030
- Porches & Patios
- Table | Porch & Patio Lumber Demand by Market & Product, 2010 - 2030
- Outdoor Structures (Gazebos, Arbors, Walls, Pergolas)
- Table | Outdoor Structures Applications for Lumber by Market & Product, 2010 - 2030
- Other Landscaping & Outdoor Applications (Playgrounds, Roads & Bridges, Piers, Boardwalks)
- Table | Other Outdoor & Nonbuilding Lumber Demand by Product, 2010 - 2030
- Demand by Application
- Products
- Table | Landscaping & Outdoor Lumber Demand by Product, 2010 - 2030
- Regional Trends
- Table | Landscaping & Outdoor Lumber Demand by Region, 2010 - 2030
- Competitive Products
- Figure 11-2 | Landscaping & Outdoor Lumber & Competitive Products: Comparative Growth, 2020 – 2025
- Scope
- Regional Trends
- Demand by Region
- Table | Lumber Demand by Region, 2010 - 2030
- Northeast
- Table | Northeast: Lumber Demand by Application, 2010 - 2030
- Midwest
- Table | Midwest: Lumber Demand by Application, 2010 - 2030
- South
- Table | South: Lumber Demand by Application, 2010 - 2030
- West
- Table | West: Lumber Demand by Application, 2010 - 2030
- Demand by Region
- Industry Structure
- Key Findings & Industry Composition
- Table | Lumber Sales by Company, 2020
- US Lumber Production Capacity
- Table | US Lumber Production Capacity, 2020: Leading Suppliers
- Market Share
- Figure 13-1 | Lumber Market Share by Company, 2020
- Figure 13-2 | Lumber Market Leading Supplier, 2020
- Figure 13-3 | Lumber Market Second Leading Supplier, 2020
- Figure 13-4 | Lumber Market Third Leading Supplier, 2020
- Figure 13-5 | Lumber Market Fourth Leading Supplier, 2020
- Figure 13-6 | Lumber Market Fifth Leading Supplier, 2020
- Mergers & Acquisitions
- Table | Selected Mergers & Acquisitions
- List of Industry Participants
- Table | Selected Industry Participants
- Key Findings & Industry Composition
- Appendix
- Report Details
- Table | Study Scope: US Geographic Regions & Subregions
- Table | Relevant Industry Codes
- Table | Relevant HS Codes
- Definitions
- Abbreviations
- Table | Abbreviations & Acronyms Used in Study
- Freedonia Methodology
- Study-Specific Methodology
- Sources
- Associations & Agencies
- Related Studies & Reports
- Macroeconomic Assumptions
- Economic Environment
- Table | Macroeconomic Indicators, 2010 - 2030
- Demographic Trends
- Table | Population & Households, 2010 - 2030
- Consumer Spending
- Table | Personal Consumption Expenditures, 2010 - 2030
- Consumer Financing
- Table | Consumer Financing Environment, 2010 - 2020
- Building Construction
- Table | Building Construction Expenditures, 2010 - 2030
- Residential Building Construction
- Table | Residential Building Construction Expenditures, 2010 - 2030
- New Housing
- Table | New Housing Indicators, 2010 - 2030
- Housing Stock
- Table | Housing Stock by Type, 2010 - 2030
- Residential Improvements & Repairs
- Table | Residential Improvement & Repair Expenditures, 2010 - 2030
- Commercial Building Construction
- Table | Commercial Building Construction Expenditures, 2010 - 2030
- Commercial Building Stock
- Table | Commercial Building Stock by Type, 2010 - 2030
- Commercial Improvements & Repairs
- Table | Commercial Building Improvement & Repair Expenditures, 2010 - 2030
- Nonbuilding Construction Expenditures
- Table | Nonbuilding Construction Expenditures, 2010 - 2030
- Manufacturers' Shipments
- Table | Manufacturers' Shipments, 2010 - 2030
- Economic Environment
- Report Details
Pallets and crates (i.e., packaging and shipping) were the leading application for lumber in the industrial and commercial market, with 29% of demand in 2020.
US demand for lumber is forecast to advance modestly through 2025 to 68.8 billion board feet valued at $51.0 billion.
Industry competitors include Weyerhaeuser, Canfor, West Fraser Timber, Georgia-Pacific, and Interfor.