Oklahoma Oil and Gas Drilling Outlook: Drilling Activity by Wells and Rigs in STACK, SCOOP & Other A
SCOOP and STACK are some of the most promising pieces of oil and gas acreage in the US. Like the Permian Basin in Texas and New Mexico, they contain multiple drillable layers bearing fossil fuels.
Free Sample Report
Request a free sample of this report and our team will email it to you.
Report Overview
Stacked Plays: The Favored Geology in the SCOOP and STACK
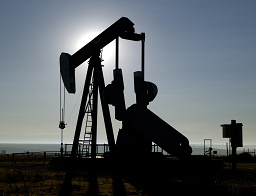
SCOOP and STACK are some of the most promising pieces of oil and gas acreage in the US. Like the Permian Basin in Texas and New Mexico, they contain multiple drillable layers bearing fossil fuels. Via the advancement of unconventional technology, these layers are now capable of being exploited profitably. The STACK is the more promising of the two plays, containing the Chester, Hunton, Meramec, Osage, Oswego, and Woodford formations. The Meramac is the most highly sought after layer, possessing an oil window that, once fractured, produces overpressured oil with low water content. The SCOOP includes layers that can be drilled including the Caney, Hoxbar, Hunton, Springer, and Woodford. While the Woodford Shale is historically the most drilled strata, the recently identified Springer Shale is seeing increased attention.
Key Findings in the Oklahoma Oil and Gas Drilling Outlook Study:
The STACK and SCOOP Lead Drilling Trends in Oklahoma
Two plays are leading the resurgence of Oklahoma oil and gas drilling, the STACK and SCOOP. Both plays lie in the Anadarko Basin of the Woodford Shale. Besides possessing acreage in the heavily-drilled Woodford, these plays have multiple layers of rock and sand capable of being drilled and fractured for oil and gas. The STACK, in particular, has been a highly sought acreage in recent years, favored for its over-pressured and low-water content layer, the Meramec. The STACK was able to avoid significant losses during the drilling downturn that occurred following the oil benchmark price collapse in 2014. Going forward, these plays will continue to increase the importance of the energy industry in Oklahoma.
Unconventional, Horizontal Drilling Techniques Have Advanced and Improved Drilling Economics
Since the rapid expansion of horizontal drilling, less than 10 years ago, significant advances in technology and methods have occurred. Wells are now being drilled more accurately, at faster rates, and with longer laterals, sometimes multiple laterals. Wells are now being completed with more complicated fractures, including tighter clusters and shorter intervals, using higher densities of proppants. Overall, this has shifted breakeven costs in the direction of drillers by decreasing overall costs, while increasing IP rates and EURs. Wells are drilled more cheaply, on a dollar per foot basis, and resources are extracted more easily, on a unit per foot basis.
Advance of Horizontal Drilling Has Slowed in Other Areas
Outside of the STACK and the SCOOP, where horizontal drilling accounts for over 90+% of the drilling activity, another type of drilling remains popular amongst operators. Vertical and directional drilling account for nearly a third of the wells drilled in other areas. This proportion has remained relatively flat for the past few years, reflecting a different trend then the rest of the country. Whereas in most areas horizontal drilling is slowly becoming the main type of oil and gas extraction, in less-promising plays, vertical wells are still used. Operators, constrained by low benchmark oil prices, are relying on older, traditional drilling methods in conventional plays to turn a profit. Although horizontal wells can prove much more productive, the overhead costs of drilling these wells can dissuade drillers from proceeding. The economics of drilling wells at the current price points pushes operators to drill horizontally in the most prolific plays or vertically in the plays that are less sought after.
Drilling Services Costs Have Allowed Drilling to Continue, Despite Low Price Environment
While technology has played a role in helping drillers extract resources in tight oil and shale gas plays in a profitable manner, the current cost of drilling services is an additionally significant contributor to current drilling activity. Following the price collapse in oil benchmark prices in 2014, drilling activity quickly decreased throughout the US. In order to maintain business and to be competitive, companies that provided drilling services had to cut prices. Although, the price of oil has slowly improved in recent months, the low cost of drilling services has allowed drillers to re-enter the market. Going forward, drilling services costs will increase, playing a crucial role in the activity of US oil and gas.
Study Coverage
This Freedonia study analyzes the Oklahoma oil and gas drilling outlook. It presents historical data (2015 and 2016) and forecasts (2017 and 2018) by play (STACK, SCOOP, Arkoma Woodford, and Granite Wash) in wells drilled, footage, and active rigs. Additionally, data is analyzed by well trajectory, resource, operator, and formation, where applicable. The study also evaluates drilling rates, drilling costs, land acquisitions, and infrastructure.
The number of oil and gas wells drilled in Oklahoma will rise 46% through 2017. The STACK, a newer play, has risen even through the oil price collapse in 2014. Outside of the STACK and the SCOOP, low oil and gas prices have decreased overall drilling activity and curtailed a shift from vertical to horizonal drilling. Unconventional drilling techniques have improved since they went into widespread usage in the US in 2010, increasing initial production rates and and estimated ultimate recoveries while reducing drilling times and overall costs to drill a well.
This study analyzes the oil and gas drilling outlook for Oklahoma. Drilling numbers are examined by play, operator, resource, trajectory, county, and formation. Historical data for 2015 and 2016 and forecasts for 2017 and 2018 are presented in various units, including but not limited to wells drilled, footage drilled, and active rigs. Unconventional drilling is used to describe wells that are both unconventionally and horizontally drilled in this study. Although not all wells drilled horizontally are unconventional, and vice versa, we have decided it is safe to assume this is the case for our analysis. Additionally, drilling costs (dollars), drilling rates (days), and production (bbl or mcf) are analyzed in this study.
For the purposes of this study, the state of Oklahoma is divided geographically into several oil and gas plays based on county boundaries. These plays are defined by the counties they encompass and are summarized in the following table.
|
|||||||||||||||
|
|
||||||||||||
|
|
|||||||||
|
- EXECUTIVE SUMMARY
- Figure 1-1 | Oklahoma Drilling Overview
- OKLAHOMA OIL & GAS DRILLING OVERVIEW
- Key Findings
- Figure 2-1 | Key Trends in Oklahoma Oil & Gas Drilling
- Upstream Activity
- Table | Oklahoma: Upstream Drilling Activity, 2015 - 2018
- Historical Drilling Trends
- Figure 2-2 | Oklahoma: Wells Drilled by Play, 2006 - 2016
- Drilling Activity by Trajectory
- Figure 2-3 | Oklahoma: Wells Drilled by Trajectory, 2006 – 2016
- Oklahoma Share of US Drilling Activity
- Figure 2-4 | US versus Oklahoma Upstream Drilling Activity, 2006 - 2016
- Factors Impacting Drilling Activity
- Historical Oil & Gas Price Volatility
- Figure 2-5 | Oil & Gas Prices, 2006 - 2016
- Price Forecasts
- Table | Oil & Gas Prices, 2015 - 2018
- Drilling Costs
- Table | US Exploration & Development Costs per Well Drilled, Selected Operators, 2014 - 2016
- Drilling Efficiency
- Table | Drilling Efficiency Indicators, US Unconventional Oil & Gas, 2015 - 2018
- Figure 2-6 | Oklahoma: Drilling Speeds, 2006 - 2016
- Length of Laterals
- Table | Length of Laterals, 2015 - 2018
- Mid- & Downstream Infrastructure
- Historical Oil & Gas Price Volatility
- Environmental & Regulatory Considerations
- Key Findings
- STACK
- Key Findings
- Figure 3-1 | STACK: Key Trends
- Scope
- Figure 3-2 | STACK: Counties in Oklahoma
- Historical Drilling Activity
- Figure 3-3 | Oklahoma & STACK Upstream Drilling Activity, 2006 - 2016
- Drilling Forecast
- Table | STACK: Upstream Drilling Activity, 2015 - 2018
- Factors Impacting Drilling Activity
- Figure 3-4 | STACK: Factors Impacting Drilling Activity
- Infrastructure Investment
- Table | STACK: Selected Future Pipelines
- Land Acquisitions
- Table | STACK: Selected Land Acquisitions
- Drilling by Operator
- Figure 3-5 | STACK: Wells Drilled by Operator, 2016
- Drilling Forecast by Resource
- Table | STACK: Wells Drilled & Active Drilling Rigs by Resource, 2015 - 2018
- Drilling Forecast by Trajectory
- Table | STACK: Wells Drilled by Trajectory, 2015 - 2018
- Figure 3-6 | STACK: Wells Drilled by Trajectory, 2006 - 2016
- Drilling by County
- Figure 3-7 | STACK: Wells Drilled by County Heat Map
- Drilling by Formation
- Key Findings
- SCOOP
- Key Findings
- Figure 4-1 | SCOOP: Key Trends
- Scope
- Figure 4-2 | SCOOP: Counties in Oklahoma
- Historical Drilling Activity
- Figure 4-3 | Oklahoma versus SCOOP Upstream Activity, 2006 - 2016
- Drilling Forecast
- Table | SCOOP: Upstream Drilling Activity, 2015 - 2018
- Factors Impacting Drilling Activity
- Figure 4-4 | SCOOP: Factors Promoting Drilling Activity
- Infrastructure Investment
- Table | SCOOP: Selected Future Pipelines
- Land Acquisitions
- Table | SCOOP: Selected Land Acquisitions
- Drilling by Operator
- Figure 4-5 | SCOOP: Wells Drilled by Operator, 2016
- Drilling Forecast by Resource
- Table | SCOOP: Wells Drilled & Active Drilling Rigs by Resource, 2015 - 2018
- Drilling Forecast by Trajectory
- Table | SCOOP: Wells Drilled by Trajectory, 2015 - 2018
- Figure 4-6 | SCOOP: Wells Drilled by Trajectory, 2006 - 2016
- Drilling by County
- Figure 4-7 | SCOOP: Wells Drilled by County Heat Map, 2016
- Drilling by Formation
- Key Findings
- OTHER AREAS
- Key Findings
- Figure 5-1 | Other Drilling Areas: Key Trends
- Scope
- Figure 5-2 | Arkoma Woodford & Granite Wash: Counties in Oklahoma
- Historical Drilling Activity
- Figure 5-3 | Oklahoma & Other Areas Upstream Drilling Activity, 2006 - 2016
- Drilling Forecast
- Table | Other Areas: Upstream Drilling Activity, 2015 - 2018
- Factors Impacting Drilling Activity
- Drilling by Operator
- Figure 5-4 | Other Areas: Wells Drilled by Operator, 2016
- Drilling Forecast by Resource
- Table | Other Areas: Wells Drilled & Active Drilling Rigs by Resource, 2015 - 2018
- Drilling Forecast by Trajectory
- Table | Other Areas: Wells Drilled by Trajectory, 2015 - 2018
- Figure 5-5 | Other Areas: Wells Drilled by Trajectory, 2006 - 2016
- Drilling by County
- Figure 5-6 | Other Areas: Wells Drilled by Location Heat Map
- Drilling by Formation
- Key Findings
- APPENDIX
- Scope
- Plays
- Table | Oklahoma Oil & Gas Drilling: Plays
- Well Types
- Table | Oklahoma Oil & Gas Drilling: Well Types
- Resource Types
- Table | Oklahoma Oil & Gas Drilling: Resource Types
- Plays
- Methodology
- Sources
- Associations & Agencies
- Related Freedonia Group Studies
- Definitions
- Abbreviations
- Table | Abbreviations Used in Study
- Macroeconomic Assumptions
- Economic Environment
- Table | Macroeconomic Outlook, 2015 - 2018
- Oil & Gas Production Outlook
- Table | Oil & Gas Production & Consumption, 2015 - 2018
- Economic Environment
- Scope