Refrigerated & Frozen Display Cases
This study analyzes the United States market for display cases, which include normal temperature (which encompass multiple shelf cases with glass doors used to store beverage cans and bottles) and low temperature types available in open or closed configurations.
Free Sample Report
Request a free sample of this report and our team will email it to you.
Report Overview
This study includes the impacts of the COVID-19 pandemic.
Featuring 12 tables and 16 figures – now available in Excel and Powerpoint! Learn More
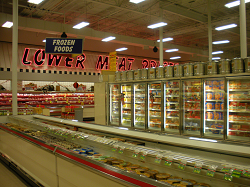
This study analyzes the United States market for display cases, which include normal temperature (which encompass multiple shelf cases with glass doors used to store beverage cans and bottles) and low temperature types available in open or closed configurations.
Markets included are:
- food and beverage retail establishments, including convenience stores, mass merchandisers, and supermarkets, as well as farmers’ markets, produce markets, and other specialty food shops
- foodservice, or the service of food to paying or nonpaying customers by restaurants and bars, airlines, company cafeterias and canteens, daycare facilities, food trucks, government facilities and military sites, institutional establishments, lodging and hospitality establishments, and sports and recreation venues
For the purposes of this study, “food” is occasionally used to refer to both food and beverages.
How will the COVID-19 coronavirus impact the global economy? The Freedonia Group is tracking recent developments and analyzing their impact in an easy to follow Economic Impact Tracker.
Excluded from the scope of this study are:
- air conditioning systems
- all refrigeration equipment designed for residential use
- revenues generated from service and maintenance activities on display cases
- containers that house food and beverage products for transport
- equipment used in liquid natural gas facilities, as the capacity of these products exceeds the defined size of commercial refrigeration equipment
Demand for display cases is presented in US dollars at the manufacturers’ level. Unit estimates are also provided. Historical data for 2009, 2014, and 2019 and forecasts for 2024 and 2029 are presented in current dollars (which are not adjusted to account for inflation).
Demand for display cases is forecast to rise 5.5% annually through 2024 to $1.6 billion, an improvement over the 2014-2019 performance as:
- Retailers continue to replace outdated equipment with new models that feature a number of technologies that improve efficiency or aesthetics by better highlighting the products they hold to encourage purchases.
- Display cases continue to be installed in a growing number of nontraditional food retail settings.
- New micro-market vending systems, which utilize display cases and a separate point-of-sale system instead of a traditional vending machine, continue to be constructed.
COVID-19 Pandemic Expected to Boost Food Retailer Profits & Potential Store Renovations
Though many industries were hard hit by the onset of the COVID-19 pandemic in early 2020, food retail – which accounts for the vast majority of display case demand – recorded strong sales gains during this time. This above average spike in sales could make store renovations more affordable for retailers than it would have been otherwise, though some may still choose to delay renovations until the total impact of the pandemic is more certain.
Changing Consumer Shopping Patterns to Create New Opportunities for Display Cases
The food shopping experience has been undergoing a slow but steady shift as consumers seek more convenience. This has led to a rise in online sales of food, which include:
- direct-to-consumer shipment of groceries from a centralized warehouse or facility
- food delivery services, where a third-party collects groceries from retailers with storefronts and drops them off to consumer
- in-store or curbside pickup, where a store worker or third party collects groceries and the consumer picks them up at the store
The increasing popularity of in-store/curbside pickup services is expected to have a modest impact on display case demand, as some goods ordered through these services need to be stored at a low temperatures while awaiting pickup at the front of the store. While direct-to-consumer food sales have increased as a result of the pandemic, this trend is not expected to have any significant impact on display case sales in the short term, though the facilities that fulfill these orders usually employ other types of equipment to keep food refrigerated.
Ban on R-22 to Have Small – But Not Insignificant – Impact on Equipment Sales Through 2024
Despite the total ban in the US on the production or import of virgin R-22, there is still a significant stock of virgin and reclaimed R-22 that can be used to service existing equipment. As a result, prices for the refrigerant are not expected to increase significantly in the short term, allowing many owners of R-22-based equipment to postpone replacing their systems for now. However, the greater efficiency and long-term availability of systems operating on newer refrigerants is often sufficient to prompt upgrades, especially as newer units generally offer greater aesthetic benefits as well.
- Executive Summary
- Figure 1-1 | US Refrigerated & Frozen Display Case Market
- About This Report
- Report Details
- Study Scope & Product Description
- Figure 2-1 | Types of Display Cases
- Impact of COVID-19 Pandemic
- Overview
- Historical Market Trends
- Table | Refrigerated & Frozen Display Case Demand, 2009 - 2019
- Figure 3-1 | Refrigerated & Frozen Display Case Demand, 2009 - 2019
- Supply & Demand
- Table | Refrigerated & Frozen Display Case Supply & Demand by Product, 2009 - 2029
- Figure 3-2 | US Trade in Refrigerated & Frozen Display Cases, 2002 - 2019
- Foreign Trade
- Figure 3-3 | US Refrigerated & Frozen Display Case Imports by Country, 2009 - 2019
- Figure 3-4 | US Refrigerated & Frozen Display Case Exports by Country, 2009 - 2019
- Types of Display Cases
- Demand by Product
- Table | Refrigerated & Frozen Display Case Demand by Product, 2009 - 2029
- Figure 3-5 | Refrigerated & Frozen Display Case Demand by Type, 2009 - 2029
- Normal Temperature Display Cases
- Figure 3-6 | Types of Normal Temperature Display Cases
- Table | Normal Temperature Display Case Supply & Demand by Type, 2009 – 2029
- Low Temperature Display Cases
- Figure 3-7 | Types of Low Temperature Display Cases
- Table | Low Temperature Display Case Supply & Demand by Type, 2009 – 2029
- Demand by Product
- Drivers & Restraints
- Pricing Trends
- Figure 3-8 | Refrigerated & Frozen Display Case Average Price Growth by Type, 2009 – 2029
- Competitive Products
- Sustainability
- Refrigerant Regulations & Their Impact
- Energy Efficiency Regulations
- Global Outlook
- Figure 3-9 | Global Refrigerated & Frozen Display Case Demand, 2009 - 2024
- Historical Market Trends
- Markets
- Demand by Market
- Table | Refrigerated & Frozen Display Case Demand by Market, 2009 - 2029
- Figure 4-1 | Refrigerated & Frozen Display Case Demand by Market, 2009 - 2029
- Food Retail Outlook & Scope
- Table | Food & Beverage Retail Indicators, 2009 – 2029
- Key Trends in Food & Beverage Retail Markets
- Impact of Growth in Limited Selection Stores
- Curbside Pickup & Carryout Trends
- E-Commerce & Direct-to-Consumer Food Retail
- Demand by Market
- Suppliers & Market Share
- Industry Composition
- Key Suppliers
- Figure 5-1 | US Refrigerated & Frozen Display Case Market Share by Company, 2019
- Mergers & Acquisitions
- Table | Selected Mergers & Acquisitions
- Appendix
- Scope
- Table | Relevant Industry Codes
- Table | Relevant HS Codes
- Definitions
- Freedonia Methodology
- Study-Specific Methodology
- Sources
- Associations & Agencies
- Related Studies & Reports
- Macroeconomic Assumptions
- Economic Environment
- Table | December 2019 Macroeconomic Indicators, 2009 – 2024
- Figure 6-1 | Real GDP: December 2019 Forecast vs. April 2020 Revised Forecast
- Figure 6-2 | Annual Growth in Real GDP, 2000 - 2019, Compared to 1980 - 2005 Average
- Retail Sales Outlook
- Table | Retail Sales, 2009 – 2029
- Figure 6-3 | Retail Sales: December 2019 Forecast vs. April 2020 Revised Forecast
- Economic Environment
- Scope