Texas Oil & Gas Drilling Outlook Including Permian Basin and Eagle Ford
Earlier this spring, MMEX Resources and Raven Petroleum, a subsidiary of Raven Resources Group, announced plans to construct two new oil refineries in Texas.
Free Sample Report
Request a free sample of this report and our team will email it to you.
Report Overview
Infrastructure Update: Two New Oil Refineries Planned in Texas
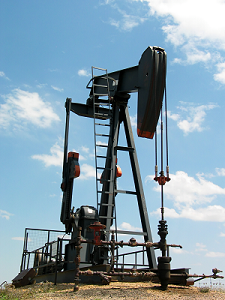
Earlier this spring, MMEX Resources and Raven Petroleum, a subsidiary of Raven Resources Group, announced plans to construct two new oil refineries in Texas. The refineries are planned for the Permian Basin and Eagle Ford Shale regions, respectively. The MMEX facility is expected to have 50,000 BOPD capacity, while the Raven refinery is expected to have a capacity of 55,000 BOPD. This announcement is significant, given the infrequent construction of refineries, especially ones with large capacities. While large capacities are generally thought of as 100,000 to 200,000 or more BOPD, these new refineries will be largest in approximately 40 years in the United States.
Key Findings in the Texas Oil & Gas Drilling Outlook Study:
Permian Basin Leads Drilling Trends in Texas
While Texas currently occupies the largest share of drilling rigs and is drilling the most wells in the US, the Permian Basin, the most promising play in Texas, is driving activity in the state. The Permian Basin, identified by the USGS in 2016 as containing the largest contiguous recoverable volume of resources in US history, is valued for its unique geology. The region possesses a stratigraphy that has multiple stacked layers of proven resources. As a result, operators have flocked to the play, investing nearly $30 billion dollars in leases since June of 2016. The Permian Basin has the best drilling economics in the country and the drilling statistics are a reflection of that profitability.
Technological Advances in Unconventional Drilling Lower Breakeven Costs
Since the rise in popularity of unconventional drilling techniques, specifically hydraulic fracturing of horizontal well bores to retrieve resources from low permeability rock, the technology has continually improved. As of today, hydraulic fracturing is being performed on longer lateral lengths with high proppant densities, tighter frac clusters, and more frac stages. Additionally, drilling speeds are faster, multi-well pads are increasing, and multi-lateral wells are more common. All of these advances increase well profitability, either decreasing overhead costs on a per well basis or increasing the IP rate and EUR of a well. The lower the overhead costs equals a lower breakeven cost, and the more money that can be potentially made off a well translates to better overall drilling economics. Wells can be drilled with lower and lower benchmark oil prices.
Drilling Services Costs are Deflated Due to Lowered Drilling Activity
Following the collapse in benchmark oil prices in 2014, companies providing drilling services were forced to decrease prices to compete in a bear market. Drilling activity around the country slowed because the breakeven costs associated with drilling most wells become unattainable. Subsequently, drilling services were and are being delivered to operators at discounted rates to maintain their business amongst their competitors. While some of the cost savings currently found in drilling wells across the country is a result of technology, an equal contributor is the currently lower drilling services costs.
Outside of the Major Plays, Horizontal Drilling is Decreasing
Outside of major plays like the Permian Basin, a majority of wells drilled are more traditional in composition. Where operators are unable to meet breakeven costs as result of unique geology, ample infrastructure, or high IP rates, wells are being drilled vertically in conventional plays. Since unconventional drilling techniques come with higher costs for drilling and completion, drillers are opting to drill vertical wells in proven conventional plays that meet the bottom line.
Study Coverage
This study presents historical data (2015 and 2016) and forecasts (2017 and 2018) by play (Permian Basin, Eagle Ford Shale, Barnett Shale, and Haynesville Shale) in wells drilled, footage, and active rigs. Historical data is presented for drilling permits. Additionally, data is analyzed by well trajectory, resource, and sub-basin, where applicable. The study also evaluates drilling rates, drilling costs, land acquisitions, and infrastructure.
- EXECUTIVE SUMMARY
- Figure 1-1 | Texas Drilling Overview
- TEXAS OIL & GAS DRILLING OVERVIEW
- Key Findings
- Figure 2-1 | Key Trends in Texas Oil & Gas Drilling
- Upstream Activity
- Table | Texas: Upstream Drilling Activity, 2015-2018
- Historical Drilling Trends
- Figure 2-2 | Texas: Wells Drilled by Play, 2006-2016
- Drilling Activity by Trajectory
- Figure 2-3 | Texas: Wells Drilled by Trajectory, 2006-2016
- Texas Share of US Drilling Activity
- Figure 2-4 | US versus Texas Upstream Drilling Activity, 2006-2016
- Factors Impacting Drilling Activity
- Historical Oil & Gas Price Volatility
- Figure 2-5 | Oil & Gas Prices, 2006-2016
- Price Forecasts
- Table | Oil & Gas Prices, 2015-2018
- Drilling Costs
- Table | US Exploration & Development Costs per Well Drilled, Selected Operators, 2014-2016
- Drilling Efficiency
- Table | Drilling Efficiency Indicators, US Unconventional Oil & Gas, 2015-2018
- Initial Production Rates
- Mid- & Downstream Infrastructure
- Figure 2-6 | Texas: Midstream Oil & Gas Infrastructure Highlights
- Historical Oil & Gas Price Volatility
- Environmental & Regulatory Considerations
- Key Findings
- PERMIAN BASIN
- Key Findings
- Figure 3-1 | Permian Basin: Key Trends
- Scope
- Table | Permian Basin: Counties in Texas
- Figure 3-2 | Permian Basin: Counties in Texas
- Historical Drilling Activity
- Figure 3-3 | Texas versus Permian Basin Upstream Activity, 2006-2016
- Drilling Forecast
- Table | Permian Basin: Upstream Drilling Activity, 2015-2018
- Factors Impacting Drilling Activity
- Figure 3-4 | Permian Basin: Factors Promoting Drilling Activity
- Infrastructure Investment
- Table | Permian Basin: Selected Crude Oil Transmission Pipelines
- Land Acquisitions
- Table | Permian Basin: Selected Land Acquisitions
- Permit Activity
- Figure 3-5 | Permian Basin: Drilling Permits, 2006-2016
- Drilling Forecast by Trajectory
- Table | Permian Basin: Wells Drilled by Trajectory, 2015-2018
- Figure 3-6 | Permian Basin: Wells Drilled by Trajectory
- Drilling by County
- Figure 3-7 | Permian Basin: Wells Drilled by County Heat Map
- Drilling Forecast by Sub-Basin
- Table | Permian Basin: Wells Drilled by Sub-Basin, 2015-2018
- Key Findings
- EAGLE FORD SHALE
- Key Findings
- Figure 4-1 | Eagle Ford Shale: Key Trends
- Scope
- Table | Eagle Ford Shale: Counties in Texas
- Figure 4-2 | Eagle Ford Shale: Counties in Texas
- Historical Drilling Activity
- Figure 4-3 | Texas versus Eagle Ford Shale Upstream Drilling Activity, 2006-2016
- Drilling Forecast
- Table | Eagle Ford Shale: Upstream Drilling Activity, 2015-2018
- Factors Impacting Drilling Activity
- Figure 4-4 | Eagle Ford Shale: Factors Impacting Drilling Activity
- Infrastructure
- Table | Eagle Ford Shale: Selected Pipelines
- Land Acquisitions
- Table | Eagle Ford Shale: Selected Land Acquisitions
- Permit Activity
- Figure 4-5 | Eagle Ford Shale: Drilling Permits, 2006-2016
- Drilling Forecast by Resource
- Table | Eagle Ford Shale: Active Drilling Rigs by Resource, 2015-2018
- Figure 4-6 | Eagle Ford Shale: Active Drilling Rigs by Resource, 2012-2017
- Drilling Forecast by Trajectory
- Table | Eagle Ford Shale: Wells Drilled by Trajectory, 2015-2018
- Figure 4-7 | Eagle Ford Shale: Wells Drilled by Trajectory, 2006-2016
- Drilling by County
- Figure 4-8 | Eagle Ford Shale: Wells Drilled by County Heat Map
- Key Findings
- OTHER AREAS
- Key Findings
- Figure 5-1 | Other Drilling Areas: Key Trends
- Scope
- Table | Barnett Shale & Haynesville Shale: Counties in Texas
- Figure 5-2 | Barnett Shale & Haynesville Shale: Counties in Texas
- Historical Drilling Activity
- Figure 5-3 | Texas versus Other Areas Upstream Drilling Activity, 2006-2016
- Drilling Forecast
- Table | Other Areas: Upstream Drilling Activity, 2015-2018
- Factors Impacting Drilling Activity
- Figure 5-4 | Other Areas: Factors Impacting Drilling Activity
- Land Acquisitions
- Table | Other Areas: Recent Land Acquisitions
- Permit Activity
- Figure 5-5 | Other Areas: Drilling Permits, 2006-2016
- Drilling Forecast by Resource
- Table | Other Areas: Active Drilling Rigs by Resource, 2015-2018
- Figure 5-6 | Other Areas: Active Drilling Rigs by Resource, 2012-2017
- Drilling Forecast by Trajectory
- Table | Other Areas: Wells Drilled by Trajectory, 2015-2018
- Figure 5-7 | Other Areas: Wells Drilled by Trajectory, 2006-2016
- Drilling by County
- Figure 5-8 | Other Areas: Wells Drilled by County Heat Map
- Key Findings
- APPENDIX
- Scope
- Plays
- Table | Texas Oil & Gas Drilling: Plays
- Well Types
- Table | Texas Oil & Gas Drilling: Well Types
- Resource Types
- Table | Texas Oil & Gas Drilling: Resource Types
- Plays
- Methodology
- Sources
- Associations & Agencies
- Related Freedonia Group Studies
- Definitions
- Abbreviations
- Table | Abbreviations Used in Study
- Macroeconomic Assumptions
- Economic Environment
- Table | Macroeconomic Outlook, 2015-2018
- Oil & Gas Production Outlook
- Table | Oil & Gas Production & Consumption, 2015-2018
- Economic Environment
- Scope