US Cabinets Market – Industry Research Report
This Freedonia study analyzes the US cabinets industry. It presents historical demand data (2013, 2018 and 2023) and forecasts (2028 and 2033) by product, market, application , and by region and subregion.
Free Sample Report
Request a free sample of this report and our team will email it to you.
Report Overview
Residential remodeling demand for office, laundry, and garage cabinets is expected to grow faster than demand for kitchen and bathroom cabinets.
This Freedonia study analyzes the US cabinets industry. It presents historical demand data (2013, 2018 and 2023) and forecasts (2028 and 2033) by product (base, wall, tall, vanity, medicine cabinet, entertainment centers, store fixtures, corner & other cabinets), market (residential & commercial), application (new and remodeling), and by region and subregion. Demand for all products is measured in unit terms and value terms. Year by year historical market volatility is also addressed. The study also evaluates factors that will influence cabinets demand and profiles key industry participants, such as MasterBrand Cabinets, American Woodmark, and Cabinetworks Group.
Featuring 183 tables and 67 figures – available in Excel and Powerpoint! Learn More
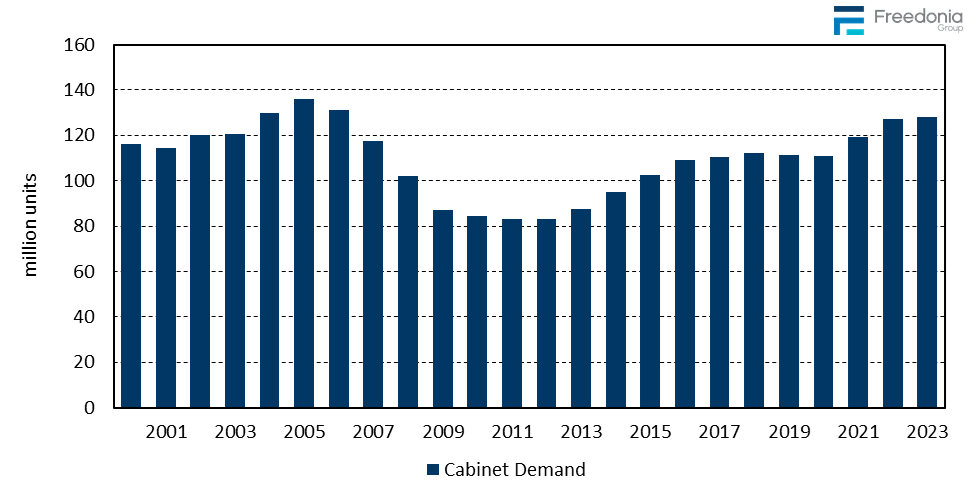
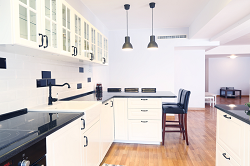 Demand in volume terms for cabinets in the US is forecast to rise at an annual average rate of 1.1% to 135 million units in 2028. Real growth will be restrained by declines in conventional housing completions, as cabinets are typically installed at the end of home construction:
-
Single-family completions are forecast to see minimal growth over the forecast period due to rising construction costs, which have reduced the affordability of new housing.
-
Over the same span, multifamily starts are expected to decline significantly from the previous period.
Cabinet demand gains will mostly derive from ongoing residential renovation activity along with a rebound in commercial building construction, most notably for offices and hotels, which were significantly impacted by the pandemic during the historical period.
Market value will see a significant deceleration from the 2018-2023 period; most cabinet product prices will moderate following spikes that were precipitated by supply chain issues and high raw material costs. However, market value is expected to outpace real growth because of the increasing use of higher value cabinets with enhanced performance and aesthetic properties.
Above Average Demand Gains for Residential Remodeling of Office/Garage/Laundry Rooms
Residential remodeling demand for office, laundry, and garage cabinets is expected to grow faster than demand for kitchen and bathroom cabinets – the two most popular rooms to remodel. Demand for cabinets in these spaces is a reflection of the larger trend of homeowners seeking to maximize storage space. Homeowners will look to replace older cabinets not only for aesthetic reasons, but also to add floor-to-ceiling cabinetry to provide more storage and create a clutter-free environment.
Aesthetics & Cost Relative to Custom Cabinets Make Semicustom Cabinets Popular
Following a poor performance in real terms due to a combination of inflated pricing and limited availability because of supply chain issues, semicustom cabinets are expected to have an improved outlook through 2028. Semicustom cabinets are attractive to consumers because they cost less than custom cabinets, but have a similar appearance from a distance. In addition, consumers – particularly owners of single-family residences – opt for these cabinets to improve the functionality and enhance the appearance of their kitchens, bathrooms, and other rooms. For example, design trends that call for the development of master bathrooms with “his-and-her” vanities will employ semicustom cabinets to differentiate each vanity.
Historical Trends
Demand for cabinets is almost entirely dependent on trends in building construction and remodeling activity, with the most significant being:
-
new housing construction (new home completions)
-
single-family residential remodels, which often include the replacement of cabinets or the addition of a bathroom
-
commercial building construction, especially buildings such as healthcare and educational facilities, along with office buildings and retail establishments
Other factors impacting demand for cabinets and the mix of products used include:
-
the average size of homes and commercial buildings and number of rooms such as kitchens and bathrooms in new buildings that traditionally include cabinets
-
the health of the economy and level of interest rates, both of which can impact the ability of consumers to afford new housing or renovations
-
shifts in consumer taste such as a change in preference toward cabinets with a more natural aesthetic or a preference for freestanding furniture
-
raw material costs and shifts in the types of cabinets used, which can impact trends in market value
Year-to-year volatility in unit demand for cabinets is primarily a function of cyclicality in the building construction industry. However, major fluctuations in the cost of materials used in the construction of cabinets (such as lumber) can result in volatility in value demand as well.
Materials Overview (Wood, Laminate, Metal, Plastic, Other)
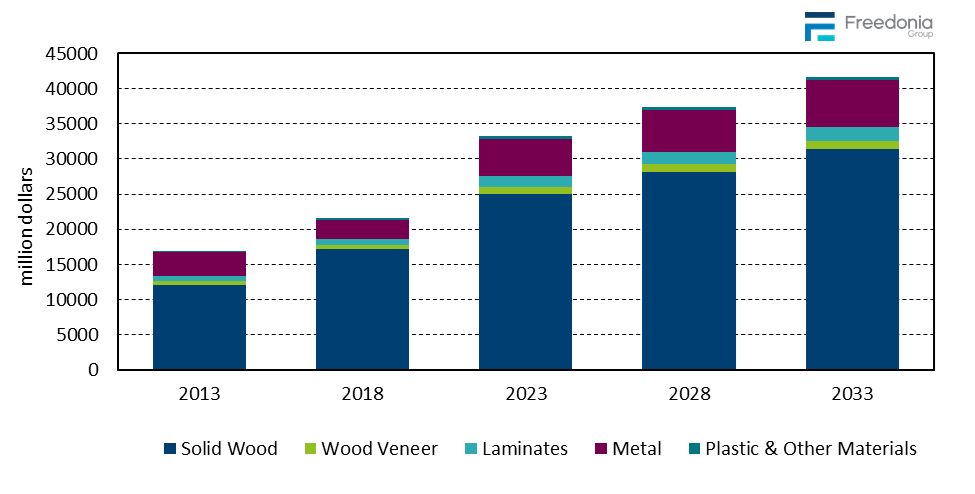
Competition in the cabinets industry is mostly based on the primary material of construction, with most cabinets being either wood, laminate or metal products.
Unit demand for cabinets in the US is forecast to grow:
-
Unit gains for metal cabinets will be supported by an improvement in commercial building construction, as cabinets made with these types of materials are used more intensively in the commercial market.
-
Demand growth for cabinets made with materials used more intensively in the residential market – wood cabinets and those made with laminates – will be restrained by a moderation in housing completions following healthy gains during the 2018-2023 period.
Market value for all cabinets sold is expected to increase 2.4% per year, a significant slowdown as raw material costs moderate from the inflated levels seen in the previous forecast period. However, market value is still expected to outpace real growth because of the increasing use of higher value cabinet products with enhanced performance and aesthetic properties.
Markets Overview (Residential & Commercial)
The outlook for cabinets by market varies. Growth in the residential market will continue to normalize following the relatively fast demand gains of 2021 and 2022, while demand for commercial cabinets will accelerate as commercial building construction improves. Market value in both the residential and commercial markets will decelerate significantly as price growth returns to pre-pandemic rates.
The residential market accounts for the larger share of cabinet demand (with 87% of unit demand in 2023), due to the:
-
greater number of residential buildings constructed each year compared to nonresidential buildings
-
more intensive use of cabinets as a storage option in residences (especially single-family housing units)
-
interest among homeowners in using cabinets as both an aesthetic and a functional element of a residence
Demand for residential cabinets is benefiting from:
-
style trends that call for homes to have larger kitchens and more and larger bathrooms that increase the amount of space available for cabinetry
-
manufacturer efforts to include more amenities – such as LED lighting, pull-out shelves, and racks – in kitchen cabinets that boost their average sale price
-
homeowners looking to reduce clutter and improve the look of their homes by installing cabinets in such areas of a home as mudrooms, laundry rooms, and garages
Through 2028, the commercial market is expected to see faster gains in both value and volume term compared to residential, driven by a rebound in commercial building construction following pandemic-related declines, with additional gains supported by:
-
commercial building owners increasingly engaging in kitchen and bathroom remodeling projects
-
increasing construction of new educational, healthcare, office, and hospitality buildings, many of which use cabinets to provide secure and discreet storage space
Areas of Cabinet Installation (Kitchen, Bath, Other Areas)
Kitchen cabinets will continue to account for the majority of US cabinet demand in both unit and value terms, due to:
-
the larger number of cabinets installed per kitchen compared to that of bathrooms and other rooms
-
the generally larger size and additional included features of kitchen cabinets that allow these cabinets to be sold at higher price points
-
high levels of consumer interest in installing more aesthetically pleasing (and thus expensive) cabinets
-
the fact that most homeowners – as part of a kitchen renovation – tend to not only replace all cabinets in a kitchen but often install more cabinets during remodeling to increase storage space
Bathroom cabinets will see above average growth in value terms, supported by:
-
design trends that call for homes to have more bathrooms, many of which will incorporate at least one cabinet for storage
-
rising interest in larger bathrooms – such as master bathrooms with his-and-her sinks – that feature more and larger cabinets
Demand for other cabinets (e.g., cabinets installed in rooms other than the kitchen or bathroom) is expected to exhibit solid growth in both value and unit terms, due to a combination of rebounding commercial building construction and the large portion of other cabinets made with more expensive materials, such as metal and glass. The installation of garage cabinets – especially those made of higher value materials such as metal – will also contribute to value growth.
Building Construction Activity
Demand for cabinets is related primarily to building construction activity, especially construction activity in the residential market. Consequently, cyclicality in the construction industry can have a significant impact on the outlook for the cabinets market. Cabinets are essential components of many buildings, although the characteristics of the cabinets used may vary significantly depending on whether the structure is residential or commercial.
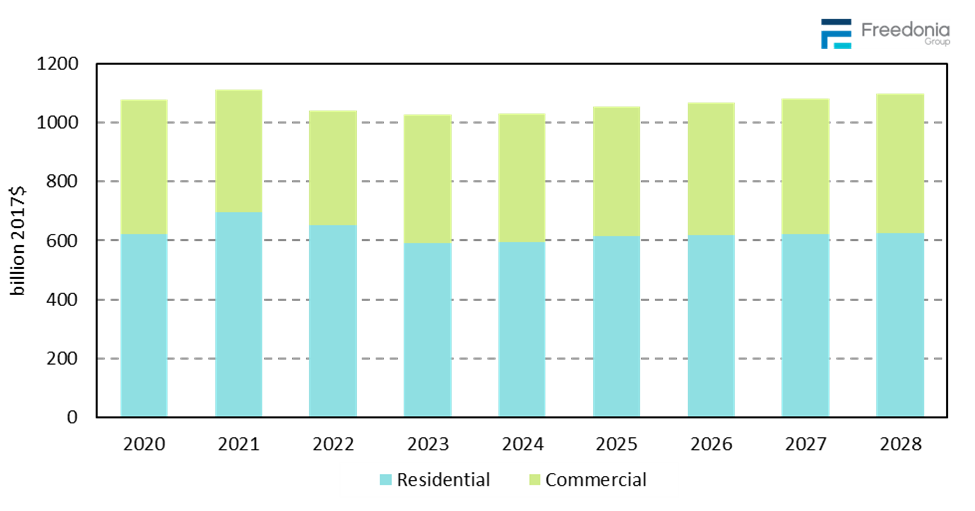
Real building construction expenditures are expected to rebound to an average of 1.3% per year through 2028:
-
Residential building construction is also expected to rebound from the previous period, due to a return to more stable growth in single-family housing and renovation expenditures, after the surges in 2020 and 2021, and declines in 2022 and 2023 that resulted from a variety of pandemic-related trends.
-
Commercial building construction is also anticipated to rebound from the pandemic-induced declines of the 2018-2023 period, thereby supporting the construction of lodging, healthcare, and industrial facilities.
US demand for cabinets is forecast to increase 2.4% per year to $30.5 billion in 2030, supported by single-family remodeling activity and rising commercial construction spending.
Remodeling Continues to Carry the Market
Remodeling will remain the largest cabinet application and its share of gains will expand due to a weak outlook for new housing construction. Limited home turnover will keep owners in place, channeling demand toward aging kitchens, bathrooms, laundry rooms, and other storage-intensive spaces. Deteriorated cabinets, inefficient layouts, and inadequate storage increasingly support replacement even when cosmetic work is deferred. This favors suppliers that can adapt to existing dimensions, coordinate with retained finishes, and improve functionality without requiring extensive structural work.
New construction will still account for a sizable share of demand, but builders are still emphasizing smaller homes, efficient layouts, and tighter cabinet budgets. Manufacturers that deliver an upgraded appearance and simple installation can protect builder demand without relying on extensive customization.
Storage a Key Factor in Cabinet Choices
A greater emphasis is being placed on maximizing storage space rather than simply focusing on cabinet aesthetics. Beyond food preparations, kitchens support informal dining, entertaining, and remote work, while more small appliances increase pressure to keep countertops clear. Tall pantry cabinets, deep drawers, appliance garages, waste pullouts, and beverage storage can address these needs. Islands add cabinet demand by combining storage, seating, appliances, and preparation space in one structure. Coordinated cabinetry is also moving into pantries, mudrooms, laundry rooms, and home offices, expanding project value. Natural wood and simplified doors add warmth, while mixed finishes personalize islands and lower cabinets.
Semicustom Cabinetry Finds Opportunity in the Middle Ground
Semicustom cabinets will see increasing use by filling the gap between basic stock cabinets and more expensive custom cabinets. Standard doors and finishes can be paired with flexible widths, pantry configurations, drawers, and interior organization that meet customer needs. Partial renovations create another opening as homeowners add an island, extend a cabinet run, or replace deteriorated sections rather than rebuild the entire kitchen. Seniors choosing to age in place also supports drawers, pull down shelves, and integrated lighting that improve access without creating an institutional appearance.
US Cabinets Report Details
| Current Total Market Size | $27.1 billion |
| Forecast Total Market Growth Rate | 2.4% CAGR from 2025-2030 |
| Historical Period | 2015-2025 |
| Forecast Period | 2025-2030 |
| Units Covered | Units, Dollars |
| Regions | Northeast, Midwest, South, West |
| Types | Kitchen, Bathroom, Other |
| Products | Base, Wall, Tall, Corner, Vanity, Medicine Cabinets, Other |
| Markets | New Residential, Residential Remodeling, New Commercial, Commercial Remodeling |
| Materials | Wood, Metal, Other |
| Box Construction | Face Frame, Frameless |
| Construction Method | Stock, Semicustom, Custom |
| Point Where Data is Measured | Manufacturer’s Level |
| Additional Elements | Market Share in Total |
Leading Companies Driving Trends in the US Cabinets Industry
| American Woodmark | Koch & Company |
| Cabinetworks Group | Kohler |
| Conestoga Wood Specialties | Lozier |
| Crystal Cabinet Works | MasterBrand |
| Fabuwood | W W Wood Products |
| FS Builder Resources (Leedom) | Wellborn Cabinet |
| Kent Moore Cabinets | Wood-Mode |
| Kith Kitchens |
Historical Market Size & Growth Drivers
US cabinet demand changes from year to year based on the number and type of construction and remodeling projects underway, as well as shifts in project budgets, product mix, and cabinet pricing. Because cabinets are installed relatively late in the construction process, demand often trails changes in housing starts, commercial building activity, and remodeling decisions:
- New single-family construction is a sizable source of kitchen, bathroom, laundry, and utility cabinet demand, while multifamily construction supports larger volumes of standardized stock products. Residential remodeling is generally more stable and becomes especially important when homeowners remain in place because of high mortgage rates or limited housing availability. Existing home sales also affect demand because purchases frequently lead to kitchen and bathroom improvements, although high borrowing costs and weak housing turnover can delay these projects.
- Cabinet demand also depends on consumer confidence, household income, home equity, financing costs, and the affordability of complete remodeling projects. Rising labor, countertop, appliance, and installation costs can reduce project scope even when homeowners remain interested in renovating. Builders and property owners may respond by selecting stock cabinets, limiting finish choices, or reducing cabinet counts, while affluent homeowners may continue to support semicustom and custom products.
- Annual sales can also change because of shifts in cabinet prices and materials. Lumber, plywood, particleboard, hardware, coatings, transportation, and labor costs affect manufacturer pricing and project budgets. Imports, tariffs, freight conditions, and exchange rates influence the competitiveness of domestic and imported cabinets, particularly in ready-to-assemble and opening price point categories.
- Commercial demand follows construction and renovation activity in healthcare, education, hospitality, retail, offices, laboratories, and other facilities. Product mix can significantly affect market value because a shift toward custom casework, premium wood cabinets, metal storage, integrated lighting, or specialized hardware can increase sales even when unit demand grows slowly. Conversely, stronger multifamily and production housing activity can increase cabinet volume while favoring lower priced stock products.
Report Scope
The study analyzes US demand for cabinets by cabinet type, material, market, box construction, construction method, and US region.
Cabinet types include:
- kitchen cabinets
- bathroom cabinets
- other cabinet types, including:
- laundry and mudroom cabinets
- garage cabinets
- store fixture cabinets
- entertainment center cabinets
- home office cabinets
- other miscellaneous cabinets (e.g., those used in residential libraries, living rooms, bedrooms, craft and hobby rooms, laboratories, pharmacies, office storage areas, classrooms, and foyers and entryways)
Market segments are:
- new residential
- residential remodeling
- new commercial
- commercial remodeling
The residential market is further segmented by housing type (single-family, multifamily, and manufactured housing), while the commercial market is segmented by building type (office, retail, hotel and lodging, institutional, and other commercial buildings, such as industrial and transportation).
The remodeling market only counts entire cabinet units being replaced. The refacing or replacement of doors or accessories is excluded from the scope of this study.
Construction methods of cabinets are:
- stock cabinets
- semicustom cabinets
- custom cabinets
Demand by box construction is broken out by:
- face framed
- frameless
Product segments are:
- base
- wall
- tall
- corner
- vanity
- medicine cabinet
- other cabinets, including store fixtures and entertainment centers
Cabinets are also segmented by the following materials:
- wood, including hardwood and engineered wood
- metal
- other materials, such as laminate, plastic/acrylic, bamboo, glass, and wheatboard, thermofoil, and melamine
Historical data for 2015, 2019, and 2025 and forecasts for 2030 and 2035 are presented in current dollars (which are not adjusted for inflation) and volume terms (units). Demand for cabinets is also broken out for US geographic regions and subregions.
| NAICS 2017 North American Industry Classification System |
SIC Standard Industrial Classification |
||
| 337110 | Wood kitchen cabinet and countertop manufacturing | 2434 | Wood kitchen cabinets |
| 337124 | Metal household furniture manufacturing | 2514 | Metal household furniture |
| 337215 | Showcase, partition, shelving, and locker manufacturing | 2541 | Wood office and store fixtures, partitions, shelving, and lockers |
| 2542 | Office and store fixtures, partitions, shelving, and lockers, except wood | ||
| HS Code | Definition |
| 9403.40.90.60 | Wooden cabinets of a kind used in the kitchen, designed for permanent installation |
| 7610 | Aluminum structures and parts of structures; aluminum plates, rods, profiles, tubes and the like, prepared for use in structures: |
- Executive Summary
- Figure 1-1. US Cabinet Market Overview
- Overview
- Historical Trends
- Table | Cabinet Demand, 2015 – 2025 (million dollars & thousand units)
- Figure 2-1. Cabinet Demand 2000 – 2025 (million units)
- Demand by Cabinet Type
- Table | Cabinet Demand by Type, 2015, 2019, 2025, 2030, &2035 (million dollars & thousand units)
- Demand by Material
- Table | Cabinet Demand by Material, 2015, 2019, 2025, 2030, &2035 (million dollars & thousand units)
- Demand by Market
- Table | Cabinet Demand by Market, 2015, 2019, 2025, 2030, &2035 (million dollars & thousand units)
- Cabinet Product Trends
- Table | Cabinet Demand by Product, 2015, 2019, 2025, 2030, &2035 (million dollars & thousand units)
- Demand by Box Construction
- Table | Cabinet Demand by Box Construction, 2015, 2019, 2025, 2030, &2035 (million dollars & thousand units)
- Demand by Construction Method
- Table | Cabinet Demand by Construction Method, 2015, 2019, 2025, 2030, &2035 (million dollars & thousand uni
- Cabinet Pricing Trends
- Table | Selected Cabinet Product Prices, 2015, 2019, 2025, 2030, &2035 (dollars per unit)
- Supply & Demand
- Table | Cabinet Supply & Demand, 2015, 2019, 2025, 2030, &2035 (million dollars)
- Historical Trends
- Cabinet Type
- Kitchen Cabinets
- Figure 3-1. Kitchen Cabinets: Product Examples
- Table | Kitchen Cabinet Demand by Material, 2015, 2019, 2025, 2030, &2035 (million dollars & thousand units)
- Table | Kitchen Cabinet Demand by Market, 2015, 2019, 2025, 2030, &2035 (million dollars & thousand units)
- Table | Kitchen Cabinet Demand by Product, 2015, 2019, 2025, 2030, &2035 (million dollars & thousand units)
- Table | Kitchen Cabinet Demand by Box Construction, 2015, 2019, 2025, 2030, &2035 (million dollars & thousan
- Table | Kitchen Cabinet Demand by Construction Method, 2015, 2019, 2025, 2030, &2035 (million dollars & thou
- Bathroom Cabinets
- Figure 3-2. Bathroom Cabinets: Product Examples
- Table | Bathroom Cabinet Demand by Material, 2015, 2019, 2025, 2030, &2035 (million dollars & thousand units
- Table | Bathroom Cabinet Demand by Market, 2015, 2019, 2025, 2030, &2035 (million dollars & thousand units)
- Table | Bathroom Cabinet Demand by Product, 2015, 2019, 2025, 2030, &2035 (million dollars & thousand units)
- Table | Bathroom Cabinet Demand by Box Construction, 2015, 2019, 2025, 2030, &2035 (million dollars & thousa
- Table | Bathroom Cabinet Demand by Construction Method, 2015, 2019, 2025, 2030, &2035 (million dollars & tho
- Other Cabinet Types
- Figure 3-3. Other Cabinet Types: Examples
- Table | Other Cabinet Types Demand by Material, 2015, 2019, 2025, 2030, &2035 (million dollars & thousand un
- Table | Other Cabinet Types Demand by Market, 2015, 2019, 2025, 2030, &2035 (million dollars & thousand unit
- Table | Other Cabinet Types Demand by Product, 2015, 2019, 2025, 2030, &2035 (million dollars)
- Table | Other Cabinet Types Demand by Box Construction, 2015, 2019, 2025, 2030, &2035 (million dollars & tho
- Table | Other Cabinet Types Demand by Construction Method, 2015, 2019, 2025, 2030, &2035 (million dollars &
- Figure 3-4. Other Cabinet Demand by Type, 2025 (million units)
- Kitchen Cabinets
- Cabinet Materials
- Wood Cabinets
- Figure 4-1. Wood Cabinets: Product Examples
- Table | Wood Cabinet Demand by Type, 2015, 2019, 2025, 2030, &2035 (million dollars & thousand units)
- Table | Wood Cabinet Demand by Market, 2015, 2019, 2025, 2030, &2035 (million dollars & thousand units)
- Table | Wood Cabinet Demand by Box Construction, 2015, 2019, 2025, 2030, &2035 (million dollars & thousand u
- Table | Wood Cabinet Demand by Construction Method, 2015, 2019, 2025, 2030, &2035 (million dollars & thousan
- Metal Cabinets
- Figure 4-2. Metal Cabinets: Product Examples
- Table | Metal Cabinet Demand by Type, 2015, 2019, 2025, 2030, &2035 (million dollars & thousand units)
- Table | Metal Cabinet Demand by Market, 2015, 2019, 2025, 2030, &2035 (million dollars & thousand units)
- Table | Metal Cabinet Demand by Box Construction, 2015, 2019, 2025, 2030, &2035 (million dollars & thousand
- Table | Metal Cabinet Demand by Construction Method, 2015, 2019, 2025, 2030, &2035 (million dollars & thousa
- Other Cabinet Materials
- Figure 4-3. Other Cabinet Materials: Product Examples
- Table | Other Cabinet Materials Demand by Type, 2015, 2019, 2025, 2030, &2035 (million dollars & thousand un
- Table | Other Cabinet Materials Demand by Market, 2015, 2019, 2025, 2030, &2035 (million dollars & thousand
- Table | Other Cabinet Materials Demand by Box Construction, 2015, 2019, 2025, 2030, &2035 (million dollars &
- Table | Other Cabinet Materials Demand by Construction Method, 2015, 2019, 2025, 2030, &2035 (million dollar
- Wood Cabinets
- Cabinet Markets
- Residential Cabinets
- Table | Residential Cabinet Demand by Material, 2015, 2019, 2025, 2030, &2035 (million dollars & thousand un
- Table | Residential Cabinet Demand by Application & Housing Type, 2015, 2019, 2025, 2030, &2035 (million dol
- Table | Residential Cabinet Demand by Box Construction, 2015, 2019, 2025, 2030, &2035 (million dollars & tho
- Table | Residential Cabinet Demand by Construction Method, 2015, 2019, 2025, 2030, &2035 (million dollars &
- Commercial Cabinets
- Table | Commercial Cabinet Demand by Material, 2015, 2019, 2025, 2030, &2035 (million dollars & thousand uni
- Table | Commercial Cabinet Demand by Application & Building Type, 2015, 2019, 2025, 2030, &2035 (million dol
- Table | Commercial Cabinet Demand by Box Construction, 2015, 2019, 2025, 2030, &2035 (million dollars & thou
- Table | Commercial Cabinet Demand by Construction Method, 2015, 2019, 2025, 2030, &2035 (million dollars & t
- Residential Cabinets
- Cabinet Box Construction
- Face Framed Cabinets
- Table | Face Framed Cabinet Demand by Type, 2015, 2019, 2025, 2030, &2035 (million dollars & thousand units)
- Table | Face Framed Cabinet Demand by Material, 2015, 2019, 2025, 2030, &2035 (million dollars & thousand un
- Table | Face Framed Cabinet Demand by Market, 2015, 2019, 2025, 2030, &2035 (million dollars & thousand unit
- Table | Face Framed Cabinet Demand by Construction Method, 2015, 2019, 2025, 2030, &2035 (million dollars &
- Frameless Cabinets
- Table | Frameless Cabinet Demand by Type, 2015, 2019, 2025, 2030, &2035 (million dollars & thousand units)
- Table | Frameless Cabinet Demand by Material, 2015, 2019, 2025, 2030, &2035 (million dollars & thousand unit
- Table | Frameless Cabinet Demand by Market, 2015, 2019, 2025, 2030, &2035 (million dollars & thousand units)
- Table | Frameless Cabinet Demand by Construction Method, 2015, 2019, 2025, 2030, &2035 (million dollars & th
- Face Framed Cabinets
- Cabinet Construction Method
- Stock Cabinets
- Table | Stock Cabinet Demand by Type, 2015, 2019, 2025, 2030, &2035 (million dollars & thousand units)
- Table | Stock Cabinet Demand by Material, 2015, 2019, 2025, 2030, &2035 (million dollars & thousand units)
- Table | Stock Cabinet Demand by Market, 2015, 2019, 2025, 2030, &2035 (million dollars & thousand units)
- Table | Stock Cabinet Demand by Box Construction, 2015, 2019, 2025, 2030, &2035 (million dollars & thousand
- Semicustom Cabinets
- Table | Semicustom Cabinet Demand by Type, 2015, 2019, 2025, 2030, &2035 (million dollars & thousand units)
- Table | Semicustom Cabinet Demand by Material, 2015, 2019, 2025, 2030, &2035 (million dollars & thousand uni
- Table | Semicustom Cabinet Demand by Market, 2015, 2019, 2025, 2030, &2035 (million dollars & thousand units
- Table | Semicustom Cabinet Demand by Box Construction, 2015, 2019, 2025, 2030, &2035 (million dollars & thou
- Custom Cabinets
- Table | Custom Cabinet Demand by Type, 2015, 2019, 2025, 2030, &2035 (million dollars & thousand units)
- Table | Custom Cabinet Demand by Material, 2015, 2019, 2025, 2030, &2035 (million dollars & thousand units)
- Table | Custom Cabinet Demand by Market, 2015, 2019, 2025, 2030, &2035 (million dollars & thousand units)
- Table | Custom Cabinet Demand by Box Construction, 2015, 2019, 2025, 2030, &2035 (million dollars & thousand
- Stock Cabinets
- Regions
- Demand by Region
- Table | Cabinet Demand by Region, 2015, 2019, 2025, 2030, &2035 (million dollars)
- Northeast
- Table | Northeast Cabinet Demand by Subregion, Market, &Type, 2015, 2019, 2025, 2030, &2035 (million dollars
- Table | New England Cabinet Demand by Market & Type, 2015, 2019, 2025, 2030, &2035 (million dollars)
- Table | Middle Atlantic Cabinet Demand by Market & Type, 2015, 2019, 2025, 2030, &2035 (million dollars)
- Midwest
- Table | Midwest Cabinet Demand by Subregion, Market, &Type, 2015, 2019, 2025, 2030, &2035 (million dollars)
- Table | East North Central Cabinet Demand by Market & Type, 2015, 2019, 2025, 2030, &2035 (million dollars)
- Table | West North Central Cabinet Demand by Market & Type, 2015, 2019, 2025, 2030, &2035 (million dollars)
- South
- Table | South Cabinet Demand by Subregion, Market, &Type, 2015, 2019, 2025, 2030, &2035 (million dollars)
- Table | South Atlantic Cabinet Demand by Market & Type, 2015, 2019, 2025, 2030, &2035 (million dollars)
- Table | East South Central Cabinet Demand by Market & Type, 2015, 2019, 2025, 2030, &2035 (million dollars)
- Table | West South Central Cabinet Demand by Market & Type, 2015, 2019, 2025, 2030, &2035 (million dollars)
- West
- Table | West Cabinet Demand by Subregion, Market, &Type, 2015, 2019, 2025, 2030, &2035 (million dollars)
- Table | Mountain Cabinet Demand by Market & Type, 2015, 2019, 2025, 2030, &2035 (million dollars)
- Table | Pacific Cabinet Demand by Market & Type, 2015, 2019, 2025, 2030, &2035 (million dollars)
- Demand by Region
- Market Share
- US Cabinets Market Share & Company Sales
- Table | US Cabinet Sales by Company, 2025 (million dollars)
- Figure 9-1. US Cabinet Market Share by Company, 2025 (billion dollars)
- US Cabinets Market Share & Company Sales
- Appendix
- Report Details & Scope
- Table | Relevant Industry Codes
- Table | Relevant HTS Codes
- Definitions
- General
- Products
- Markets
- Distribution Channels
- Abbreviations
- Table | Abbreviations & Acronyms Used in Study
- Freedonia Methodology
- A Comprehensive Approach to Data Analysis
- High-Quality, Industry-Leading Market Research
- Study-Specific Methodology
- Data Changes from Previous Version
- Sources
- Related Studies & Reports
- Freedonia Group US Studies
- Freedonia Group Global Studies
- Freedonia Focus Reports
- Knowledge Center
- Macroeconomic Assumptions
- Economic Environment
- Table | Macroeconomic Indicators, 2015, 2019, 2025, 2030, &2035 (billion 2017 dollars)
- Demographics
- Table | Population & Households, 2015, 2019, 2025, 2030, &2035 (million persons)
- Consumer Financing
- Table | Consumer Financing Environment, 2015 – 2025
- Consumer Spending
- Table | Personal Consumption Expenditures, 2015, 2019, 2025, 2030, &2035 (billion 2017 dollars)
- Building Construction
- Table | Building Construction Expenditures, 2015, 2019, 2025, 2030, &2035 (billion 2017 dollars & billion do
- Residential Building Construction
- Table | Residential Building Construction Expenditures, 2015, 2019, 2025, 2030, &2035 (billion 2017 dollars
- Residential Improvements & Repairs
- Table | Residential Improvement & Repair Expenditures, 2015, 2019, 2025, 2030, &2035 (billion 2017 dollars &
- Commercial Building Construction
- Table | Commercial Building Construction Expenditures, 2015, 2019, 2025, 2030, &2035 (billion 2017 dollars &
- Commercial Building Improvements & Repairs
- Table | Commercial Building Improvement & Repair Expenditures, 2015, 2019, 2025, 2030, &2035 (billion 2017 d
- Housing Completions
- Table | New Housing Indicators, 2015, 2019, 2025, 2030, &2035 (thousand units)
- Economic Environment
- Report Details & Scope
Above average demand gains are expected for the residential remodeling market for office, garage and laundry rooms.
Market size for cabinets is valued at $33 billion in 2024.
The leading cabinet companies for the US market include MasterBrand, Cabinetworks Group and American Woodmark.