US Green (Vegetative) Roofing
Demand for green (also called vegetative) roofing systems in the US is forecast to rise 7.7% per year to $586 million in 2028; demand in area terms is projected to reach 13.7 million square feet.
Free Sample Report
Request a free sample of this report and our team will email it to you.
Report Overview
Featuring 87 tables and 26 figures
-
Uncover the environmental and economic benefits, and innovative modular systems driving the future of sustainable roofing solutions.
Demand for green (also called vegetative) roofing systems in the US is forecast to rise 7.7% per year to $586 million in 2028; demand in area terms is projected to reach 13.7 million square feet. Market value growth is expected to outpace real demand as construction material prices continue to rise after surging during the pandemic. Overall economic inflation is trending downward, but construction materials have continued to grow since the start of 2024. As demand for sustainable products and green materials continues to increase, the prices for these types of goods and products will keep rising.
Real growth will be driven by greater construction of commercial buildings such as government offices, educational facilities, and hotels. Growth will also be supported by:
-
mandates and/or incentive programs – where they exist – that encourage installation of green roofs
-
the aesthetic appeal and recreational benefits of green space amenities
-
green roofing systems qualifying for LEED credits for buildings
However, the market will remain relatively small; this will be at least partially attributable to the relative scarcity of green roofing mandates or incentive programs throughout much of the country.
Washington DC & Denver Illustrate Role of Mandates & Incentives in Green Roofing Uptake
Since the cost of green roofing can dissuade building owners from installing these roofs, both mandates and financial incentives are necessary to encourage their uptake. In the Washington DC metro area, financial incentives have played a role in a notable number of buildings installing green roofing. These installations have been encouraged in part by the District RiverSmart Rooftops program, which offers rebates to builders for the voluntary set-up of green roofs.
Mandates also affect green roofing demand, with their imposition often bringing an increase in installations, and any subsequent revocation of or adjustment to them impacting sales. For instance, Denver instituted a green roof ordinance that stipulated that a percentage of new buildings over 25,000 square feet be dedicated to green roofing or solar panels, leading to a jump in green roofing sales. However, the city council eventually voted to repeal the law, revising the mandate to instead require cool roofing. Subsequent demand for green roofing slowed, as the cool roofing mandates could be met using other roofing materials.
Rising Commercial Building Construction Offers Opportunities, Although Restraints Remain
Demand for green roofing in new construction applications is forecast to rise after declining between 2018 and 2023. Construction of institutional, lodging, office, and government buildings fell or were stagnant in the previous period. While this will be a boon for green roofing suppliers, many building owners and managers will remain reluctant to invest in such large-scale (and generally optional) projects as green roofs, especially given higher costs for construction materials. This will in turn limit greater penetration of these products.
Historical Market Trends
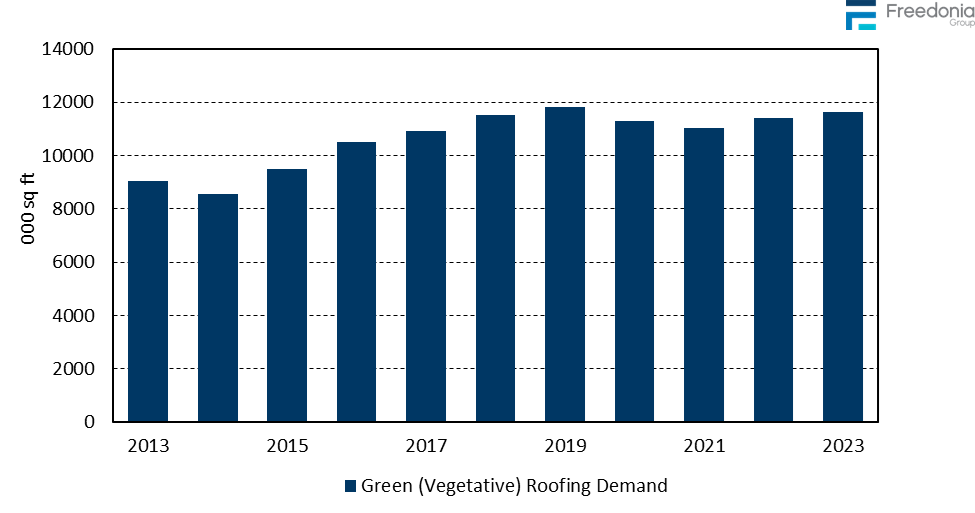
While accounting for a very small share of the US roofing industry, vegetative roofing has expanded quickly since its beginnings in the 1990s. Historically, the US has lagged Europe in green roofing policies and installations. Partially due to the market’s small size, material and installation costs in the US have remained considerably higher than in countries like France or Germany. Canada has also been a comparatively intensive installer of green roofs, implementing North America’s first green roofing mandate in 2009 in Toronto.
Nonetheless, demand in the US has expanded rapidly from a small base since the early 2000s, supported by:
-
media attention regarding sustainable building construction
-
the availability of incentives and financial support for green building infrastructure, including green roofs
-
numerous professional research projects and conferences dedicated to analyzing vegetative roof technologies and to spreading awareness about the benefits of green roofs
-
the passage of the Energy Independence and Security Act of 2007, requiring federal agencies to limit stormwater runoff from federal development projects
-
the implementation of stormwater retention standards and urban heat reduction programs in many US states and municipalities
-
the passage of the American Recovery and Reinvestment Act of 2009, which offered federal funds for green construction spending, including the installation of vegetative roofs on several institutional buildings
-
increased overall familiarity with vegetative roof technologies among building owners and installers
As in the larger roofing industry, shifts in demand for green roofing systems can vary from year to year. These are determined by several factors, including:
-
the number and types of buildings erected or repaired in any given year (green roofs are most installed on commercial buildings, such as offices and schools and multifamily residential buildings)
-
the type of roof (e.g., steep-slope or low-slope) installed on a structure, as low-slope roofs are better able to support the load weight of green roofing systems
-
interest rates being low, which can encourage home and business owners to take out lines of credit to fund roof repair and replacement projects
-
passage of legislation promoting installation of green roofing:
-
New York City’s 2019 Climate Mobilization Act requires newly constructed buildings to have green roofs
-
San Francisco’s 2019 Central SOMA Plan Living Roof and Solar Requirement mandates new buildings of a certain size to have at least 50% of roof space as green roof
-
Cambridge, Connecticut’s 2022 Green Roof Ordinance requires most newly constructed buildings over 25,000 sq ft to have a green roof and/or solar energy system
-
Market Drivers
Key Reasons to Install a Green Roof
Green roofs offer a range of benefits, both for the building owner and for the wider public and environment. For instance, vegetative roof systems offer a number of environmental benefits, including:
-
improved retention and filtration of stormwater
-
enhanced building insulation (i.e., limiting heat transfer)
-
contribution to improved air quality and biodiversity
A number of incentives – including tax and stormwater fee credits – are offered to promote the installation of green roofs for their environmental advantages. Funding for green infrastructure – including vegetative roofs – is also available in several states, helping reduce the upfront costs of these assemblies. Additional policies incentivizing green roof installations are under consideration. For instance, the Public School Green Rooftop Program Act was reintroduced to Congress in 2023; it would authorize grants for green roofs at public schools while providing additional funds for the maintenance of green roofs for up to five years.
Incentives and funding, rather than legislation, are expected to remain the primary market drivers for green roofing installations. Toronto was the first city in North America to issue a green roof mandate, which took effect in 2009. As of November 2024, mandates for green roofing in the US are limited to a few major cities, including New York City, San Francisco, and Portland, Oregon. In May 2021, Cambridge, Massachusetts, passed a mandate requiring that certain new buildings incorporate solar and/or green roof assemblies. Meanwhile, Denver’s green roof mandate was revised in October 2018 to require cool roofing instead of vegetative roofing.
Private financial incentives are also key drivers of the green roofing market. Building owners, especially in highly congested cities such as Chicago or New York City, can better attract tenants and charge higher rental fees for buildings with green space amenities. Vegetative roofs also contribute to an overall reduction in energy costs, especially for single-story buildings (e.g., warehouses or storage units), and they can help to improve roof longevity.
Air Quality & Biodiversity
Introducing greater biodiversity to urban and metropolitan areas is another key benefit of green roofing because it improves air quality.
Strong biodiversity – which features local insects and other wildlife in addition to a variety of native plants – facilitates robust plant growth. Plants reduce the amount of pollutants in the air around them and serve as carbon sinks by absorbing some of the carbon dioxide in the atmosphere. This helps mitigate the impact of pollutants and GHGs on air quality, ozone layer depletion, and climate change, among other environmental health considerations.
Urban and metropolitan areas tend to lack sufficient green space to support air-cleaning biodiversity, and green roofing represents one potential solution to that problem.
Scope
This study analyzes US demand for green (or vegetative) roofing by application, system type, component, and geographic region. Historical data (2013, 2018, and 2023) and forecasts for 2028 and 2033 are presented for green roofing demand in current US dollars (including inflation) and in square feet. Annual data from 2020 to 2027 is also presented.
Data are presented at the manufacturers’ level and exclude the value of mark-ups or installation. Demand also excludes the value of existing components (e.g., waterproof membrane, insulation) that are not replaced and installed as part of the new vegetative roof assembly. For roofs that are partially covered by vegetative roofing, only the area of green roof coverage is included in the scope of this study.
Other exclusions include rooftop container gardens, living walls and vegetative building façades, decorative rooftop elements (e.g., pavers, edging), and separately sold sprinkler systems.
Green roofs are segmented by application in terms of:
-
new construction
-
retrofit
Demand is segmented by system type in terms of:
-
extensive
-
semi-intensive
-
intensive
Green roof assemblies consist of a layer of vegetation planted over a waterproofing system that is installed directly on a (typically low-slope) roof. Demand in this study is segmented by the different layers typically found in a vegetative roof system, including:
-
vegetation
-
growing media
-
geotextiles and a drainage layer
-
insulation
-
waterproof membrane
- other components, such as built-in irrigation components, membrane protection boards, and edging that is not part of the drainage layer
- Executive Summary
- Figure 1-1. Green (Vegetative) Roofing Market Outlook
- About This Report
- Report Details
- Study Scope & Product Description
- Definitions & Features of Green Roofing
- Figure 2-1. Green Roofing System Design & Components
- Built-Up Versus Modular Assemblies
- Figure 2-2. Built-Up Versus Modular Green Roofing Assemblies
- Common Building Types Using Green Roofing
- Figure 2-3. Building Types for Green Roofs that Commonly Use Green Roofs
- Definitions & Features of Green Roofing
- Short-Term Green Roofing Trends
- Table | Green Roofing Demand, 2021 - 2025
- Figure 2-4. Green Roofing Volume Demand, 2021 - 2025
- Overview
- Historical Market Trends
- Table | Green Roofing Demand, 2013 - 2023
- Figure 3-1. Green Roofing Demand, 2013 - 2023
- Market Drivers
- Key Reasons to Install a Green Roof
- Stormwater Management
- Aesthetics & Green Space
- Urban Heat Island Mitigation & Energy Efficiency
- Air Quality & Biodiversity
- Other Benefits
- Demand Constraints
- Costs & Maintenance Requirements
- Structural Limitations
- Blue Roofs & Other Lower Cost Alternatives
- Lack of Incentives or Mandates
- System Types
- Demand by System Type
- Table | Green Roofing Demand by System Type, 2013, 2018, 2023, 2028, &2033
- Table | Annual Green Roofing Demand by System Type, 2020 - 2027
- Figure 3-2. Extensive Versus Intensive Green Roofing Systems
- Extensive Systems
- Table | Extensive Green Roofing System Demand by Application, 2013, 2018, 2023, 2028, &2033
- Table | Annual Extensive Green Roofing System Demand by Application, 2020 - 2027
- Figure 3-3. Extensive Green Roofing System Demand by Application, 2013, 2018, 2023, 2028, &2033
- Semi-Intensive
- Table | Semi-Intensive Green Roofing System Demand by Application, 2013, 2018, 2023, 2028, &2033
- Table | Annual Semi-Intensive Green Roofing System Demand by Application, 2020 - 2027
- Intensive
- Table | Intensive Green Roofing System Demand by Application, 2013, 2018, 2023, 2028, &2033
- Table | Annual Intensive Green Roofing System Demand by Application, 2020 - 2027
- Figure 3-4. Intensive Green Roofing System Demand by Application, 2013, 2018, 2023, 2028, &2033
- Demand by System Type
- New Construction Versus Retrofit Applications
- Table | Green Roofing Demand: New Construction vs. Retrofit, 2013, 2018, 2023, 2028, &2033
- Table | Green Roofing Demand: New Construction vs. Retrofit, 2020 - 2027
- Green Roofing Prices & Cost Benefits
- Table | Green Roofing Pricing by Product, 2013, 2018, 2023, 2028, &2033
- Table | Annual Green Roofing Pricing by Product, 2020 - 2027
- Figure 3-5. Average Green Roofing Prices, 2013, 2018, 2023, 2028, &2033
- Historical Market Trends
- Factors Impacting Roofing Demand
- Building Construction Activity
- Table | Building Construction Expenditures, 2013, 2018, 2023, 2028, &2033
- Regulatory Activity, Building Codes, &Incentives
- Regulations & Building Codes Overview
- Fire & Wind Resistance
- Structural Integrity: Roof Load & Root Penetration
- Impact of CALGreen Building Codes
- Incentives
- Table | Selected Green Roof Incentives by US State
- Sustainability Initiatives
- Recycling & Recycled Content
- Cool Roofing
- Energy Efficiency (LEED)
- Building Construction Activity
- Green Roofing System Components
- Green Roofing Demand by Component
- Table | Green Roofing Demand by Component, 2013, 2018, 2023, 2028, &2033
- Table | Annual Green Roofing Demand by Component, 2020 - 2027
- Figure 5-1. Green Roofing Demand by Component, 2013, 2018, 2023, 2028, &2033
- Vegetation
- Table | Green Roofing Vegetation Demand by System & Region, 2013, 2018, 2023, 2028, &2033
- Table | Annual Green Roofing Vegetation Demand by System & Region, 2020 - 2027
- Growing Media
- Table | Green Roofing Growing Media Demand by System & Region, 2013, 2018, 2023, 2028, &2033
- Table | Annual Green Roofing Growing Media Demand by System & Region, 2020 - 2027
- Geotextiles & Drainage Layer
- Table | Green Roofing Geotextile & Drainage Layer Demand by System & Region, 2013, 2018, 2023, 2028, &2033
- Table | Annual Green Roofing Geotextile & Drainage Layer Demand by System & Region, 2020 - 2027
- Insulation
- Table | Green Roofing Insulation Demand by System & Region, 2013, 2018, 2023, 2028, &2033
- Table | Green Roofing Insulation Demand by System & Region, 2020 - 2027
- Waterproof Membranes
- Table | Green Roofing Waterproof Membrane Demand by System & Region, 2013, 2018, 2023, 2028, &2033
- Table | Annual Green Roofing Waterproof Membrane Demand by System & Region, 2020 - 2027
- Other Components
- Table | Other Green Roofing Components Demand by System & Region, 2013, 2018, 2023, 2028, &2033
- Table | Other Green Roofing Components Demand by System & Region, 2020 - 2027
- Green Roofing Demand by Component
- Regional Trends
- Demand by Region
- Table | Green Roofing Demand by US Region, 2013, 2018, 2023, 2028, &2033
- Table | Annual Green Roofing Demand by US Region, 2020 - 2027
- Figure 6-1. Green Roofing Demand by US Region, 2013, 2018, 2023, 2028, &2033
- Figure 6-2. Key US Metropolitan Markets for Green Roofing
- Northeast
- Northeast: Key Demand Drivers & Outlook by Subregion
- Table | Northeast: Green Roofing Demand by Subregion & Application, 2013, 2018, 2023, 2028, &2033
- Table | Northeast: Annual Green Roofing Demand by Subregion & Application, 2020 - 2027
- Figure 6-3. Northeast: Green Roofing Market Position
- New England
- Table | New England: Green Roofing Demand by Component, 2013, 2018, 2023, 2028, &2033
- Table | New England: Annual Green Roofing Demand by Component, 2020 - 2027
- Table | New England: Selected Green Roofing Installation Projects
- Middle Atlantic
- Table | Middle Atlantic: Green Roofing Demand by Component, 2013, 2018, 2023, 2028, &2033
- Table | Middle Atlantic: Annual Green Roofing Demand by Component, 2020 - 2027
- Table | Middle Atlantic: Selected Green Roofing Installation Projects
- Northeast: Key Demand Drivers & Outlook by Subregion
- Midwest
- Midwest: Key Demand Drivers & Outlook by Subregion
- Table | Midwest: Green Roofing Demand by Subregion & Application, 2013, 2018, 2023, 2028, &2033
- Table | Midwest: Annual Green Roofing Demand by Subregion & Application, 2020 - 2027
- Figure 6-4. Midwest: Green Roofing Market Position
- East North Central
- Table | East North Central: Green Roofing Demand by Component, 2013, 2018, 2023, 2028, &2033
- Table | East North Central: Annual Green Roofing Demand by Component, 2020 - 2027
- Table | East North Central: Selected Green Roofing Installation Projects
- West North Central
- Table | West North Central: Green Roofing Demand by Component, 2013, 2018, 2023, 2028, &2033
- Table | West North Central: Annual Green Roofing Demand by Component, 2020 - 2027
- Table | West North Central: Selected Green Roofing Installation Projects
- Midwest: Key Demand Drivers & Outlook by Subregion
- South
- South: Key Drivers & Outlook by Subregion
- Table | South: Green Roofing Demand by Subregion & Application, 2013, 2018, 2023, 2028, &2033
- Table | South: Annual Green Roofing Demand by Subregion & Application, 2020 - 2027
- Figure 6-5. South: Green Roofing Market Position
- South Atlantic
- Table | South Atlantic: Green Roofing Demand by Component, 2013, 2018, 2023, 2028, &2033
- Table | South Atlantic: Annual Green Roofing Demand by Component, 2020 - 2027
- Table | South Atlantic: Selected Green Roofing Installation Projects
- East South Central
- Table | East South Central: Green Roofing Demand by Component, 2013, 2018, 2023, 2028, &2033
- Table | East South Central: Annual Green Roofing Demand by Component, 2020 - 2027
- Table | East South Central: Selected Green Roofing Installation Projects
- West South Central
- Table | West South Central: Green Roofing Demand by Component, 2013, 2018, 2023, 2028, &2033
- Table | West South Central: Annual Green Roofing Demand by Component, 2020 - 2027
- Table | West South Central: Selected Green Roofing Installation Projects
- South: Key Drivers & Outlook by Subregion
- West
- West: Key Demand Drivers & Outlook by Subregion
- Table | West: Green Roofing Demand by Subregion & Application, 2013, 2018, 2023, 2028, &2033
- Table | West: Annual Green Roofing Demand by Subregion & Application, 2020 - 2027
- Figure 6-6. West: Green Roofing Market Position
- Mountain
- Table | Mountain: Green Roofing Demand by Component, 2013, 2018, 2023, 2028, &2033
- Table | Mountain: Annual Green Roofing Demand by Component, 2020 - 2027
- Table | Mountain: Selected Green Roofing Installation Projects
- Pacific
- Table | Pacific: Green Roofing Demand by Component, 2013, 2018, 2023, 2028, &2033
- Table | Pacific: Annual Green Roofing Demand by Component, 2020 - 2027
- Table | Pacific: Selected Green Roofing Installation Projects
- West: Key Demand Drivers & Outlook by Subregion
- Canada Green Roofing Market
- Table | Canada: Green Roofing Demand, 2013, 2018, 2023, 2028, &2033
- Table | Canada: Annual Green Roofing Demand, 2020 - 2027
- Figure 6-7. Comparison of Canada & US Market Growth, 2013 - 2033
- Table | Canada: Selected Green Roofing Installation Projects
- Demand by Region
- Key Suppliers & Industry Structure
- Industry Composition
- Figure 7-1. Green Roofing Supply Chain
- Key Industry Participants
- Figure 7-2. Industry Participant Profile: American Hydrotech
- Figure 7-3. Industry Participant Profile: Garland
- Figure 7-4. Industry Participant Profile: Henry
- Figure 7-5. Industry Participant Profile: Holcim
- Figure 7-6. Industry Participant Profile: LiveRoof
- Figure 7-7. Industry Participant Profile: SOPREMA
- Figure 7-8. Industry Participant Profile: XeroFlor North America
- Mergers & Acquisitions
- Table | Selected Mergers & Acquisitions
- Cooperative Agreements
- Marketing Strategies
- Table | Key Marketing Strategies in the Green Roofing Industry
- Distribution Channels
- List of Industry Participants
- Table | Selected Industry Participants
- Industry Composition
- Appendix
- Scope
- Table | Study Scope: US Geographic Regions & Subregions
- Table | Relevant Industry Codes
- Table | Relevant HS Codes
- Definitions
- Freedonia Methodology
- Study-Specific Methodology
- Sources
- Associations & Agencies
- Related Studies & Reports
- Macroeconomic Assumptions
- Economic Environment
- Table | Macroeconomic Indicators, 2013, 2018, 2023, 2028, &2033
- Demographic Trends
- Table | Population & Households, 2013, 2018, 2023, 2028, &2033
- Consumer Spending
- Table | Personal Consumption Expenditures, 2013, 2018, 2023, 2028, &2033
- Consumer Financing
- Table | Consumer Financing Environment, 2013 - 2023
- Residential Building Construction
- Table | Residential Building Construction Expenditures, 2013, 2018, 2023, 2028, &2033
- Housing Starts
- Table | New Housing Indicators, 2013, 2018, 2023, 2028, &2033
- Housing Stock
- Table | Housing Stock by Type, 2013, 2018, 2023, 2028, &2033
- Residential Improvements & Repairs
- Table | Residential Improvement & Repair Expenditures, 2013, 2018, 2023, 2028, &2033
- Commercial Building Stock
- Table | Commercial Building Stock, 2013, 2018, 2023, 2028, &2033
- Commercial Building Construction
- Table | Commercial Building Construction Expenditures, 2013, 2018, 2023, 2028, &2033
- Commercial Building Improvements & Repairs
- Table | Commercial Building Improvement & Repair Expenditures, 2013, 2018, 2023, 2028, &2033
- Economic Environment
- Scope
Green, or vegetative, roofs consist of a layer of vegetation planted over a waterproofing system that is installed directly on a (typically low-slope) roof. Green roofs are installed for a variety of purposes.
The 2024 market size for green roofs is $101.2 million.
Top green roofing companies include American Hydrotech, Holcim, Garland, Henry, LiveRoof, SOPREMO and XeroFlor North America.