Report Overview
Get the important trends you need to know.
-
Focuses on low-slope which is valuable for plastic and rubber roofing manufacturers.
-
Energy efficiency is desired for lower costs and better ESG scores.
This Freedonia industry study analyzes the $6 billion US low-slope market for roofing.  It presents historical demand data (2011, 2016, and 2021) and forecasts (2026 and 2031) as well as annual data for the years 2018-2025. Unit demand and value demand data is shown for roofing by material (metal, bituminous, plastic, rubber), product type (standing seam, corrugated panel, modified bitumen, built-up roofing, thermoplastic polyolefin, polyvinyl chloride, ethylene-propylene, neoprene, butyl, spray polyurethane foam, liquid-applied roofing, tensioned fabric, vegetative roofing) and market (new and reroofing demand in both residential and commercial buildings). The study also evaluates company market share and competitive analysis on industry competitors including GAF, Carlisle Construction Materials, Holcim(Elevate), and Johns Manville.
Featuring 210 tables and 42 figures – available in Excel and Powerpoint! Learn More
This report includes data from 2011-2031 in 5 year intervals and tables featuring year-by-year data for 2018-2025.
US demand for low-slope roofing is forecast to decline nearly 1.0% per year from a high 2021 base to 78 million squares in 2026. Gains will be restrained by the elevated levels of reroofing activity in 2020 and 2021 that resulted from several severe weather events and building renovations that were encouraged by tax provisions and financial aid from the federal government. While market value for roofing will also be affected by declining demand in area terms, some growth will occur due to:
- prices remaining elevated for most products following the inflation- and supply chain-related spikes of 2021 and 2022
- an ongoing shift toward more durable roofing products, which are higher value than traditional materials
Durability Driving Adoption of TPO & Metal Standing Seam Roofing
While demand for bituminous roofing – the most commonly installed type of low-slope roofing – is expected to decline going forward, some better-performing roofing materials are expected to see gains despite their higher cost:
- Thermoplastic polyolefin (TPO) roofing has gained popularity in the low-slope market and is anticipated to be the leading product by 2026, driven by its durability, ease of installation, and its ability to meet cool roofing criteria.
- Standing seam roofing will also see growth, as it can withstand punctures and wind uplift while also solving the issue of leaks from fastener failures by concealing fasteners in the roof system.
Energy Efficiency Bolsters Demand for Small Volume Roofing Products
Although they will continue to account for a small share of low-slope roofing demand, a variety of small volume roofing products will see increasing use because of growing interest in environmentally friendly roofing materials that reduce a structure’s energy consumption. Use of vegetative roofing, light-colored liquid-applied roofing coatings, and spray polyurethane foam (SPF) can minimize heat transfer and lower utility bills – important characteristics for contractors, designers, and property managers alike. In addition, demand for vegetative roofing will be bolstered by legislation and funding projects in major metropolitan areas that promote the use of this roofing to reduce heat island effects in urban cores.
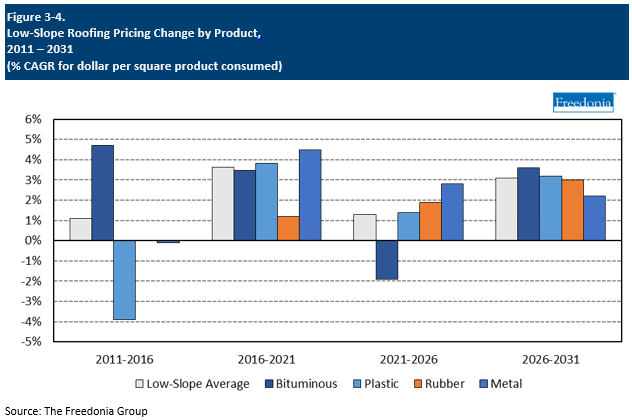
Pricing Trends
The per-square price of low-slope roofing – excluding installation costs – is expected to advance 1.3% annually to $82.81 in 2026. In 2022, pricing continued to be affected by the significant supply chain issues – mostly related to the shipping of goods – that plagued numerous industries. Product shortages and higher raw material costs continued to send roofing product prices upward, especially those that required crude oil (prices of which have increased). However, many of these issues are expected to ease in 2023, and pricing should begin to normalize.
Price growth for low-slope roofing through the rest of the forecast period will be supported by such factors as:
- an increase in petroleum and natural gas prices
- increasing sales of more durable materials – such as plastic membranes with thicker scrims – that are more costly to manufacture
Tariffs also affect related accessories used by contractors when installing roofing materials. Metal fasteners (such as nails and staples), which are used in the mechanical installation of many products, are subject to tariffs if they are purchased from Chinese suppliers, while lumber – often used as a substrate when repairing older roof decks – is subject to import duties if it is sourced from Canadian suppliers.
However, the overall effects of these tariffs on the US low-slope roofing market have been somewhat muted. In most of the affected product categories, there are numerous domestic raw materials suppliers that are able to provide US firms with needed supplies. For instance, the US has many producers of steel sheet (used to fabricate metal roofing) and plastic resins (used to make plastic roofing membranes). Manufacturers should have little difficulty finding alternative raw material suppliers.
Factors expected to limit price growth in low-slope roofing include manufacturer initiatives to incorporate less costly recycled materials.
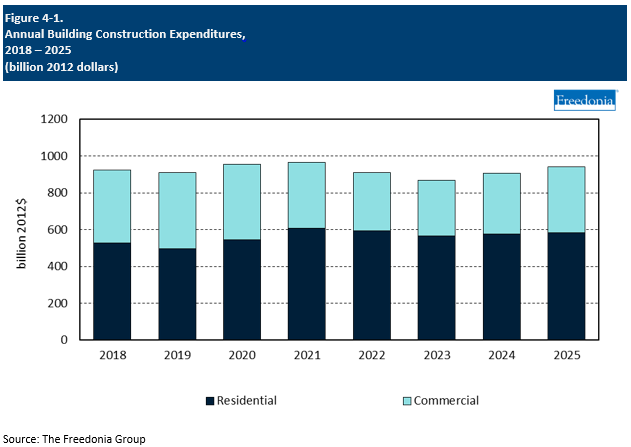
Building Construction Activity
A key factor affecting demand for roofing is the health and composition of the US construction industry. Roofing is installed on virtually every structure erected to keep out the elements, and can play an important role in improving a building’s energy efficiency. While the choice of roofing materials can vary due to a number of factors, structures are seldom installed without a roof.
Real building construction expenditures are expected to increase 0.2% per year through 2026, a significant deceleration from the 2016-2021 period:
- Residential building construction is expected to decline due to elevated interest rates and high material and labor costs and existing homeowners having already invested in their residences.
- Commercial building construction is anticipated to rebound from the pandemic-induced declines of the 2016-2021 period, thereby supporting the construction of manufacturing and warehouse facilities and office, retail, and lodging sites.