Report Overview
Featuring 46 tables and 27 figures – now available in Excel and Powerpoint! Learn More

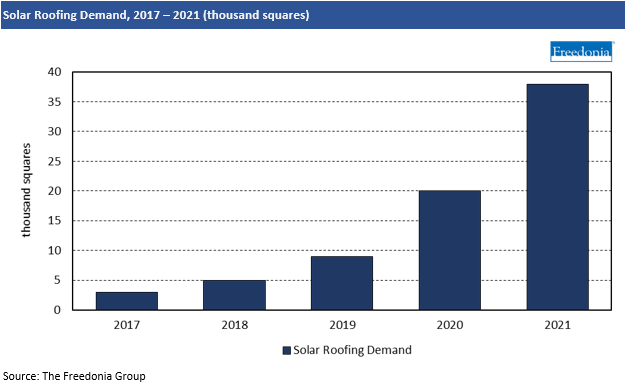
The market for solar roofing products in the US is forecast to increase rapidly to 716,000 squares, valued at $965 million in 2025. The expanding impact of solar-friendly policies in a growing number of states and localities nationwide will be a key driver of growth, particularly in the large California market, where revisions to the state building code will mandate almost all new buildings to install solar products starting in 2023.
Other factors supporting long-term growth for solar roofing products include:
- rising awareness of the energy-efficiency benefits of solar roofing systems
- the attractive appearance of solar roofing compared to traditional solar arrays (e.g., solar roofing resembles traditional roofing materials)
- the growing availability, affordability, and accessibility of solar roofing products (e.g., Tesla expanded solar roof installations nationwide in 2021)
- expansion of local, state, and federal incentives (e.g., tax credits, net metering benefits, rebates) to install solar roofing products
California Mandates Mark Major Victory for Solar Roofing Industry
California further advanced its lead in the national solar roofing market with the passage of two mandates in 2020 and 2021 requiring nearly all new residential and commercial buildings in the state to include solar products starting in 2023. While such mandates have been passed before in cities such as San Francisco and South Miami, Florida, this marks the first such mandate in the country to be adopted at the state level. In addition to significantly increasing solar roofing sales in the state, the California mandates are expected to influence other states to pass legislation promoting solar installations. Environment America, the organization that helped drive the California mandates, plans to launch similar campaigns in 10 additional states in 2022.
Rapid Growth Projected for South Due to Favorable Climate & Expanding Incentives
The South is expected to experience triple-digit growth through 2025 and will surpass the Northeast as the second leading regional market for solar roofing, accounting for 7% of sales. Advances will be supported by the region’s sunnier (and thus more favorable) climate for solar-electric generation and the growing availability of incentives in states – particularly Delaware, Maryland, Florida, and the Carolinas – as well as localities (e.g., Austin, Texas; New Orleans, Louisiana).
Climate Actions Plans Boost Solar Installations, Even in Less Sunny States
Solar energy is expected to account for 6% of total US electricity generation in 2030. While most reliable and cost-effective in areas with abundant sunshine (e.g., Arizona, California, Florida), solar-electric generation is also increasing as a renewable supplement to fossil fuels in the Northeast and Midwest, where a growing number of states and localities offer incentives to install solar products to increase their mix of renewable energy sources. As more property owners become aware of the benefits of installing solar products – including increased property values, improved energy efficiency, and tax credits, rebates, and other incentives – penetration of solar roofing will increase in both commercial and residential roofing markets.

Markets (Residential & Commercial)
The residential market accounted for the larger share of solar roofing demand in 2020 with 90% of the total. This is not surprising, given that solar roofing products are suitable for installation on the steep-slope roofs common on US single-family homes.
Additionally, solar roofing products are often marketed based on their greater aesthetic value compared to other solar products, namely their ability to blend in with other common roofing materials installed on US residences, such as asphalt shingles and roofing tiles. For many consumers, this justifies the higher cost of solar roofing products.
In contrast, commercial buildings that do install solar products are more likely to specify ground-mounted solar arrays, not only because aesthetics are generally less important in the nonresidential market, but also because the membrane-based roofing systems many commercial buildings employ are often not compatible with solar roofing.
Through 2025, residential solar roofing demand is forecast to rise to 680,000 squares valued at $917 million. The pace of growth will slow somewhat over the longer term, although residential roofing demand in 2030 will be exponentially higher than the 2020 level. Gains will be boosted by:
- the efforts of state and local governments – especially in those parts of the country that receive substantial sunshine – to amend building codes to require the use of solar products on new and refurbished residences
- rising homeowner interest in installing solar products to co-generate electricity and reduce utility bills
- state governments passing “net metering” and “net billing” legislation that allows homeowners with installed solar products to re-sell electricity to public utilities at favorable rates
Commercial and industrial solar roofing demand is forecast to increase to 36,000 squares valued at $48 million in 2025. Growth will be supported by:
- builders installing solar products to meet the zero net energy guidelines of the CALGreen building codes – which will become mandatory for commercial structures in California in 2030
- growing number of government mandates and incentive programs at the state and local levels promoting installation of solar roofing and/or green roofing assemblies, such as New York City’s 2019 Climate Mobilization Act
- interest in installing solar products to reduce utility bills
This study analyzes the US market for solar roofing, which is defined as those products that serve as a structure’s primary roofing material while also producing solar-generated electricity. This study considers both solar roofing products equipped with photovoltaic (PV) modules and those roofing products on the same structure that do not feature those components. Solar roofing products covered by the study include those that resemble asphalt shingles, roofing tiles, and slate roofing.
The study also looks at demand in terms of the electricity generated by those products with PV modules, with electricity generation discussed in terms of kilowatt-hours (kWh). The cost of solar roofing products and their installation costs are also measured in both squares and kWh.
Historical data for 2020 and forecasts for 2025 and 2030 are presented for national demand in value, area, and roof-mount electricity generation (which includes both solar panels and solar roofing), and for regional demand in squares.
Demand for solar roofing is presented at the end user level in value terms (US dollars) and in area terms (squares) by applications (new and reroofing), market (residential and commercial).