Report Overview
 What material has continued to gain share?
-
Metal roofing due to its performance and aesthetics
This study analyzes US residential roofing demand by product, application (new vs. reroofing), market, slope (steep-slope vs. low slope), US geographic region, and in the case of bituminous roofing, consumption by product type (polymer-modified bituminous membranes vs. standard roofing felts) and consumption by backing material (fiberglass-backed vs. organic backed).Demand is provided in both area terms (squares) and value terms (US dollars). Historical data (2012, 2017, and 2022) and forecasts for 2027 and 2032 are presented for US roofing demand in squares and US dollars. The study also evaluates company market share and competitive analysis on industry competitors including GAF, Owens Corning, and CertainTeed.
Featuring 87 tables and 36 figures – available in Excel and Powerpoint! Learn More
US residential roofing demand in area terms is projected to increase slightly from an elevated 2022 base to 181.3 million squares in 2027. Growth in area terms will be restrained primarily by a decline in conventional housing starts – following significant increases in 2020 and 2021 – that began in 2022 and is expected to continue through 2024, with sluggish growth thereafter. A slowdown in residential reroofing activity after a surge in 2020 and 2021 will also depress growth.
Demand in value terms is expected to rise 1.9% annually to $15.2 billion. This growth rate represents a significant deceleration from the 2017-2022 period, as most roofing product prices will moderate following price spikes in 2021 and 2022 that resulted from supply chain issues and high raw material costs.
Metal Roofing’s Durability, Strength, & Sustainability Boost Usage with Residential Buildings
Metal roofing has steadily gained share in the US residential roofing market over the past decade thanks to both good performance and aesthetics. This product’s share of the market will continue to rise due to several factors, including:
-
homeowners, insurers, and contractors in the South increasingly specifying metal roofing to minimize roof damage due to severe weather events
-
the fact that it is structurally sufficient to support the weight of solar panel installations, which will boost demand as interest in solar products grows in some parts of the country
-
its sustainability (metal roofing materials can be made from recycled metals) and energy efficiency (metal reflects rather than absorbs heat, stopping extra heat from entering)
The South will Account for Most Residential Roofing Gains
Out of the four US regions, the South is the only region forecast to approach single-digit growth in residential roofing demand due to:
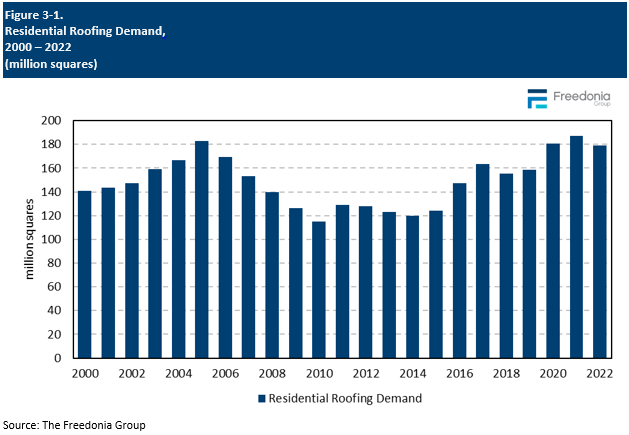
Historical Market Trends
Shifts in demand for residential roofing can vary from year to year and are determined by numerous factors, primarily those related to building construction activity. They include:
-
levels of housing starts, particularly in the single-family housing segment
-
the size and age of the US housing stock
-
interest rates – low interest rates may encourage homeowners to take out lines of credit often used to fund roof repair and replacement projects
-
the type of roof (e.g., steep-slope or low-slope) installed on a structure that will be repaired or replaced
-
the types of roofing materials most often specified by contractors and other consumers in a particular region of the US
-
the roofing materials originally installed on the structure
The US has a significant number of homes with roofs that are at or near the end of their life expectancies. Thus, age-related reroofing is the most significant driver of roofing demand in the US.
Additionally, multiple other variables can affect demand for residential roofing in a particular year or over a short period of time. Among these are:
-
weather conditions, especially outbreaks of severe weather that can cause widespread damage to roofs (e.g., hurricanes and tropical storms, tornadoes, hailstorms, and winter storms)
-
changes and modifications to state and local building codes
-
the adoption of legislation (such as the Tax Cuts and Jobs Act of 2017) that can cause a temporary increase in reroofing activity
-
insurers requiring homeowners to replace older or worn roofs with newer materials that better resist severe weather on condition of maintaining coverage
-
changes in the price of raw materials (e.g., asphalt, metal, lumber) that can cause the per-square cost of roofing materials to increase or decrease sharply
Residential roofing demand advanced rapidly in 2020, a marked contrast to the weaker demand levels of 2018 and 2019. This growth was spurred by multiple outbreaks of severe weather across the US and an increase in residential roofing demand precipitated by the COVID-19 pandemic. Levels increased again in 2021 despite continued restraint from supply chain issues and increased inflation. Roofing demand in volume terms declined in 2022 due to a loss in housing starts, but market value continued to exhibit growth because of continuing inflation and supply chain disruptions.
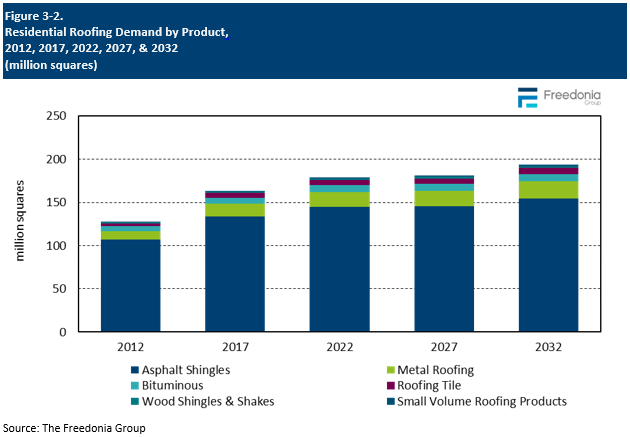
Products Overview
Area Demand
Area demand for residential roofing is forecast to rise minimally through 2027 to 181.3 million squares, a deceleration from the 2017-2022 period:
-
Conventional housing starts will decline from 2022 to 2024 following significant increases in 2020 and 2021. However, housing starts will remain above pre-pandemic levels, sustaining elevated roofing demand in new applications.
-
Storm-related roof repair and replacement projects surged in 2020, partly because of multiple severe weather events; these roofs will generally not require additional work in the near term.
Baseline reroofing will continue to support the market, as the US has a large number of homes with roofs at or near the end of their expected lifespan.
Asphalt shingles will continue to account for the largest share of residential roofing demand. However, a number of other roofing products will perform better in residential applications going forward:
-
Metal roofing will see rising use due to the increasing importance of roofing materials that are highly resistant to damage caused by high winds and elemental exposure.
-
Solar roofing will see strong gains from a small base as homeowners and homebuilders (especially in California) install these materials because of their ability to cogenerate electricity.
Steep-slope products will continue to account for the overwhelming majority of residential roofing demand.
Low-slope roofing materials see minimal use in this segment, as most residences feature steep-slope roofs. Residences with low-slope roofing include:
-
high-rise apartment and condominium complexes located in urban cores
-
manufactured housing units
-
carports, sheds, and garages
Pricing Trends
Residential roofing product price levels differ greatly due to the large number of products used as roofing materials and their varying raw material and production costs. Factors impacting the price of roofing products in general include:
-
the price of key raw materials (e.g., asphalt, metal, plastic resins, lumber)
-
costs related to the production of roofing materials (manufacturing equipment, energy)
-
transportation and distribution expenses related to delivering finished products to distributors
-
labor – many industries have difficulties in finding trained skilled workers to operate and maintain production equipment
The average price of residential roofing products is forecast to increase at an average rate of 1.8% per year through 2027, a significant deceleration from the 2017-2022 period. Pricing in the latter part of that period was affected by significant supply chain issues that plagued numerous industries, with product shortages and higher raw material costs pitching prices upward, especially for those items that require crude oil.
Residential roofing product pricing started to moderate in 2023 as inflationary pressures lessened and conventional housing starts declined. Prices are forecast to further decline in 2024 as normalization continues. Value growth in the latter part of the forecast period will largely result from increasing use of higher-value products. Manufacturers will offer more costly products that look and perform better than conventional options. These generally use raw materials more intensively, boosting their per-square prices. Examples include:
-
laminated asphalt shingles that have multiple layers of fiberglass matting and asphalt
-
standing seam metal roofing with corrosion-resistant compounds
-
polymer-modified bituminous membranes
-
plastic and rubber roofing membranes with thicker backings that enhance puncture and tear resistance
-
solar roofing with integrated photovoltaic modules (to cogenerate electricity)
In addition, price growth will be supported by suppliers who are unlikely to reduce prices to their pre-pandemic levels despite the easing of inflationary pressures.
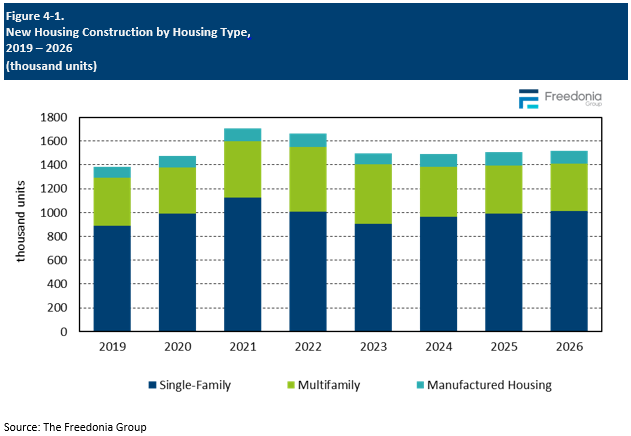
New Housing Construction Trends
A key factor affecting demand for residential roofing is the health and composition of the US construction industry, in particular, new housing construction. Demand stemming from the new residential sector made up 21% of overall residential roofing demand in 2022, with single-family construction accounting for most new demand (88% in 2022).
Conventional housing starts are forecast to decline at an annual average rate of 1.8% through 2027. Elevated interest rates and high material and labor costs will discourage home buyers and inhibit growth in residential construction. While single-family housing starts are projected to grow at an annual average rate of 0.7% through 2027, multifamily starts will fall precipitously, declining by 7.0%.