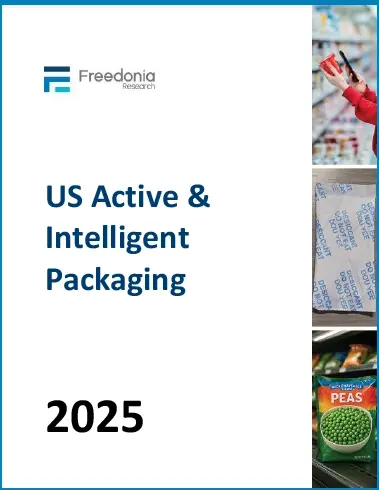
US Active & Intelligent Packaging
Analyzes the $6 billion active and intelligent packaging industry, presenting both historical sales data (2014, 2019, and 2024) and forecasts (2029 and 2034) by packaging type and market.
Free Sample Report
Request a free sample of this report and our team will email it to you.
Report Overview
Digitalization, smartphone reliance, price inflation, and the growing importance of supply chain logistics shake up the active and intelligent packaging market
Key Themes Covered in this report:
- The balance between cost and performance regarding the use of these technologies
- Product innovation efforts by producers and end users to reduce loss and improve user experience
- The heavy impact strong growth in IoT technology and ubiquity of smartphones have on intelligent packaging demand
Featuring 58 tables and 38 figures!
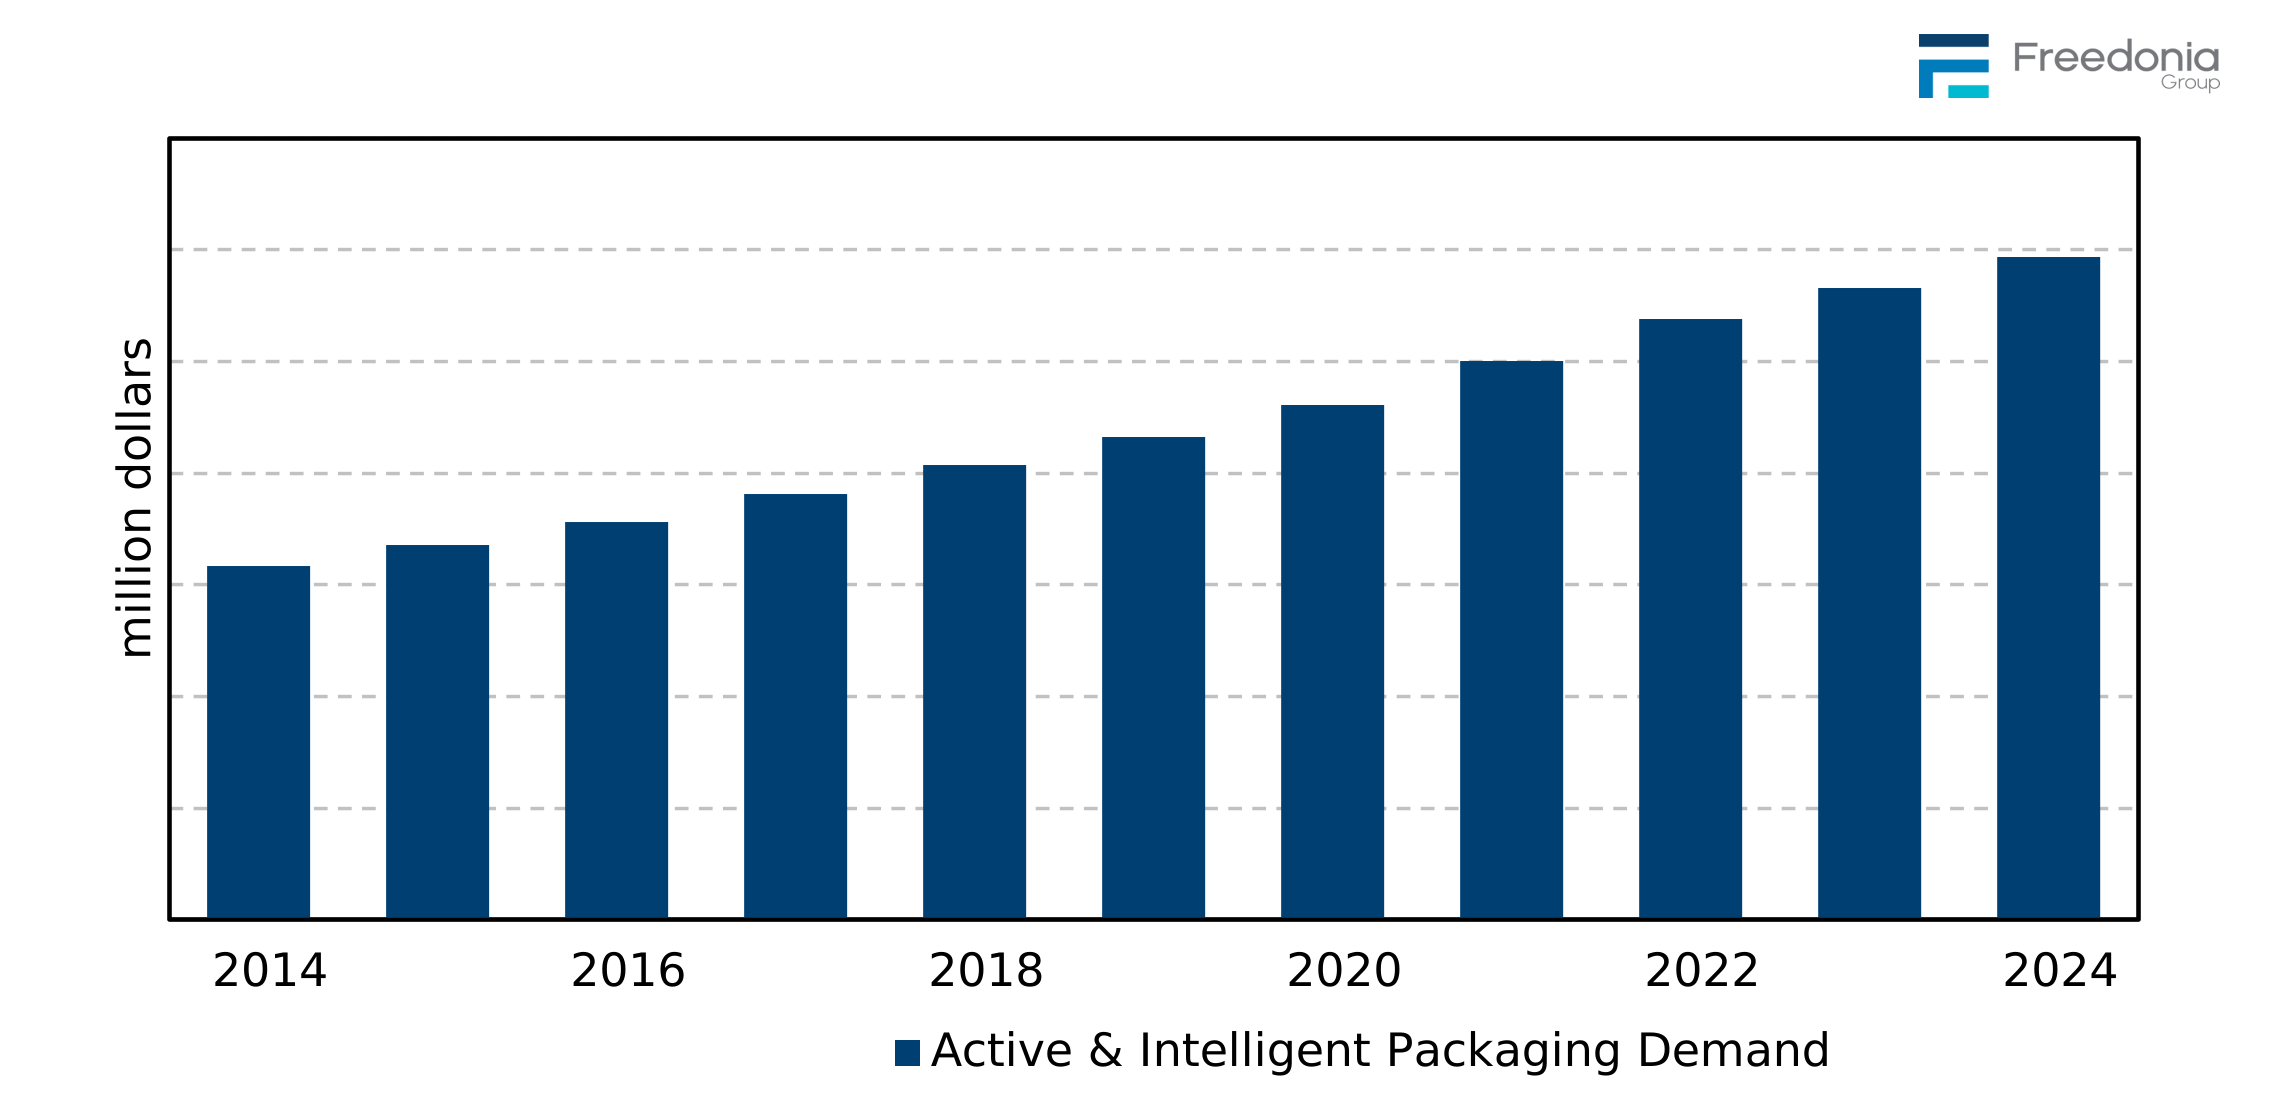
The active and intelligent packaging market totaled $5.9 billion in 2024, and is expected to grow 4.9% per year to $7.5 billion in 2029, reflecting a variety of trends:
- Ongoing digitalization of supply chains and rising consumer expectations for product authenticity, transparency, and freshness will drive strong growth in traceability systems and time-temperature indicators.
- Integration of smartphone-interactive features in pharmaceutical and consumer goods packaging will continue to expand to improve user experience and boost consumer engagement.
- New developments in targeted products – such as antimicrobial and flavor and fragrance control active packaging – will experience healthy growth, driven by heightened consumer sensitivity to product safety and the food industry's efforts to reduce use of preservatives.
- More mature forms of active packaging – such as susceptors or corrosion control packaging – will experience below average growth due to sustainability concerns or weak prospects in associated end use industries.
Consumer Engagement & Experience Drive Interactive Packaging Adoption
The proliferation of smartphone-enabled interactive packaging is transforming how brands connect with consumers, utilizing QR codes to not only give consumers access to product information, usage instructions, product authentication, and promotions, but also leveraging more sophisticated engagement tools such as augmented reality features to deliver personalized content. This trend is particularly evident in premium food, beverage, and beauty categories where brands seek differentiation and deeper customer relationships. As implementation costs decrease and consumer familiarity grows, these technologies are expanding into mainstream product categories with grocery retailers incorporating intelligent packaging features into private label lines.
Extended Shelf-Life Technologies Gain Traction Amid Food Waste Concerns
Active packaging solutions designed to extend product shelf life are experiencing continued adoption as food manufacturers and retailers intensify efforts to reduce waste throughout the supply chain. Gas scavengers and moisture control systems have become standard features in packaging for perishable foods, while antimicrobial and flavor and fragrance control packaging continue to penetrate the food market. This growth is fueled by heightened consumer awareness of food waste issues, retailer sustainability commitments, and cost pressures encouraging longer distribution cycles. Market leaders have developed new systems that extend shelf life and visibly indicate product freshness to consumers.
Supply Chain Visibility Demands Propel Traceability Systems
Comprehensive traceability solutions incorporating blockchain technology and environmental sensors are experiencing substantial growth as supply chain resilience becomes a strategic priority across industries, with the food, electronics, and luxury goods markets rapidly implementing such systems. These integrated solutions provide real-time location tracking, condition monitoring, and authentication capabilities throughout product journeys, mitigating product loss via theft or tampering. Growth will be further accelerated by increasing consumer expectations for transparency, particularly regarding product origins, handling conditions, and sustainability claims.
Historical Market Trends & Growth Factors
Active and intelligent packaging are specific types of packaging with added performance benefits. At the most basic level the use of these products is impacted by the same factors that determine demand for packaging overall including primarily the volume and type of packaged goods produced in any year.
However, the decision by end users to upgrade to active and intelligent packaging involves a more complex mix of consumer expectations, technological advancements, regulatory requirements, and end user needs. Growth is driven by demand for freshness, safety, traceability, and consumer transparency. Specific factors that impact the move to this specialty packaging include:
-
consumer concern about food safety, freshness, and quality assurance
-
growth in e-commerce and the need for supply chain transparency – the shipment of perishable and temperature-sensitive products requires packaging that monitors temperature, humidity, and handling conditions
-
growth in the pharmaceutical and healthcare industries, which require higher performing packaging solutions that can monitor or preserve drug stability, temperature, or dosage compliance
-
food safety and regulatory standards
-
more stringent regulatory frameworks like the FDA’s Food Safety Modernization Act encourage the adoption of active and intelligent packaging for better tracking and control over food quality and safety
-
regulations also push companies toward more advanced packaging to meet compliance standards, particularly in export-heavy markets
-
-
popularity of ready-to-eat and convenience foods, which increase demand for packaging that ensures product freshness during extended shelf lives and provides information on freshness and spoilage for perishable items
-
sustainability initiatives, including efforts to reduce food waste by extending shelf life, and increased use of data to manage inventory and reduce unnecessary production
-
technological advancements in materials science, miniaturized sensors, and IoT-enabled tracking that make active and intelligent packaging more widely accessible
-
cost control programs emphasizing improvements in scalability to make these technologies viable for larger consumer markets, including lower-margin sectors like fresh produce and lower-priced pharmaceuticals
-
product differentiation and brand value – offering active and intelligent packaging options differentiates companies from their competitors while the use of smart-phone enabled and interactive packaging elements can increase customer engagement
Product Trends
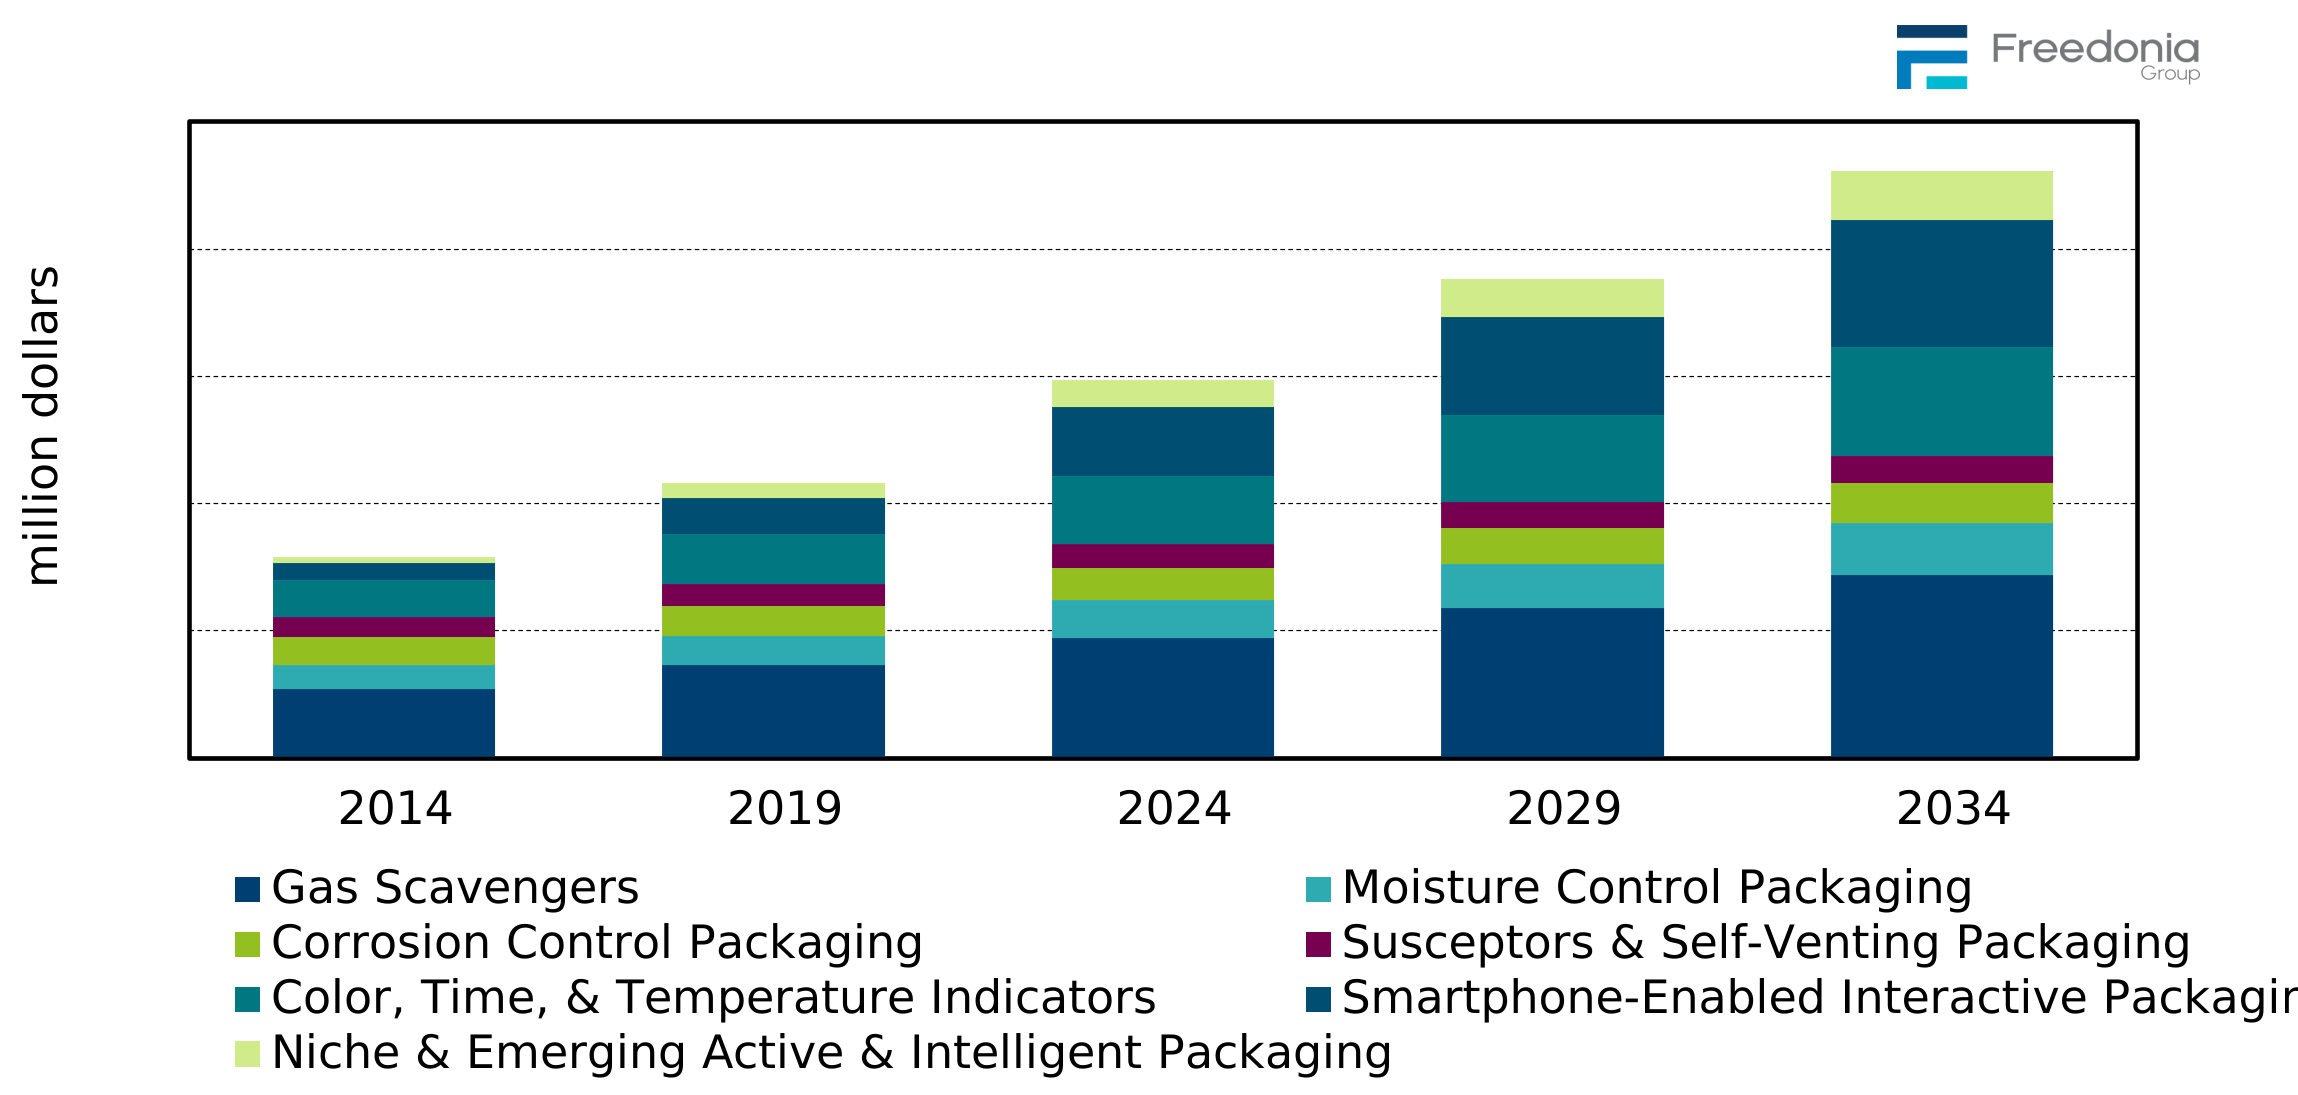
Demand for active and intelligent packaging is forecast to expand 4.9% annually to $7.5 billion in 2029, fueled by healthy gains for gas scavengers, time-temperature indicators, color indicating packaging, and smartphone-enabled interactive packaging products, as well as a variety of niche products that will see rapidly expanding demand from a small base.
Though generally perceived as an emerging area of the packaging industry, this market encompasses a number of well-established packaging products, such as moisture control pads, oxygen scavenger sachets, susceptors for microwaveable foods, and volatile corrosion inhibitor (VCI) packaging. Several other product types have been available for the past decade or more but remain specialty items due to costs, regulatory hurdles in direct food contact uses, and the fact that the products are considered nonessential.
Newer products within active and intelligent packaging include compliance monitoring packaging for pharmaceuticals, certain types of traceability systems – such as those utilizing blockchain technology – and more advanced version of other active and intelligent packaging products. These products will see rapid growth, primarily due to the development of more cost-efficient manufacturing processes.
Intelligent packaging demand will see rapid gains, propelled by the development of technologies that provide increased functionality and are cost competitive.
-
The proliferation of mobile devices, paired with growing interest in capturing consumer interest through social and viral marketing campaigns, will drive growth for smartphone-enabled interactive packaging products which can provide a more personal link between consumers and producers.
-
Above average real gains for time-temperature indicator (TTI) labels will be driven by the development of technology which allows advanced labels to be printed at a lower cost, as well as by federal requirements to trace pharmaceuticals and fresh food through the supply chain.
-
Color indicating packaging, which employs thermochromic or photochromic inks to convey information, will remain among the leading intelligent packaging types due to its established use in beer packaging.
Active packaging demand is expected to advance more slowly than that of intelligent packaging due to the presence of more mature product types, such as moisture control pads for meat, poultry, and seafood; susceptor packaging for microwave popcorn and frozen meals; and corrosion control packaging:
-
Healthy gains are expected for gas scavenger products, which will continue to lead the market in demand, with growth supported by expanded applications for oxygen scavengers in food, beverage, and pharmaceutical packaging.
-
Ongoing technological innovations will support above average annual gains in smaller types of active packaging, such as antimicrobial packaging, flavor and fragrance control packaging, and packaging which uses lenticular technology.
-
Self-venting packaging has achieved a mainstream presence in the frozen food market, further boosting gains.
Markets Overview
The emergence of active and intelligent packaging products that offer a combination of functionality and cost competitiveness will provide expanded opportunities in food, beverage, pharmaceutical, and other packaged goods markets. This packaging can:
-
extend shelf life
-
overcome barrier limitations of container resins
-
monitor and record temperature during shipping and storage
-
facilitate traceability
-
provide visual status indicators
-
track patient compliance
-
broaden interaction between brand owners and consumers
Advances in the food and pharmaceutical markets will be especially indicative of increasing pressures to make these products safer and to regulate their storage and distribution to make product recalls more efficient.
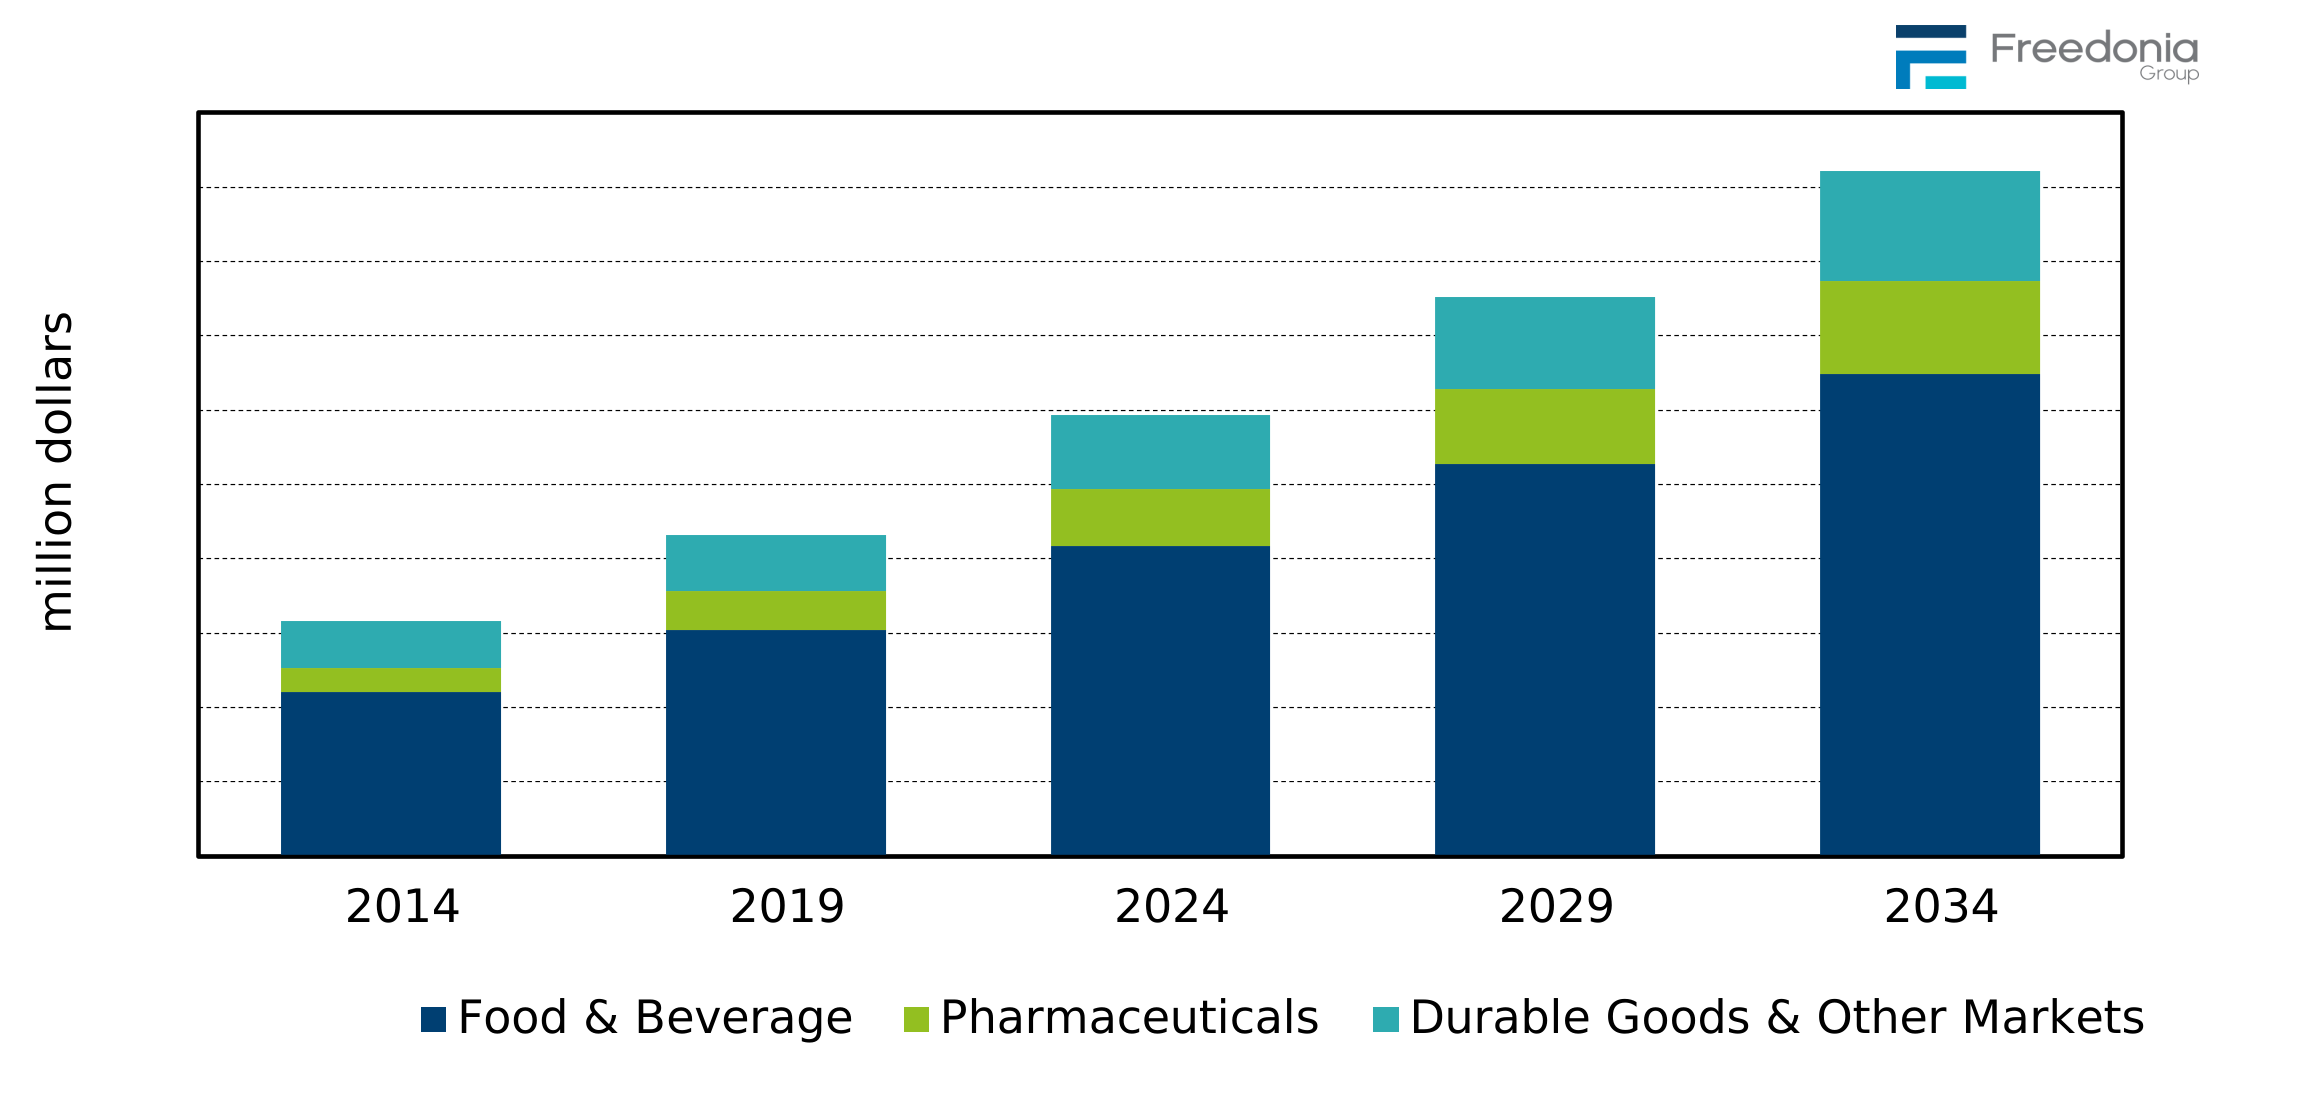
Active and intelligent packaging markets are projected to increase 4.9% per year to over $7.5 billion in 2029. Food and beverages were the two largest markets for active and intelligent packaging in 2024.
Factors driving strong growth in the food market include:
-
heightened requirements for longer shelf life for processed foods and packaged fresh foods as well as the growing importance of packaging in increasing food safety
-
the continued popularity of organic and minimally processed foods which use barrier packaging to substitute for the shelf-life extending properties usually contained in food additives
-
the entrenched position of key active packaging items such as moisture control pads and gas scavengers, which will continue to support demand as they serve an important role in maintaining food safety and preserving shelf life
Beverage applications for active and intelligent packaging are expected to see favorable growth, but further gains will be restrained by:
-
maturity of the beer market (which primarily impacts growth in color-indicating packaging)
-
market saturation of in-bottle oxygen scavenger systems in non-alcoholic beverages
-
the proliferation of products which are marketed as more natural or locally produced, which leads to less demand for luxury features such as electronic tags.
On the other hand, intelligent packaging types such as color indicating features, smartphone-enabled barcodes, and time-temperature indicators will become increasingly prevalent on beverage containers and labels as these products become more cost efficient and larger brands seek to regain market share.
Pharmaceuticals will be the fastest growing market for active and intelligent packaging.
Other markets for active and intelligent packaging include industrial machinery, military equipment and supplies, diagnostic and medical equipment, aerospace products, cosmetics and toiletries, cut flowers, metal packaging, and various consumer goods.
US Active & Intelligent Packaging Report Details
| Current Total Market Size | $6 billion |
| Forecast Total Market Growth Rate | 4.9% CAGR from 2024-2029 |
| Historical Period | 2014-2024 |
| Forecast Period | 2024-2034 |
| Units Covered | Revenue in million USD (inflation-adjusted) and billion units |
| Products | Gas Scavengers; Corrosion Control Packaging; Moisture Control Packaging; Susceptors & Self-Venting Packaging; Color, Time, & Temperature Indicators; Smartphone-Enabled Packaging; Niche or Emerging Packaging |
| Markets | Food & Beverage; Pharmaceuticals; Durable Good & Other Markets |
| Point Where Data is Measured | Manufacturer’s Level |
| Additional Elements | Market Share in Total and by Product, Near Term Trend Analysis, Regulatory Trends, Mergers & Acquisitions, Cooperative Agreements |
Key Industry Participants Driving Trends
| Amcor | Mitusbishi Gas Chemical |
| Aptar Group | Multisorb Filtration Group |
| Carrier Global | Novipax |
| Cortec | Plastipak Holdings |
| Desiccare | Rocky Mountain Metal Container |
| Graham Packaging | SEE |
US Active & Intelligent Packaging Report Scope
This study analyzes US demand for active and intelligent packaging. Historical data (2014, 2019, and 2024) and forecasts for 2029 and 2034 are presented for active and intelligent packaging demand by product and market. Annual data for 2021 to 2028 are also presented in the Overview chapter.
Active packaging products include:
-
gas scavengers
-
oxygen scavengers, including bottle systems, in-package systems, and other types such as films, sheets, and closure-related products
-
ethylene scavengers
-
carbon dioxide scavengers
-
corrosion control packaging
-
volatile corrosion inhibitors
-
corrosion scavengers
-
moisture control packaging
-
desiccants, including those made from silica gel, clay, and other desiccants such as molecular sieves
-
moisture control pads
-
other moisture control packaging, including self-absorbent trays, humidity control bags, and package inserts
-
susceptors
-
self-venting packaging
-
niche active packaging
-
antimicrobial packaging
-
flavor and fragrance control packaging
-
self-heating and self-chilling packaging
-
ingredient dispensing closures
-
lenticular imaging labels
-
edible packaging
-
Intelligent packaging products include:
-
color indicating packaging
-
time-temperature indicators (TTIs)
-
smartphone-enabled interactive packaging
-
QR codes
-
Near Field Communication (NFC)
-
-
niche intelligent packaging
-
compliance monitoring and active reminder (assistive) packaging
-
ripeness indicators
-
traceability systems
-
Excluded from this study are products such as:
-
data loggers
-
readers
-
software
-
TTIs for nonpackaging uses, such as temperature testing labels for industrial equipment
-
similar products serving security and supply chain tracking and monitoring functions that are not packaging
Market segments discussed include:
-
food and beverage
-
processed food
-
meat, poultry, and seafood
-
fresh produce
-
dairy
-
other foods (e.g., baby food, breakfast cereal, dried coffee and tea, eggs, fats and oils, frozen prepared breakfast foods, grain products, meal replacements and protein powders, meat alternatives, pancake and waffle mixes, soft drink syrups and concentrates, spices and seasonings, sweeteners and syrups)
-
beverages
-
-
pharmaceuticals
-
durable goods and other markets
-
primary metals
-
motor vehicles
-
electronics
-
other markets, including industrial machinery, military equipment and supplies, diagnostic and medical equipment, aerospace products, cut flowers, metal packaging jewelry, and other consumer goods such as tobacco products, pet food, cosmetics and toiletries, apparel, and toys
-
- Executive Summary
- Figure 1-1. US Active & Intelligent Packaging Market
- Short-Term Analysis
- Economic Forecast
- Table | Macroeconomic Indicators, 2023, 2024, 2025, &2026 (billion 2017 dollars & billion dollars)
- Short-Term Active & Intelligent Packaging Industry Trends
- Table | US Active & Intelligent Packaging Demand by Product, 2022 - 2026 (million dollars)
- Table | US Active & Intelligent Packaging Demand by Market, 2022 - 2026 (million dollars)
- Figure 2-1. US Active & Intelligent Packaging Demand, 2022 - 2026 (million dollars)
- Economic Forecast
- Overview
- Study Scope
- Figure 3-1. Active & Intelligent Packaging: Product Examples
- Historical Market Trends & Growth Factors
- Table | Active & Intelligent Packaging Demand, 2014 - 2024 (million dollars)
- Figure 3-2. Active & Intelligent Packaging Demand, 2014 - 2024 (million dollars)
- Product Trends
- Table | Active & Intelligent Packaging Demand by Product, 2014, 2019, 2024, 2029, &2034 (million dollars)
- Table | Annual Active & Intelligent Packaging Demand by Product, 2021 - 2028 (million dollars)
- Figure 3-3. Active & Intelligent Packaging Demand by Product, 2014, 2019, 2024, 2029, &2034 (million
- Markets Overview
- Table | Active & Intelligent Packaging Demand by Market, 2014, 2019, 2024, 2029, &2034 (million dollars )
- Table | Annual Active & Intelligent Packaging Demand by Market, 2021 - 2028 (million dollars )
- Figure 3-4. Active & Intelligent Packaging Demand by Market, 2014, 2019, 2024, 2029, &2034 (million
- Pricing & Inflation
- Overview
- Recent Inflation & Price Outlook
- Table | Active & Intelligent Packaging Product Prices, 2014, 2019, 2024, 2029, &2034 (cents per unit)
- Figure 3-5. Active & Intelligent Packaging Product Average Pricing, 2014 - 2029 (cents per unit)
- Global Trends
- Regulatory Considerations
- Sustainability Initiatives
- Sustainable Packaging Development
- Reduction of Food Waste
- Technology Trends & New Product Development
- Study Scope
- Gas Scavengers
- Scope & Product Description
- Figure 4-1. Gas Scavengers: Product Examples en Sca en er th lene Sca en er arbon io i e Sca en er
- Product Types
- Table | Gas Scavenger Demand by Type, 2014, 2019, 2024, 2029, &2034 (million dollars & billion units)
- Figure 4-2. Gas Scavenger Demand by Type, 2014, 2019, 2024, 2029, &2034 (million dollars)
- Oxygen Scavengers
- Demand by Product
- Table | Oxygen Scavenger Demand in Packaging by Product, 2014, 2019, 2024, 2029, &2034 (million dollars & bi
- Bottle Systems
- In-Package Systems
- Other Oxygen Scavengers
- Markets
- Table | Oxygen Scavenger Demand in Packaging by Market, 2014, 2019, 2024, 2029, &2034 (million dollars & bil
- Suppliers
- Demand by Product
- Ethylene Scavengers
- Table | Ethylene Scavenger Demand in Packaging by Market, 2014, 2019, 2024, 2029, &2034 (million dollars & b
- Carbon Dioxide Scavengers
- Table | Carbon Dioxide Scavenger Demand in Packaging by Market, 2014, 2019, 2024, 2029, &2034 (million dolla
- New Product Development
- Market Share
- Figure 4-3. Gas Scavenger in Packaging Market Share by Company, 2024 (billion dollars)
- Scope & Product Description
- Moisture Control Packaging
- Scope & Product Description
- Figure 5-1. Moisture Control Packaging: Product Examples
- Products Overview
- Table | Moisture Control Packaging Demand by Type & Market, 2014, 2019, 2024, 2029, &2034 (million dollars &
- Figure 5-2. Moisture Control Packaging Demand by Type, 2014, 2019, 2024, 2029, &2034 (million dollar
- Desiccants
- Product Description
- Demand by Type
- Table | Package Desiccant Demand by Type & Market, 2014, 2019, 2024, 2029, &2034 (million dollars & billion
- Silica Gel Desiccants
- Clay Desiccants
- Other Desiccants
- Moisture Control Pads
- Table | Moisture Control Pad Demand by Market, 2014, 2019, 2024, 2029, &2034 (million dollars & billion unit
- Other Moisture Control Packaging
- Table | Other Moisture Control Packaging Demand by Market, 2014, 2019, 2024, 2029, &2034 (million dollars &
- New Product Development
- Market Share
- Figure 5-3. Moisture Control Packaging Market Share by Company, 2024 (million dollars)
- Scope & Product Description
- Corrosion Control Packaging
- Scope & Product Description
- Figure 6-1. Corrosion Control Packaging: Product Examples
- Products Overview
- Demand by Type
- Table | Corrosion Control Packaging Demand by Type, 2014, 2019, 2024, 2029, &2034 (million dollars & million
- Figure 6-2. Corrosion Control Packaging Demand by Type, 2014, 2019, 2024, 2029, &2034 (million dolla
- Volatile Corrosion Inhibitors
- Table | Volatile Corrosion Inhibitor Packaging Demand by Type & Market, 2014, 2019, 2024, 2029, &2034 (milli
- Scavengers
- Table | Corrosion Control Scavenger Demand by Market, 2014, 2019, 2024, 2029, &2034 (million dollars & milli
- Demand by Type
- New Product Development
- Market Share
- Figure 6-3. Corrosion Control Packaging Market Share by Company, 2024 (million dollars)
- Scope & Product Description
- Susceptors & Self-Venting Packaging
- Scope & Product Description
- Figure 7-1. Susceptors & Self-Venting Packaging: Product Examples
- Products Overview
- Table | Susceptor & Self-Venting Packaging Demand by Type, 2014, 2019, 2024, 2029, &2034 (million dollars &
- Figure 7-2. Susceptor & Self-Venting Packaging Demand by Type, 2014, 2019, 2024, 2029, &2034 (millio
- Susceptors
- Table | Susceptor Packaging Demand by Type & Market, 2014, 2019, 2024, 2029, &2034 (million dollars & billio
- Self-Venting Packaging
- Table | Self-Venting Packaging Demand by Type & Market, 2014, 2019, 2024, 2029, &2034 (million dollars & bil
- New Product Development
- Market Share
- Figure 7-3. Susceptor & Self-Venting Packaging Market Share by Company, 2024 (million dollars)
- Scope & Product Description
- Color, Time, &Temperature Indicators
- Scope & Product Description
- Figure 8-1. Color, Time, &Temperature Indicators: Product Examples
- Products Overview
- Demand by Type
- Table | Color, Time, &Temperature Indicator Demand by Type, 2014, 2019, 2024, 2029, &2034 (million dollars &
- Figure 8-2. Color, Time, &Temperature Indicator Demand by Type, 2014, 2019, 2024, 2029, &2034 (milli
- Color Indicating Packaging
- Table | Color Indicating Packaging Demand by Market, 2014, 2019, 2024, 2029, &2034 (million dollars & billio
- Time-Temperature Indicators
- Table | Time-Temperature Indicator Demand in Packaging by Market, 2014, 2019, 2024, 2029, &2034 (million dol
- Demand by Type
- New Product Development
- Market Share
- Figure 8-3. Color, Time, &Temperature Indicator Market Share by Company, 2024 (billion dollars)
- Scope & Product Description
- Smartphone-Enabled Interactive Packaging
- Scope & Product Description
- Figure 9-1. Smartphone-Enabled Packaging: Examples o es ac a in
- Products Overview
- Demand by Type
- Table | Smartphone-Enabled Interactive Packaging Demand by Type & Market, 2014, 2019, 2024, 2029, &2034 (mil
- Figure 9-2. Smartphone-Enabled Interactive Packaging Demand by Type, 2014, 2019, 2024, 2029, &2034 (
- QR Codes
- Near Field Communication (NFC Packaging)
- Demand by Type
- New Product Development
- Key Suppliers
- Scope & Product Description
- Niche & Emerging Active & Intelligent Packaging
- Scope & Product Description
- Figure 10-1. Niche & Emerging Active & Intelligent Packaging: Product Examples
- Products Overview
- Table | Niche & Emerging Active & Intelligent Packaging Demand by Category, 2014, 2019, 2024, 2029, &2034 (m
- Figure 10-2. Niche & Emerging Active & Intelligent Packaging Demand by Category, 2014, 2019, 2024, 2
- Niche Active Packaging
- Table | Niche Active Packaging Demand by Market, 2014, 2019, 2024, 2029, &2034 (million dollars)
- Antimicrobial Packaging
- Table | Antimicrobial Packaging Demand by Market, 2014, 2019, 2024, 2029, &2034 (million dollars)
- Flavor & Fragrance Control Packaging
- Table | Flavor & Fragrance Packaging Demand by Type & Market, 2014, 2019, 2024, 2029, &2034 (million dollars
- Self-Heating & Self-Chilling Packaging
- Ingredient Dispensing Closures
- Lenticular Imaging Labels
- Edible Packaging
- Niche Intelligent Packaging
- Table | Niche Intelligent Packaging Demand by Market, 2014, 2019, 2024, 2029, &2034 (million dollars)
- Figure 10-3. Niche Intelligent Packaging Demand by Market, 2014, 2019, 2024, 2029, &2034 (million do
- Compliance Monitoring & Active Reminder (Assistive) Packaging
- Ripeness Indicators
- Traceability Systems
- Scope & Product Description
- Food & Beverage Market for Active & Intelligent Packaging
- Market Scope
- Markets Overview
- Table | Food & Beverage Market for Active & Intelligent Packaging, 2014, 2019, 2024, 2029, &2034 (million do
- Figure 11-1. Food & Beverage Market for Active & Intelligent Packaging, 2014, 2019, 2024, 2029, &203
- Food Packaging
- Demand by Application
- Table | Food Market for Active & Intelligent Packaging by Application, 2014, 2019, 2024, 2029, &2034 (millio
- Processed Food
- Table | Processed Food Market for Active & Intelligent Packaging by Type, 2014, 2019, 2024, 2029, &2034 (mil
- Meat, Poultry, &Seafood
- Table | Meat, Poultry, &Seafood Market for Active & Intelligent Packaging by Type, 2014, 2019, 2024, 2029, &
- Fresh Produce
- Table | Fresh Produce Market for Active & Intelligent Packaging by Type, 2014, 2019, 2024, 2029, &2034 (mill
- Dairy
- Table | Dairy Market for Active & Intelligent Packaging by Type, 2014, 2019, 2024, 2029, &2034 (million doll
- Other Foods
- Table | Other Food Applications for Active & Intelligent Packaging by Type, 2014, 2019, 2024, 2029, &2034 (m
- Demand by Application
- Beverage Packaging
- Table | Beverage Market for Active & Intelligent Packaging Demand by Type, 2014, 2019, 2024, 2029, &2034 (mi
- Packaging Product Trends
- Table | Food & Beverage Market for Active & Intelligent Packaging by Type, 2014, 2019, 2024, 2029, &2034 (mi
- New Product Development
- Pharmaceutical Market for Active & Intelligent Packaging
- Market Scope
- Packaging Product Trends
- Demand by Type
- Table | Pharmaceutical Market for Active & Intelligent Packaging by Type, 2014, 2019, 2024, 2029, &2034 (mil
- Figure 12-1. Pharmaceutical Market for Active & Intelligent Packaging by Type, 2014, 2019, 2024, 202
- Intelligent Packaging
- Moisture Control Packaging
- Gas Scavengers & Other Active Packaging
- Demand by Type
- New Product Development
- Durable Goods & Other Markets for Active & Intelligent Packaging
- Market Scope
- Markets Overview
- Demand by Market
- Table | Durable Goods & Other Markets for Active & Intelligent Packaging by Market, 2014, 2019, 2024, 2029,
- Figure 13-1. Durable Goods & Other Markets for Active & Intelligent Packaging by Market, 2014, 2019,
- Primary Metals
- Table | Primary Metals Market for Active & Intelligent Packaging by Type, 2014, 2019, 2024, 2029, &2034 (mil
- Motor Vehicles
- Table | Motor Vehicles Market for Active & Intelligent Packaging by Type, 2014, 2019, 2024, 2029, &2034 (mil
- Electronics
- Table | Electronics Market for Active & Intelligent Packaging by Type, 2014, 2019, 2024, 2029, &2034 (millio
- All Other Markets
- Table | All Other Markets for Active & Intelligent Packaging by Type, 2014, 2019, 2024, 2029, &2034 (million
- Demand by Market
- Packaging Product Trends
- Table | Durable Goods & Other Markets for Active & Intelligent Packaging by Type, 2014, 2019, 2024, 2029, &2
- New Product Development
- Industry Structure
- Key Findings & Industry Composition
- Table | US Active & Intelligent Packaging Sales by Company, 2024 (million dollars)
- Market Share
- Figure 14-1. US Active & Intelligent Packaging Market Share by Company, 2024, (billion dollars)
- Figure 14-2. US Active & Intelligent Packaging Market: Leading Supplier, 2024
- Figure 14-3. US Active & Intelligent Packaging Market: Second Leading Supplier, 2024
- Figure 14-4. US Active & Intelligent Packaging Market: Third Leading Supplier, 2024 as Sca en ers n
- Figure 14-5. US Active & Intelligent Packaging Market: Fourth Leading Supplier, 2024
- Figure 14-6. US Active & Intelligent Packaging Market: Fifth Leading Supplier, 2024
- Figure 14-7. US Active & Intelligent Packaging Market: Sixth Leading Supplier, 2024
- Figure 14-8. US Active & Intelligent Packaging Market: Seventh Leading Supplier, 2024
- Mergers & Acquisitions
- Table | Selected Mergers & Acquisitions
- List of Industry Participants
- Table | Selected Industry Participants
- Key Findings & Industry Composition
- Appendix
- Report Details
- Table | Relevant Industry Codes
- Table | Relevant HS Codes
- Definitions
- Abbreviations
- Table | Abbreviations & Acronyms Used in Study
- Freedonia Methodology
- Study-Specific Methodology
- Sources
- Associations & Agencies
- Related Studies & Reports
- Macroeconomic Assumptions
- Economic Environment
- Table | Macroeconomic Indicators, 2014, 2019, 2024, 2029, &2034 (billion 2017 dollars & billion dollars)
- Demographic Trends
- Table | Population & Households, 2014, 2019, 2024, 2029, &2034 (million persons)
- Manufacturers’ Shipments
- Table | Manufacturers’ Shipments, 2014, 2019, 2024, 2029, &2034 (billion 2017 dollars & billion dollars)
- Economic Environment
- Report Details
Active packaging is broadly defined as packaging that performs a function beyond the protection and identification of its contents. Active packaging interacts with the contents of the package to preserve or enhance quality by maintaining freshness, extending shelf life, or protecting against contamination.
Intelligent packaging refers to packaging technology that provides external data and/or relays information relative to the status of the contents. Intelligent packaging focuses on providing information about the condition of the contents or external environment without directly affecting the contents themselves. This can include tracking temperature, freshness, or shelf life and relaying that information to external devices.
In 2024 demand for active & intelligent packaging products in the US reached nearly $6 billion.