US Food Packaging
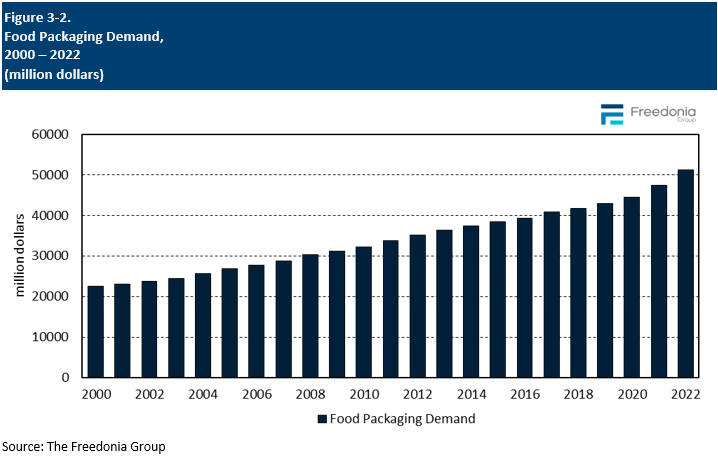
Demand for food packaging is forecast to increase 2.5% per year to $58.1 billion in 2027.
Free Sample Report
Request a free sample of this report and our team will email it to you.
Report Overview
Packaging of food is something we see every day, but what drives the decisions of consumers and manufacturers?
-
Cutting costs and attracting customers
-
Sustainability conversions with transitions to molded fiber and bioplastics
-
Source reductions with use of flexible packaging like pouches
Get the insights you need to compete.
This study examines the US market for food packaging, defined as primary and secondary packaging materials sold to food manufacturers, primarily for products targeted at 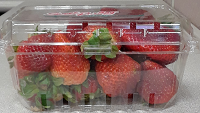 retail or foodservice markets. Historical data are provided for 2012, 2017, and 2022, with forecasts through 2027. Annual data is provided for 2018-2026. Data are provided in current dollar value and units. Also provided is an analysis of key industry players.
Featuring 164 tables and 81 figures – available in Excel and Powerpoint! Learn More
This report includes data from 2011-2031 in 5 year intervals and tables featuring year-by-year data for 2018-2025.
Read a discussion regarding 3D Printing
Demand for food packaging is forecast to increase 2.5% per year to $58.1 billion in 2027, with real growth of 1.2% per year to 540 billion units. While growth in unit terms will remain relatively steady, market value growth will be affected by an easing of high raw material prices and supply chain issues that caused pricing for most products to surge in 2021 and 2022. In general, the food market is challenging for packaging suppliers due to the vast number of distinct applications in which packaging must not only meet specific performance criteria, but also be cost effective and fall in line with changing sustainability goals and consumer preferences:
- Premium, high-performance products – such as aseptic cartons, skin packaging, and bag-in-box formats – will see the strongest advances.
- Fresh and frozen food formats continue to see the fastest growth, with conventional shelf-stable formats somewhat lagging.
- Plastic will continue to be the largest and fastest growing of the major food packaging materials, although sustainable materials like molded fiber will experience faster growth overall as they penetrate new applications.
- The outlook for paper-based packaging will be mixed, with sluggish gains in products like folding cartons overshadowing healthy gains in growth areas like aseptic cartons and food cups.
Sustainability Remains Top Concern for Packaging Products, Drives Innovations
Sustainability continues to be among the highest profile concerns in the food packaging market, with producers of different formats and materials jockeying to be seen as the most eco-friendly. Actions taken to improve sustainability include greater focus on recyclable and compostable packaging, incorporating recycled and post-consumer content into packaging, light weighting and source reduction, and improving shelf-life to reduce food waste. Additionally, many manufacturers are working to increase the performance of sustainable solutions, such as developing aqueous barrier solutions for paper and molded fiber products to allow their use in a wider variety of applications while still maintaining their recyclability or compostability.While plastic is the leading target for sustainability conversions, end users continue to value plastic over other materials based on cost and performance. To address sustainability concerns, manufacturers have increasingly focused on ensuring that their plastic packaging is recyclable and incorporates recycled content, as well as offering more bioplastic options.
Convenience & Performance Remain the Most Important Factors for Food Packaging
Packaging is one of the key ways that food companies differentiate their products, so new formats are always in demand. As such, high-performance products are expected to take share from traditional packaging; formats like aseptic cartons, vacuum skin packaging, stand-up pouches, and bag-in-box will continue to see the strongest gains as they afford a variety of benefits – including extended shelf-life, lighter weight, ease of dispensing, improved sanitation, and a more premium appearance – over traditional, lower-cost packaging options like bags, wrap, and cans.Historical Sales Trends
Shifts in demand for food packaging from year to year are determined by a few factors, primarily related to the production and marketing of food products. These activities in turn are influenced by:- demographic trends such as age, average household size, and levels of disposable income
- consumer spending on food and the balance between at-home and away-from-home meals
- food preferences (e.g., demand for enhanced convenience or for organic products)
- restaurant and other foodservice industry revenues
- raw material and conversion costs
- changes in the mix of foods being packaged, particularly in terms of food format (canned, dried, frozen, fresh)
- trends in packaging size and format, such as shifts toward smaller single-serving packages, family size units, or multipacks
- the proportion of food that is sold via retail channels versus foodservice establishments
- environmental and regulatory factors, including trends such as source reduction, the use of recycled content, and recyclability
Applications Overview
Most food products are packaged in some way before being sold to end users, with some types of fresh produce being one notable exception. The market value of packaging sold for different food applications varies depending on the performance requirements, the volume of packaging needed, and the materials used.Applications for food packaging include:
- meat, poultry, and seafood
- fresh produce
- prepared foods
- dairy and dairy alternatives
- baked goods
- sauces, dressings, and condiments
- processed fruits and vegetables
- savory snack foods
- candy and confections
- other processed foods (including dry coffee and tea, baby food, flours and grains, sweeteners and syrups, spices and seasonings, eggs, fats and oils, meat alternatives, soft drink syrups, meal replacements and protein powders, and other a variety of other food items)
- Prepared foods, which include ready-to-eat and ready-to-heat items, are expected to see among the fastest growth among major food categories due to their convenience and the growing availability of fresh product offerings, as well as continued strong growth in frozen variants.
- Candy and confections will also experience fast growth, owing to the trend toward smaller individually wrapped versions of larger candies and continued inroads by higher value packaging that provides better performance or sustainability advantages, increasing both real and nominal demand.
- Demand for processed fruits and vegetables – primarily canned products – will see below average gains due to market maturity and limited opportunities for new product development (exceptions being riced and spiralized frozen vegetables).
Packaging Pricing Trends
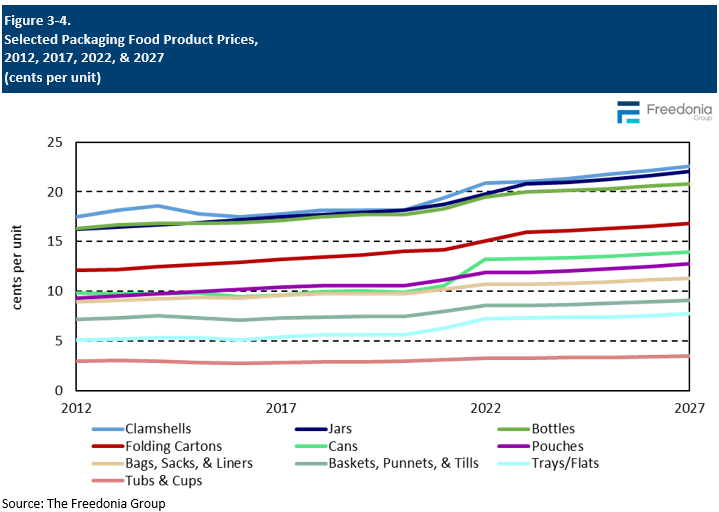
Pricing is an important factor in selecting packaging for a particular food application. Price competition in the industry is intense, due to the prevalence of relatively low-technology, commodity-type products.The primary determinant of pricing for food packaging is the cost of raw materials, which typically represent 50% to 60% of the final packaging price.
Other key factors influencing the price of food packaging include:
- the degree of lightweighting and downsizing activity – efforts that cut costs per unit by reducing the packaging size
- the presence of value-added features such as spouts and reclosable zippers
- the packaging product mix, both in terms of package size and material composition
- supply chain pressures – packaging producers are often squeezed between large raw material suppliers on one end and large food processors on the other, leaving them less options for pricing flexibility
- pressure to improve sustainability, which can result in the use of higher cost packaging materials
Going forward, packaging pricing is expected to normalize, with the major packaging material categories – plastic, paper, metal, and glass – forecast to see price growth in line with historical trends beginning in 2024.
However, pricing of molded fiber – among the fastest growth packaging materials – is expected to remain flat, reflecting diverging trends:
- Advancements in manufacturing and tooling processes will decrease the price of production.
- Increased focus on performance and aesthetic of molded fiber products will increase average price.
- Growth in domestic production will initially increase pricing as manufacturers switch to newer manufacturing processes. However, this will lead to decreasing production costs and lower average prices over time.
Food Production Trends
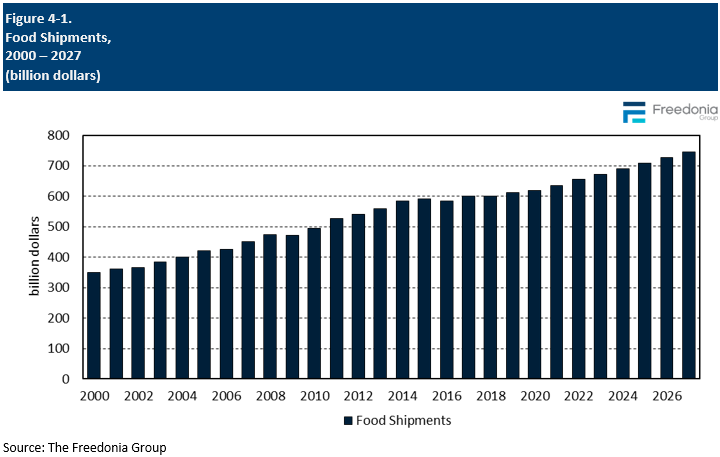
The most important factor in the amount of food packaging needed is the outlook for food production, both in terms of the volume produced and the types of food that are popular. While trends in the amount of food produced and consumed at the aggregate level tend to be relatively stable – tracking growth in population and food pricing levels – the mix of food produced can vary over time influenced by changing consumer dietary preferences. This change can, in turn, impact the type and amount of food packaging needed.Food shipments, including fresh produce, are forecast to rise 2.6% per year to $746 billion in 2027, with real growth of 2.4% annually to $584 billion, adjusted for inflation:
- Snack food will see favorable growth, boosted by the trend toward more, smaller meals throughout the day and continued new product introductions.
- Meat, poultry, and seafood will account for the highest share of output value, aided by a renewed focus on proteins for healthy lifestyles, although competition from meat alternatives will limit advances to some degree.
- Frozen fruit, vegetables, and specialty foods will see favorable growth, boosted by their convenience and improved nutritional profile compared to shelf-stable products.
- Fresh produce will see above average growth following declines in 2021 and 2022.
Read a discussion regarding 3D Printing
Demand for food packaging is forecast to increase 2.5% per year to $58.1 billion in 2027, with real growth of 1.2% per year to 540 billion units. While growth in unit terms will remain relatively steady, market value growth will be affected by an easing of high raw material prices and supply chain issues that caused pricing for most products to surge in 2021 and 2022. In general, the food market is challenging for packaging suppliers due to the vast number of distinct applications in which packaging must not only meet specific performance criteria, but also be cost effective and fall in line with changing sustainability goals and consumer preferences:
- Premium, high-performance products – such as aseptic cartons, skin packaging, and bag-in-box formats – will see the strongest advances.
- Fresh and frozen food formats continue to see the fastest growth, with conventional shelf-stable formats somewhat lagging.
- Plastic will continue to be the largest and fastest growing of the major food packaging materials, although sustainable materials like molded fiber will experience faster growth overall as they penetrate new applications.
- The outlook for paper-based packaging will be mixed, with sluggish gains in products like folding cartons overshadowing healthy gains in growth areas like aseptic cartons and food cups.
Sustainability Remains Top Concern for Packaging Products, Drives Innovations
Sustainability continues to be among the highest profile concerns in the food packaging market, with producers of different formats and materials jockeying to be seen as the most eco-friendly. Actions taken to improve sustainability include greater focus on recyclable and compostable packaging, incorporating recycled and post-consumer content into packaging, light weighting and source reduction, and improving shelf-life to reduce food waste. Additionally, many manufacturers are working to increase the performance of sustainable solutions, such as developing aqueous barrier solutions for paper and molded fiber products to allow their use in a wider variety of applications while still maintaining their recyclability or compostability.While plastic is the leading target for sustainability conversions, end users continue to value plastic over other materials based on cost and performance. To address sustainability concerns, manufacturers have increasingly focused on ensuring that their plastic packaging is recyclable and incorporates recycled content, as well as offering more bioplastic options.
Convenience & Performance Remain the Most Important Factors for Food Packaging
Packaging is one of the key ways that food companies differentiate their products, so new formats are always in demand. As such, high-performance products are expected to take share from traditional packaging; formats like aseptic cartons, vacuum skin packaging, stand-up pouches, and bag-in-box will continue to see the strongest gains as they afford a variety of benefits – including extended shelf-life, lighter weight, ease of dispensing, improved sanitation, and a more premium appearance – over traditional, lower-cost packaging options like bags, wrap, and cans.Historical Sales Trends
Shifts in demand for food packaging from year to year are determined by a few factors, primarily related to the production and marketing of food products. These activities in turn are influenced by:- demographic trends such as age, average household size, and levels of disposable income
- consumer spending on food and the balance between at-home and away-from-home meals
- food preferences (e.g., demand for enhanced convenience or for organic products)
- restaurant and other foodservice industry revenues
- raw material and conversion costs
- changes in the mix of foods being packaged, particularly in terms of food format (canned, dried, frozen, fresh)
- trends in packaging size and format, such as shifts toward smaller single-serving packages, family size units, or multipacks
- the proportion of food that is sold via retail channels versus foodservice establishments
- environmental and regulatory factors, including trends such as source reduction, the use of recycled content, and recyclability

Applications Overview
Most food products are packaged in some way before being sold to end users, with some types of fresh produce being one notable exception. The market value of packaging sold for different food applications varies depending on the performance requirements, the volume of packaging needed, and the materials used.Applications for food packaging include:
- meat, poultry, and seafood
- fresh produce
- prepared foods
- dairy and dairy alternatives
- baked goods
- sauces, dressings, and condiments
- processed fruits and vegetables
- savory snack foods
- candy and confections
- other processed foods (including dry coffee and tea, baby food, flours and grains, sweeteners and syrups, spices and seasonings, eggs, fats and oils, meat alternatives, soft drink syrups, meal replacements and protein powders, and other a variety of other food items)
- Prepared foods, which include ready-to-eat and ready-to-heat items, are expected to see among the fastest growth among major food categories due to their convenience and the growing availability of fresh product offerings, as well as continued strong growth in frozen variants.
- Candy and confections will also experience fast growth, owing to the trend toward smaller individually wrapped versions of larger candies and continued inroads by higher value packaging that provides better performance or sustainability advantages, increasing both real and nominal demand.
- Demand for processed fruits and vegetables – primarily canned products – will see below average gains due to market maturity and limited opportunities for new product development (exceptions being riced and spiralized frozen vegetables).
Packaging Pricing Trends
Pricing is an important factor in selecting packaging for a particular food application. Price competition in the industry is intense, due to the prevalence of relatively low-technology, commodity-type products.The primary determinant of pricing for food packaging is the cost of raw materials, which typically represent 50% to 60% of the final packaging price.
Other key factors influencing the price of food packaging include:
- the degree of lightweighting and downsizing activity – efforts that cut costs per unit by reducing the packaging size
- the presence of value-added features such as spouts and reclosable zippers
- the packaging product mix, both in terms of package size and material composition
- supply chain pressures – packaging producers are often squeezed between large raw material suppliers on one end and large food processors on the other, leaving them less options for pricing flexibility
- pressure to improve sustainability, which can result in the use of higher cost packaging materials
Going forward, packaging pricing is expected to normalize, with the major packaging material categories – plastic, paper, metal, and glass – forecast to see price growth in line with historical trends beginning in 2024.
However, pricing of molded fiber – among the fastest growth packaging materials – is expected to remain flat, reflecting diverging trends:
- Advancements in manufacturing and tooling processes will decrease the price of production.
- Increased focus on performance and aesthetic of molded fiber products will increase average price.
- Growth in domestic production will initially increase pricing as manufacturers switch to newer manufacturing processes. However, this will lead to decreasing production costs and lower average prices over time.

Food Production Trends
The most important factor in the amount of food packaging needed is the outlook for food production, both in terms of the volume produced and the types of food that are popular. While trends in the amount of food produced and consumed at the aggregate level tend to be relatively stable – tracking growth in population and food pricing levels – the mix of food produced can vary over time influenced by changing consumer dietary preferences. This change can, in turn, impact the type and amount of food packaging needed.Food shipments, including fresh produce, are forecast to rise 2.6% per year to $746 billion in 2027, with real growth of 2.4% annually to $584 billion, adjusted for inflation:
- Snack food will see favorable growth, boosted by the trend toward more, smaller meals throughout the day and continued new product introductions.
- Meat, poultry, and seafood will account for the highest share of output value, aided by a renewed focus on proteins for healthy lifestyles, although competition from meat alternatives will limit advances to some degree.
- Frozen fruit, vegetables, and specialty foods will see favorable growth, boosted by their convenience and improved nutritional profile compared to shelf-stable products.
- Fresh produce will see above average growth following declines in 2021 and 2022.

- Executive Summary
- Figure 1-1. US Food Packaging Market Overview
- Short-Term Analysis
- Economic Forecast
- Table | Macroeconomic Indicators, 2020 - 2024
- Figure 2-1. Real GDP by Economic Sector, 2020 - 2023
- Short-Term Food Industry Outlook
- Short-Term Food Packaging Industry Trends
- Table | Annual Food Packaging Demand by Packaging Format & Product, 2020 - 2024
- Table | Annual Food Packaging Demand by Application, 2020 - 2024
- Figure 2-2. Annual Food Packaging Demand, 2020 - 2025
- Economic Forecast
- Overview
- Study Scope
- Figure 3-1. Food Packaging: Product Examples
- Historical Sales Trends
- Table | Food Packaging Demand, 2012 - 2022
- Figure 3-2. Food Packaging Demand, 2000 - 2022
- Packaging Formats (Flexible vs. Rigid)
- Table | Food Packaging Demand by Packaging Format, 2012, 2017, 2022, &2027
- Table | Annual Food Packaging Demand by Packaging Format, 2019 - 2026
- Food Formats (Fresh/Refrigerated, Frozen, Canned, Dried)
- Table | Food Packaging Demand by Food Format, 2012, 2017, 2022, &2027
- Table | Annual Food Packaging Demand by Food Format, 2019 - 2026
- Applications Overview
- Table | Food Packaging Demand by Application, 2012, 2017, 2022, &2027
- Table | Annual Food Packaging Demand by Application, 2019 - 2026
- Material Trends
- Table | Food Packaging Demand by Material, 2012, 2017, 2022, &2027
- Table | Annual Food Packaging Demand by Material, 2019 - 2026
- Figure 3-3. Food Packaging Demand by Material, 2012, 2017, 2022, &2027
- Packaging Pricing Trends
- Table | Selected Food Packaging Product Prices, 2012, 2017, 2022, &2027
- Table | Annual Selected Food Packaging Product Prices, 2019 - 2026
- Figure 3-4. Selected Packaging Food Product Prices, 2012, 2017, 2022, &2027
- Study Scope
- Factors Impacting Food Packaging Demand
- Food Production Trends
- Figure 4-1. Food Shipments, 2000 - 2027
- Food Outlet Trends (Retail vs Foodservice)
- Figure 4-2. Coronavirus Changes to Food Ordering Patterns & Returning to a Pre-COVID Normal, 2021, 2
- Figure 4-3. Coronavirus Changes to Meal Kit Ordering Patterns & Returning to a Pre-COVID Normal, 202
- Figure 4-4. Coronavirus Changes to Restaurant Ordering Habits & Returning to a Pre-COVID Normal, 202
- Food Retail Channel Trends
- Food Retail Channels
- The Walmart Effect
- Growth in ALDI & Other Low Price Chains
- E-Commerce Sales
- Technology & Innovation
- Food Safety Issues
- Sustainability Initiatives
- Sustainability in Packaging
- Recycling & Recycled Content
- Compostability
- Food Waste
- Alternative Materials (Bioplastics, Bamboo, Sugarcane)
- Figure 4-5. Alternative Material Food Packaging: Product Examples
- Consumer Preferences
- Consumer Perspectives on Packaging Sustainability
- Table | Consumer Perspectives of Eco-Friendliness of Packaging Materials, 2023
- Table | Features Consumers Especially Look for When Considering "Sustainable" or "Eco-Friendly" Packaging by
- Table | Consumer Attitudes About Recycled Plastics & Biodegradability; By Gender, Age Group, Urban vs. Rural
- Consumer Attitudes About Recycling
- Table | Consumer Attitudes About Recycling; By Gender, Age Group, Urban vs. Rural Setting, &Annual Household
- Consumer Attitudes About Recyclable & Compostable Packaging
- Table | Consumer Attitudes About Recyclable & Compostable Content in Packaging; By Gender, Age Group, Urban
- Priority of Features in Food Packaging
- Table | Consumer Attitudes About Priorities of Features in Packaging, 2023
- Consumer Perspectives on Packaging Sustainability
- Food Production Trends
- Rigid Food Packaging
- Scope & Product Description
- Figure 5-1. Rigid Food Packaging: Product Examples
- Packaging Products
- Demand by Product Type
- Table | Rigid Food Packaging Demand by Product, 2012, 2017, 2022, &2027
- Table | Annual Rigid Food Packaging Demand by Product, 2019 - 2026
- Bottles & Jars
- Table | Food Bottle & Jar Demand by Product & Material, 2012, 2017, 2022, &2027
- Table | Annual Food Bottle & Jar Demand by Product & Material, 2019 - 2026
- Tubs & Cups
- Table | Food Tub & Cup Demand by Product & Material, 2012, 2017, 2022, &2027
- Table | Annual Food Tub & Cup Demand by Product & Material, 2019 - 2026
- Cans
- Table | Food Can Demand, 2012, 2017, 2022, &2027
- Table | Annual Food Can Demand, 2019 - 2026
- Clamshells & Two-Piece Containers
- Table | Food Clamshell & Two-Piece Container Demand by Product & Material, 2012, 2017, 2022, &2027
- Table | Annual Food Clamshell & Two-Piece Container Demand by Product & Material, 2019 - 2026
- Other Containers (Egg Cartons, Blister Packaging, Canisters, Pails, &Tubes)
- Table | Other Food Container Demand by Product & Material, 2012, 2017, 2022, &2027
- Table | Annual Other Food Container Demand by Product & Material, 2019 - 2026
- Boxes & Cartons
- Table | Food Box & Carton Demand by Product, 2012, 2017, 2022, &2027
- Table | Annual Food Box & Carton Demand by Product, 2019 - 2026
- Table | Other Rigid Food Packaging Demand by Product, 2012, 2017, 2022, &2027
- Table | Annual Other Rigid Food Packaging Demand by Product, 2019 - 2026
- Demand by Product Type
- Materials
- Table | Rigid Food Packaging Demand by Material, 2012, 2017, 2022, &2027
- Table | Annual Rigid Food Packaging Demand by Material, 2019 - 2026
- Applications
- Table | Rigid Food Packaging Demand by Application, 2012, 2017, 2022, &2027
- Table | Annual Rigid Food Packaging Demand by Application, 2019 - 2026
- Market Share
- Figure 5-2. Rigid Food Packaging Market Share by Company, 2022
- Scope & Product Description
- Flexible Food Packaging
- Scope & Product Description
- Figure 6-1. Flexible Food Packaging: Product Examples
- Packaging Products
- Demand by Product Type
- Table | Flexible Food Packaging Demand by Product, 2012, 2017, 2022, &2027
- Table | Annual Flexible Food Packaging Demand by Product, 2019 - 2026
- Pouches (Stand-Up, Pillow, Side Seal)
- Table | Food Pouch Demand by Type & Material, 2012, 2017, 2022, &2027
- Table | Annual Food Pouch Demand by Type & Material, 2019 - 2026
- Bags, Sacks & Liners
- Table | Food Bag, Sack, &Liner Demand by Material, 2012, 2017, 2022, &2027
- Table | Annual Food Bag, Sack, &Liner Demand by Material, 2019 - 2026
- Wrap
- Table | Food Wrap Demand by Material, 2012, 2017, 2022, &2027
- Table | Annual Food Wrap Demand by Material, 2019 - 2026
- Other Flexible Food Packaging
- Table | Other Flexible Food Packaging Demand by Product, 2012, 2017, 2022, &2027
- Table | Annual Other Flexible Food Packaging Demand by Product, 2019 - 2026
- Demand by Product Type
- Materials
- Table | Flexible Food Packaging Demand by Material, 2012, 2017, 2022, &2027
- Table | Annual Flexible Food Packaging Demand by Material, 2019 - 2026
- Applications
- Table | Flexible Food Packaging Demand by Application, 2012, 2017, 2022, &2027
- Table | Annual Flexible Food Packaging Demand by Application, 2019 - 2026
- Market Share
- Figure 6-2. Flexible Food Packaging Market Share by Company, 2022
- Scope & Product Description
- Plastic Food Packaging
- Scope & Product Description
- Figure 7-1. Plastic Food Packaging: Product Examples
- Packaging Products
- Table | Plastic Food Packaging Demand by Product, 2012, 2017, 2022, &2027
- Table | Annual Plastic Food Packaging Demand by Product, 2019 - 2026
- Applications
- Table | Plastic Food Packaging Demand by Application, 2012, 2017, 2022, &2027
- Table | Annual Plastic Food Packaging Demand by Application, 2019 - 2026
- New Product Development
- Figure 7-2. Plastic Food Packaging: New Product Developments
- Market Share
- Figure 7-3. Plastic Food Packaging Market Share by Company, 2022
- Scope & Product Description
- Paper & Paperboard Food Packaging
- Scope & Product Description
- Figure 8-1. Paper & Paperboard Food Packaging: Product Examples
- Packaging Products
- Table | Paper & Paperboard Food Packaging Demand by Product, 2012, 2017, 2022, &2027
- Table | Annual Paper & Paperboard Food Packaging Demand by Product, 2019 - 2026
- Applications
- Table | Paper & Paperboard Food Packaging Demand by Application, 2012, 2017, 2022, &2027
- Table | Annual Paper & Paperboard Food Packaging Demand by Application, 2019 - 2026
- New Product Development
- Figure 8-2. Paper & Paperboard Food Packaging: New Product Developments
- Market Share
- Figure 8-3. Paper & Paperboard Food Packaging Market Share by Company, 2022
- Scope & Product Description
- Metal Food Packaging
- Scope & Product Description
- Figure 9-1. Metal Food Packaging: Product Examples
- Packaging Products
- Table | Metal Food Packaging Demand by Product, 2012, 2017, 2022, &2027
- Table | Annual Metal Food Packaging Demand by Product, 2019 - 2026
- Applications
- Table | Metal Food Packaging Demand by Application, 2012, 2017, 2022, &2027
- Table | Annual Metal Food Packaging Demand by Application, 2019 - 2026
- New Product Development
- Figure 9-2. Metal Food Packaging: New Product Examples
- Market Share
- Figure 9-3. Metal Food Packaging Market Share by Company, 2022
- Scope & Product Description
- Glass Food Packaging
- Scope & Product Description
- Figure 10-1. Glass Food Packaging: Product Examples
- Packaging Products
- Table | Glass Food Packaging Demand by Product, 2012, 2017, 2022, &2027
- Table | Annual Glass Food Packaging Demand by Product, 2019 - 2026
- Applications
- Table | Glass Food Packaging Demand by Application, 2012, 2017, 2022, &2027
- Table | Annual Glass Food Packaging Demand by Application, 2019 - 2026
- New Product Development
- Figure 10-2. Glass Food Packaging: New Product Developments
- Market Share
- Figure 10-3. Glass Food Packaging Market Share by Company, 2022
- Scope & Product Description
- Small Volume Packaging Materials
- Materials Trends
- Demand by Type
- Table | Smaller Volume Food Packaging Material Demand by Material, 2012, 2017, 2022, &2027
- Table | Annual Smaller Volume Food Packaging Material Demand by Material, 2019 - 2026
- Molded Fiber
- Table | Molded Fiber Food Packaging Demand by Application & Fiber Source, 2012, 2017, 2022, &2027
- Table | Annual Molded Fiber Food Packaging Demand by Application & Fiber Source, 2019 - 2026
- Figure 11-1. Molded Pulp Food Packaging: Product Examples
- Figure 11-2. Molded Sugarcane & Bamboo Food Packaging: Product Examples
- Mesh
- Table | Mesh Food Packaging Demand by Application, 2012, 2017, 2022, &2027
- Table | Annual Mesh Food Packaging Demand by Application, 2019 - 2026
- Figure 11-3. Mesh Food Packaging: Product Examples
- Cellulose
- Table | Cellulose-Based Food Packaging Demand by Application, 2012, 2017, 2022, &2027
- Table | Annual Cellulose-Based Food Packaging Demand by Application, 2019 - 2026
- Figure 11-4. Cellulose-Based Food Packaging: Product Examples
- Textiles & Nonwovens
- Table | Textile & Nonwoven Food Packaging Demand by Application, 2012, 2017, 2022, &2027
- Table | Annual Textile & Nonwoven Food Packaging Demand by Application, 2019 - 2026
- Figure 11-5. Textile & Nonwoven Food Packaging: Product Examples
- Wood
- Table | Wood Food Packaging Demand by Application, 2012, 2017, 2022, &2027
- Table | Annual Wood Food Packaging Demand by Application, 2019 - 2026
- Figure 11-6. Wood Food Packaging: Product Examples
- Demand by Type
- Packaging Products
- Table | Small Volume Food Packaging Materials Demand by Product, 2012, 2017, 2022, &2027
- Table | Annual Small Volume Food Packaging Materials Demand by Product, 2019 - 2026
- Applications
- Table | Small Volume Food Packaging Materials Demand by Application, 2012, 2017, 2022, &2027
- Table | Annual Small Volume Food Packaging Materials Demand by Application, 2019 - 2026
- Materials Trends
- Meat, Poultry, &Seafood Packaging
- Scope & Product Description
- Table | Industry Codes Related to Meat, Poultry, &Seafood
- Figure 12-1. Meat, Poultry, &Seafood Packaging: Product Examples
- Growth Drivers & Restraints
- Figure 12-2. Meat, Poultry, &Seafood Packaging Demand by Packaging Format, 2012, 2017, 2022, &2027
- Packaging Products
- Table | Meat, Poultry, &Seafood Packaging Demand by Product, 2012, 2017, 2022, &2027
- Table | Annual Meat, Poultry, &Seafood Packaging Demand by Product, 2019 - 2026
- Figure 12-3. Meat, Poultry, &Seafood: Comparative Value Growth for Packaging Products, 2022 - 2027
- Materials
- Table | Meat, Poultry, &Seafood Packaging Demand by Material, 2012, 2017, 2022, &2027
- Table | Annual Meat, Poultry, &Seafood Packaging Demand by Material, 2019 - 2026
- Applications (Meat, Poultry, Seafood) &Food Formats
- Table | Meat, Poultry, &Seafood Packaging by Application & Food Format, 2012, 2017, 2022, &2027
- Table | Annual Meat, Poultry, &Seafood Packaging by Application & Food Format, 2019 - 2026
- New Product Development
- Figure 12-4. Meat, Poultry, &Seafood Packaging: New Product Development Examples
- Key Suppliers
- Scope & Product Description
- Fresh Produce Packaging
- Scope & Product Description
- Figure 13-1. Fresh Produce Packaging: Product Examples
- Growth Drivers & Restraints
- Figure 13-2. Fresh Produce Packaging Demand by Packaging Format, 2012, 2017, 2022, &2027
- Packaging Products
- Table | Fresh Produce Packaging Demand by Product, 2012, 2017, 2022, &2027
- Table | Annual Fresh Produce Packaging Demand by Product, 2019 - 2026
- Figure 13-3. Fresh Produce: Comparative Value Growth for Packaging Products, 2022 - 2027
- Materials
- Table | Fresh Produce Packaging Demand by Material, 2012, 2017, 2022, &2027
- Table | Annual Fresh Produce Packaging Demand by Material, 2019 - 2026
- Applications (Vegetables, Fruit, Salad)
- Table | Fresh Produce Packaging Demand by Application, 2012, 2017, 2022, &2027
- Table | Annual Fresh Produce Packaging Demand by Application, 2019 - 2026
- New Product Development
- Figure 13-4. Fresh Produce Packaging: New Product Development Examples
- Key Suppliers
- Scope & Product Description
- Prepared Foods Packaging
- Scope & Product Description
- Table | Industry Codes Related to Prepared Foods
- Figure 14-1. Prepared Foods Packaging: Product Examples
- Growth Drivers & Restraints
- Figure 14-2. Prepared Food Packaging Demand by Packaging Format, 2012, 2017, 2022, &2027
- Packaging Products
- Table | Prepared Foods Packaging Demand by Product, 2012, 2017, 2022, &2027
- Table | Annual Prepared Foods Packaging Demand by Product, 2019 - 2026
- Figure 14-3. Prepared Foods: Comparative Value Growth for Packaging Products, 2022 - 2027
- Materials
- Table | Prepared Foods Packaging Demand by Material, 2012, 2017, 2022, &2027
- Table | Annual Prepared Foods Packaging Demand by Material, 2019 - 2026
- Applications (Dinners, Pizza, Soup, Potato/Pasta/Rice Dishes) &Food Formats
- Table | Prepared Foods Packaging Demand by Application & Food Format, 2012, 2017, 2022, &2027
- Table | Annual Prepared Foods Packaging Demand by Application & Food Format, 2019 - 2026
- New Product Development
- Figure 14-4. Prepared Foods Packaging: New Product Development Examples
- Key Suppliers
- Scope & Product Description
- Dairy Packaging
- Scope & Product Description
- Table | Industry Codes Related to Dairy Products
- Figure 15-1. Dairy Packaging: Product Examples
- Growth Drivers & Restraints
- Figure 15-2. Dairy Packaging Demand by Packaging Format, 2012, 2017, 2022, &2027
- Packaging Products
- Table | Dairy Packaging Demand by Product, 2012, 2017, 2022, &2027
- Table | Annual Dairy Packaging Demand by Product, 2019 - 2026
- Figure 15-3. Dairy: Comparative Value Growth for Packaging Products, 2022 - 2027
- Materials
- Table | Dairy Packaging Demand by Material, 2012, 2017, 2022, &2027
- Table | Annual Dairy Packaging Demand by Material, 2019 - 2026
- Applications (Cheese, Ice Cream, Yogurt, Butter) &Food Formats
- Table | Dairy Packaging Demand by Application & Food Format, 2012, 2017, 2022, &2027
- Table | Annual Dairy Packaging Demand by Application & Food Format, 2019 - 2026
- New Product Development
- Figure 15-4. Dairy Packaging: New Product Development Examples
- Key Suppliers
- Scope & Product Description
- Baked Goods Packaging
- Scope & Product Description
- Table | Industry Codes Related to Baked Goods
- Figure 16-1. Baked Goods Packaging: Product Examples
- Growth Drivers & Restraints
- Figure 16-2. Baked Goods Packaging Demand by Packaging Format, 2012, 2017, 2022, &2027
- Packaging Products
- Table | Baked Goods Packaging Demand by Product, 2012, 2017, 2022, &2027
- Table | Annual Baked Goods Packaging Demand by Product, 2019 - 2026
- Figure 16-3. Baked Goods: Comparative Value Growth for Packaging Products, 2022 - 2027
- Materials
- Table | Baked Goods Packaging Demand by Material, 2012, 2017, 2022, &2027
- Table | Annual Baked Goods Packaging Demand by Material, 2019 - 2026
- Applications (Bread, Cakes, Pies & Pastries, Cookies, Crackers) &Food Formats
- Table | Baked Goods Packaging Demand by Application & Food Format, 2012, 2017, 2022, &2027
- Table | Annual Baked Goods Packaging Demand by Application & Food Format, 2019 - 2026
- New Product Development
- Figure 16-4. Baked Goods Packaging: New Product Development Examples
- Key Suppliers
- Scope & Product Description
- Sauce & Condiment Packaging
- Scope & Product Description
- Table | Industry Codes Related to Sauces, Condiments, Dips, Dressings, &Jelly
- Figure 17-1. Sauce & Condiment Packaging: Product Examples
- Growth Drivers & Restraints
- Figure 17-2. Sauce & Condiment Packaging Demand by Packaging Format, 2012, 2017, 2022, &2027
- Packaging Products
- Table | Sauce & Condiment Packaging Demand by Product, 2012, 2017, 2022, &2027
- Table | Annual Sauce & Condiment Packaging Demand by Product, 2019 - 2026
- Figure 17-3. Sauces & Condiments: Comparative Value Growth for Packaging Products, 2022 - 2027
- Materials
- Table | Sauce & Condiment Packaging Demand by Material, 2012, 2017, 2022, &2027
- Table | Annual Sauce & Condiment Packaging Demand by Material, 2019 - 2026
- Applications (Condiments, Dressings & Dips, Sauces, Jams & Jellies) &Food Formats
- Table | Sauce & Condiment Packaging Demand by Application & Food Format, 2012, 2017, 2022, &2027
- Table | Annual Sauce & Condiment Packaging Demand by Application & Food Format, 2019 - 2026
- New Product Development
- Figure 17-4. Sauce & Condiment Packaging: New Product Development Examples
- Key Suppliers
- Scope & Product Description
- Processed Fruit & Vegetable Packaging
- Scope & Product Description
- Table | Industry Codes Related to Processed Fruits & Vegetables
- Figure 18-1. Processed Fruits & Vegetables Packaging: Product Examples
- Growth Drivers & Restraints
- Figure 18-2. Processed Fruits & Vegetables Packaging Demand by Packaging Format, 2012, 2017, 2022, &
- Packaging Products
- Table | Processed Fruits & Vegetables Packaging Demand by Product, 2012, 2017, 2022, &2027
- Table | Annual Processed Fruits & Vegetables Packaging Demand by Product, 2019 - 2026
- Figure 18-3. Processed Fruits & Vegetables: Comparative Value Growth for Packaging Products, 2022 -
- Materials
- Table | Processed Fruits & Vegetables Packaging Demand by Material, 2012, 2017, 2022, &2027
- Table | Annual Processed Fruits & Vegetables Packaging Demand by Material, 2019 - 2026
- Applications (Vegetables, Fruit, Dry Beans) &Food Formats
- Table | Processed Fruits & Vegetables Packaging Demand by Application & Food Format, 2012, 2017, 2022, &2027
- Table | Annual Processed Fruits & Vegetables Packaging Demand by Application & Food Format, 2019 - 2026
- New Product Development
- Figure 18-4. Processed Fruit & Vegetable Packaging: New Product Development Examples
- Key Suppliers
- Scope & Product Description
- Savory Snack Food Packaging
- Scope & Product Description
- Table | Industry Codes Related to Savory Snack Foods
- Figure 19-1. Savory Snack Food Packaging: Product Examples
- Growth Drivers & Restraints
- Figure 19-2. Savory Snack Packaging Demand by Packaging Format, 2012, 2017, 2022, &2027
- Packaging Products
- Table | Savory Snack Food Packaging Demand by Product, 2012, 2017, 2022, &2027
- Table | Annual Savory Snack Food Packaging Demand by Product, 2019 - 2026
- Figure 19-3. Savory Snack Foods: Comparative Value Growth for Packaging Products, 2022 - 2027
- Materials
- Table | Savory Snack Food Packaging Demand by Material, 2012, 2017, 2022, &2027
- Table | Annual Savory Snack Food Packaging Demand by Material, 2019 - 2026
- Applications (Chips, Snack Nuts, Popcorn, Jerky)
- Table | Savory Snack Food Packaging Demand by Application, 2012, 2017, 2022, &2027
- Table | Annual Savory Snack Food Packaging Demand by Application, 2019 - 2026
- New Product Development
- Figure 19-4. Savory Snack Packaging: New Product Development Examples
- Key Suppliers
- Scope & Product Description
- Candy & Confection Packaging
- Scope & Product Description
- Table | Industry Codes Related to Candy & Confections
- Figure 20-1. Candy & Confection Packaging: Product Examples
- Growth Drivers & Restraints
- Figure 20-2. Candy & Confection Packaging Demand by Packaging Format, 2012, 2017, 2022, &2027
- Packaging Products
- Table | Candy & Confection Packaging Demand by Product, 2012, 2017, 2022, &2027
- Table | Annual Candy & Confection Packaging Demand by Product, 2019 - 2026
- Figure 20-3. Candy & Confection: Comparative Value Growth for Packaging Products, 2022 - 2027
- Materials
- Table | Candy & Confection Packaging Demand by Material, 2012, 2017, 2022, &2027
- Table | Annual Candy & Confection Packaging Demand by Material, 2019 - 2026
- Applications (Chocolate Candy, Chewing Gum, Snack Bars)
- Table | Candy & Confection Packaging Demand by Application, 2012, 2017, 2022, &2027
- Table | Annual Candy & Confection Packaging Demand by Application, 2019 - 2026
- New Product Development
- Figure 20-4. Candy & Confection Packaging: New Product Development Examples
- Key Suppliers
- Scope & Product Description
- Other Food Packaging Applications
- Scope & Product Description
- Table | Industry Codes Related to Other Foods
- Figure 21-1. Other Food Packaging: Product Examples
- Packaging Products
- Table | Other Food Packaging Applications Demand by Product, 2012, 2017, 2022, &2027
- Table | Annual Other Food Packaging Applications Demand by Product, 2019 - 2026
- Figure 21-2. Other Food Packaging Demand by Packaging Format, 2012, 2017, 2022, &2027
- Figure 21-3. Other Food Packaging: Comparative Value Growth for Packaging Products, 2022 - 2027
- Materials
- Table | Other Food Packaging Applications Demand by Material, 2012, 2017, 2022, &2027
- Table | Annual Other Food Packaging Applications Demand by Material, 2019 - 2026
- Applications
- Table | Other Food Packaging Applications Demand by Application & Food Format, 2012, 2017, 2022, &2027
- Table | Annual Other Food Packaging Applications Demand by Application & Food Format, 2019 - 2026
- New Product Development
- Figure 21-4. Other Food Packaging: New Product Development Examples
- Key Suppliers
- Scope & Product Description
- Key Suppliers & Market Share
- Key Findings & Industry Composition
- Table | US Food Packaging Sales by Company, 2022
- Market Share
- Figure 22-1. US Food Packaging Market Share by Company, 2022
- Figure 22-2. US Food Packaging Market: Leading Supplier, 2022
- Figure 22-3. US Food Packaging Market: Second Leading Supplier, 2022
- Figure 22-4. US Food Packaging Market: Third Leading Supplier, 2022
- Figure 22-5. US Food Packaging Market: Fourth Leading Supplier, 2022
- Figure 22-6. US Food Packaging Market: Fifth Leading Supplier, 2022
- Figure 22-7. US Food Packaging Market: Sixth Leading Supplier, 2022
- Marketing & Distribution
- List of Industry Participants
- Table | Selected Industry Participants
- Key Findings & Industry Composition
- Appendix
- Report Details
- Table | Industry Codes Related to Food Packaging
- Table | Relevant HS Codes
- Definitions
- Abbreviations
- Table | Abbreviations & Acronyms Used in Study
- Freedonia Methodology
- Study-Specific Methodology
- Sources
- Associations & Agencies
- Related Studies & Reports
- Macroeconomic Assumptions
- Economic Environment
- Table | Macroeconomic Indicators, 2012, 2017, 2022, &2027
- Demographic Trends
- Table | Population & Households, 2012, 2017, 2022, &2027
- Consumer Spending
- Table | Personal Consumption Expenditures & Retail Sales, 2012, 2017, 2022, &2027
- Retail Sales
- Table | Nondurable Goods Retail Sales, 2012, 2017, 2022, &2027
- Economic Environment
- Report Details
The most significant materials utilized in food packaging are plastic, paper, metal, and glass, although several small volume materials are also used, including molded pulp, bamboo, sugarcane, mesh, cellulose, textiles (including nonwovens), and wood.
The primary determinant of pricing for food packaging is the cost of raw materials, which typically represent 50% to 60% of the final packaging price.
Demand for food packaging is forecast to grow 2.5% per year to $58.1 billion in 2027, with real growth of 1.2% annually to 540 billion units.
Food shipments, including fresh produce, are forecast to rise 2.6% per year to $746 billion in 2027, with real growth of 2.4% annually to $584 billion, adjusted for inflation.