US Window & Door Components
This report examines the US window and door components market by component type, market, window and door type, and window and door frame material in US dollars at the manufacturers’ level (i.e., excluding the value of features and services added between the manufacturer and end user).
Free Sample Report
Request a free sample of this report and our team will email it to you.
Report Overview
Shifting Standards: How Energy Efficiency is Transforming the Window and Door Components Market
As energy regulations tighten and consumers demand more sustainable solutions, manufacturers are innovating to produce windows and doors that offer superior insulation, lower energy costs, and compliance with green building standards.
Key Themes Covered in this Report
- Energy efficiency regulations, urbanization, and consumer preferences are driving demand for window and door components.
- The impact of advancements in materials and manufacturing processes and how they influence component selection and use.
- How changing aesthetic tastes and the demand for smart home integration are shaping the window and door components market.
Featuring 61 Tables and 43 Figures!
The US market for window and door components totaled $23.6 billion in 2024, and it is expected to increase 2.6% annually to $26.9 billion in 2029. This reflects a deceleration from the 2019-2024 period, when price surges during the latter part of that historical period led to strong market value growth. With prices stabilizing, real (inflation-adjusted) growth will be steady, supported by rising single-family construction and home renovation activity, as well as rising institutional and commercial building development. Across all markets, growth will be underpinned by ongoing demand for more functional, energy efficient, and durable windows and door systems.
Desire for More Energy-Efficient Windows Drives Use of Coatings & Insulating Components
Window components that can lower heating and cooling costs are becoming more popular for consumers and builders alike:
- The adoption of low-emissivity coatings is on the rise because they effectively reduce infrared and ultraviolet light penetration while maintaining optimal visible light transmission.
- Manufacturers are incorporating more insulating components per unit (e.g. adding a third pane of glass, warm-edge spacers, improved thermal breaks in frames, and higher-quality weatherstripping). For example, the 2021 International Energy Conservation Code and new ENERGY STAR 7.0 criteria are effectively making triple-pane glazing and advanced frame materials the norm in many climates.
Severe Weather Conditions Are Boosting Demand for Resilient Components
In regions that face extreme weather events, homeowners increasingly choose impact-resistant windows and door components like laminated glass and reinforced frames, sometimes beyond what codes require. These components are designed to meet stringent building codes and offer reliable protection against hurricanes and other severe weather conditions. As climate change drives heightened risks of damaging weather events, window manufacturers are also developing flood-resistant and wildfire-resistant materials to better protect homes in vulnerable areas.
Smart Technology Supporting Production of Automated & Secure Windows & Doors
The integration of smart technology into windows and doors is leading to the incorporation of higher-value components in these products. For example, IoT-enabled sensors are being added to windows, as are motorized blinds or shades within the unit itself, allowing for automation and remote monitoring. Additionally, entry doors increasingly feature smart locks and connected security hardware.
Historical Market Trends & Growth Drivers
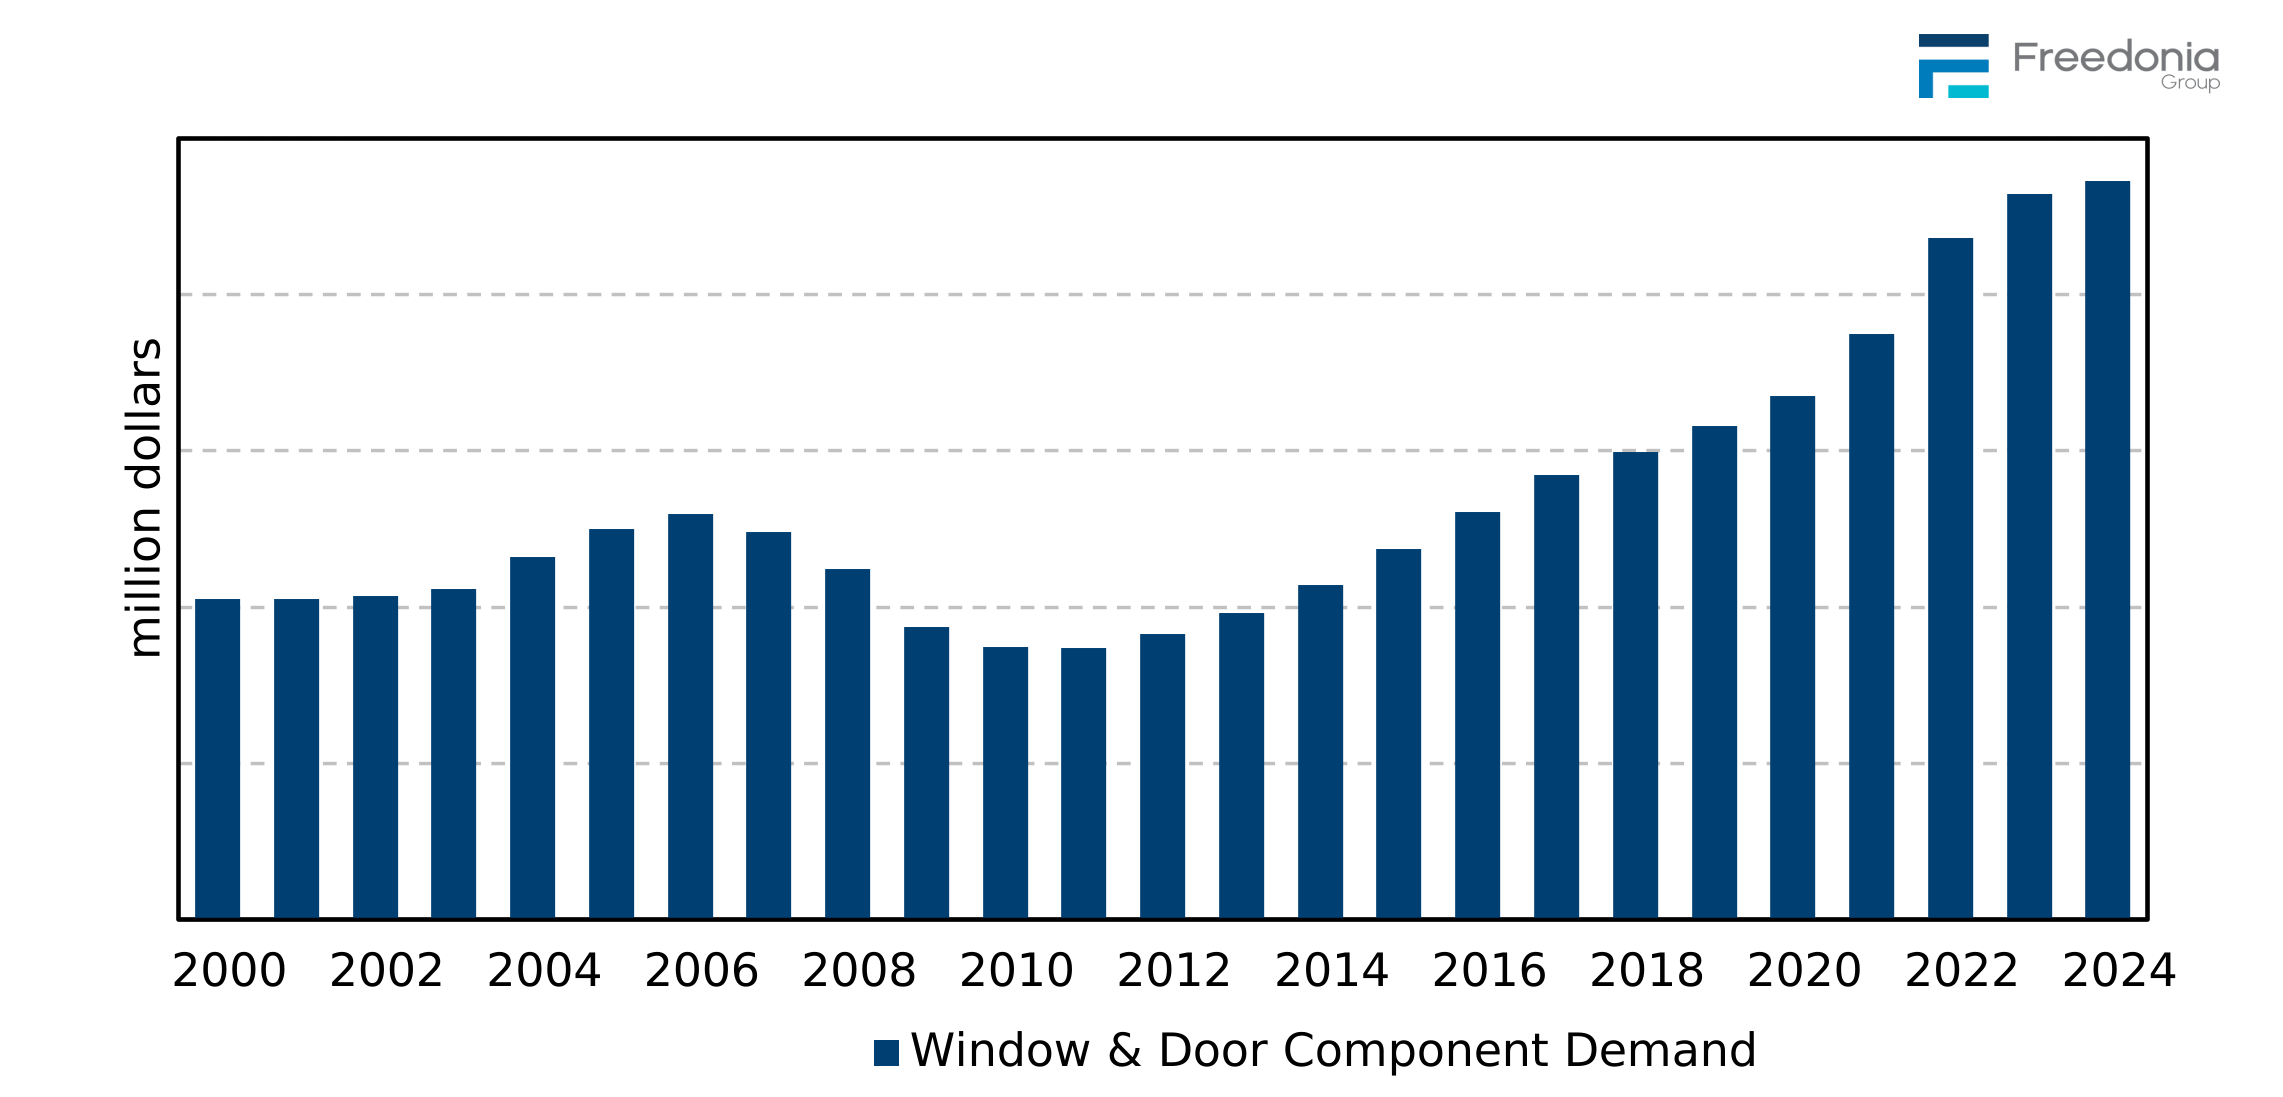
Demand for window and door components is closely tied to the types of window and door products that are produced and the level of overall window and door output each year.
Production of windows and doors is impacted significantly by general economic trends and the boom-and-bust nature of the US construction industry. Due to its cyclicality, spending on new building construction – and associated windows and doors and their components – is typically more volatile than in the replacement market.
Overall trends impacting window and door production, and thus related demand for components, include:
-
the overall health of the US economy
-
the current lending environment, including interest rates and credit requirements
-
trends in the construction of new single-family homes, multifamily residential buildings, high-rises, and commercial buildings
-
home values, which impact homeowners’ ability to use home equity loans to fund improvement projects (such as window and door replacement)
-
changing consumer preferences regarding style or material
-
government regulations and tax incentive programs like the Inflation Reduction Act, which grants tax credits to homeowners who replace older windows and doors with energy efficient products
-
outbreaks of severe weather, as heavy storms often damage windows and doors, boosting replacement sales
Demand for window and door components is also influenced by regulations and building standards, innovations in materials, energy efficiency standards, and shifts in architectural design trends. Additionally, supply chain dynamics, raw material costs, and advancements in manufacturing processes determine demand for specific component types.
Component Products Overview
Market Value
Demand for window and door components typically follows trends in the production of window and door units, which is influenced by the outlook for the overall building construction industry.
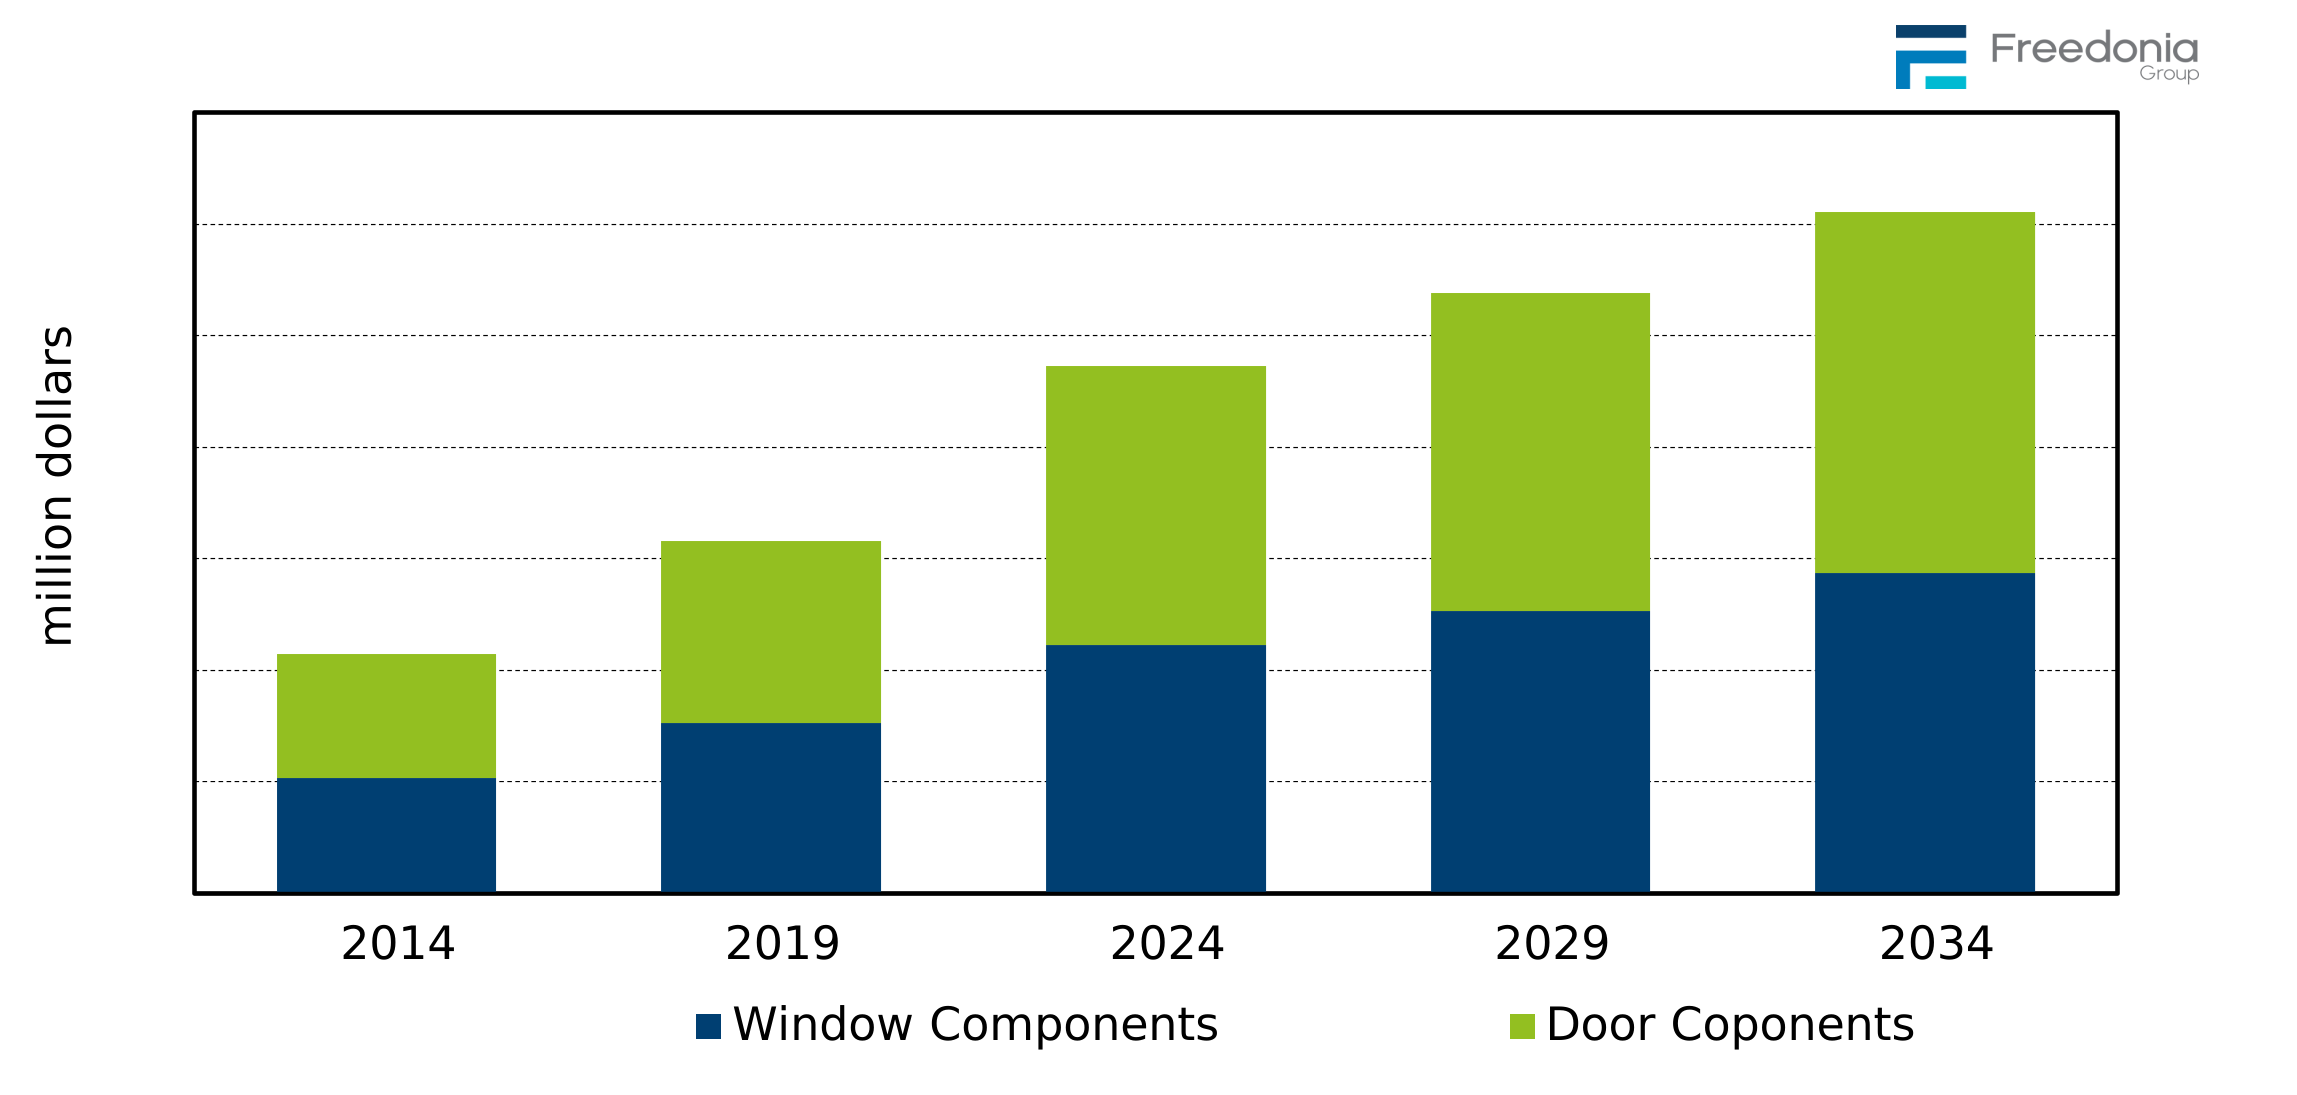
Demand for window and door components is forecast to increase 2.6% per year from $23.6 billion in 2024 to $26.9 billion in 2029, a deceleration from the 2019-2024 period when price surges in 2021, 2022, and 2023 drove market value gains. In real terms, demand will grow at a steady rate supported by increases in building construction activity, especially for single-family homes and institutional buildings such as schools and healthcare facilities. In addition to real demand gains, market value growth will be supported by:
-
homeowner interest in installing larger and more numerous windows and patio doors – which are assembled with bigger and pricier components – as a part of home renovation projects
-
continuing adoption of building codes that call for the use of windows and doors with enhanced energy efficiency or weather resistance, thereby promoting the use of insulated and higher-quality glass, frames, slabs, and other components (such as spacers and weatherstripping)
-
rising demand for more durable and impact-resistant fenestration products, which are assembled with costlier glazing and frame components
Door components account for the larger share of components demand value. This is largely attributable to:
-
the higher cost of components used to assemble door units (especially entry, patio, automated, and garage and overhead doors) compared to windows
-
the fact that both residential and commercial buildings typically feature more doors than windows
-
ubiquitous use of doors in industrial and other commercial structures that generally have very few windows
Among components, the leading market segments are generally those that are most expensive and used in nearly all windows or doors (e.g., frames, glass). Trends within particular product segments are determined by customer purchasing decisions in terms of:
-
window or door type and design (e.g., size of glazing area and frame)
-
level of energy efficiency and durability as well as the length of the unit’s expected lifespan
-
aesthetic factors, such as frame width, color options, and inclusion of decorative elements such as grilles
Rising interest among home and commercial building owners in higher-value windows and doors – such as units with larger glazing areas for more daylighting, improved energy efficiency, and more durable and impact-resistant frames – will increase demand for a number of components.
Building Construction Outlook
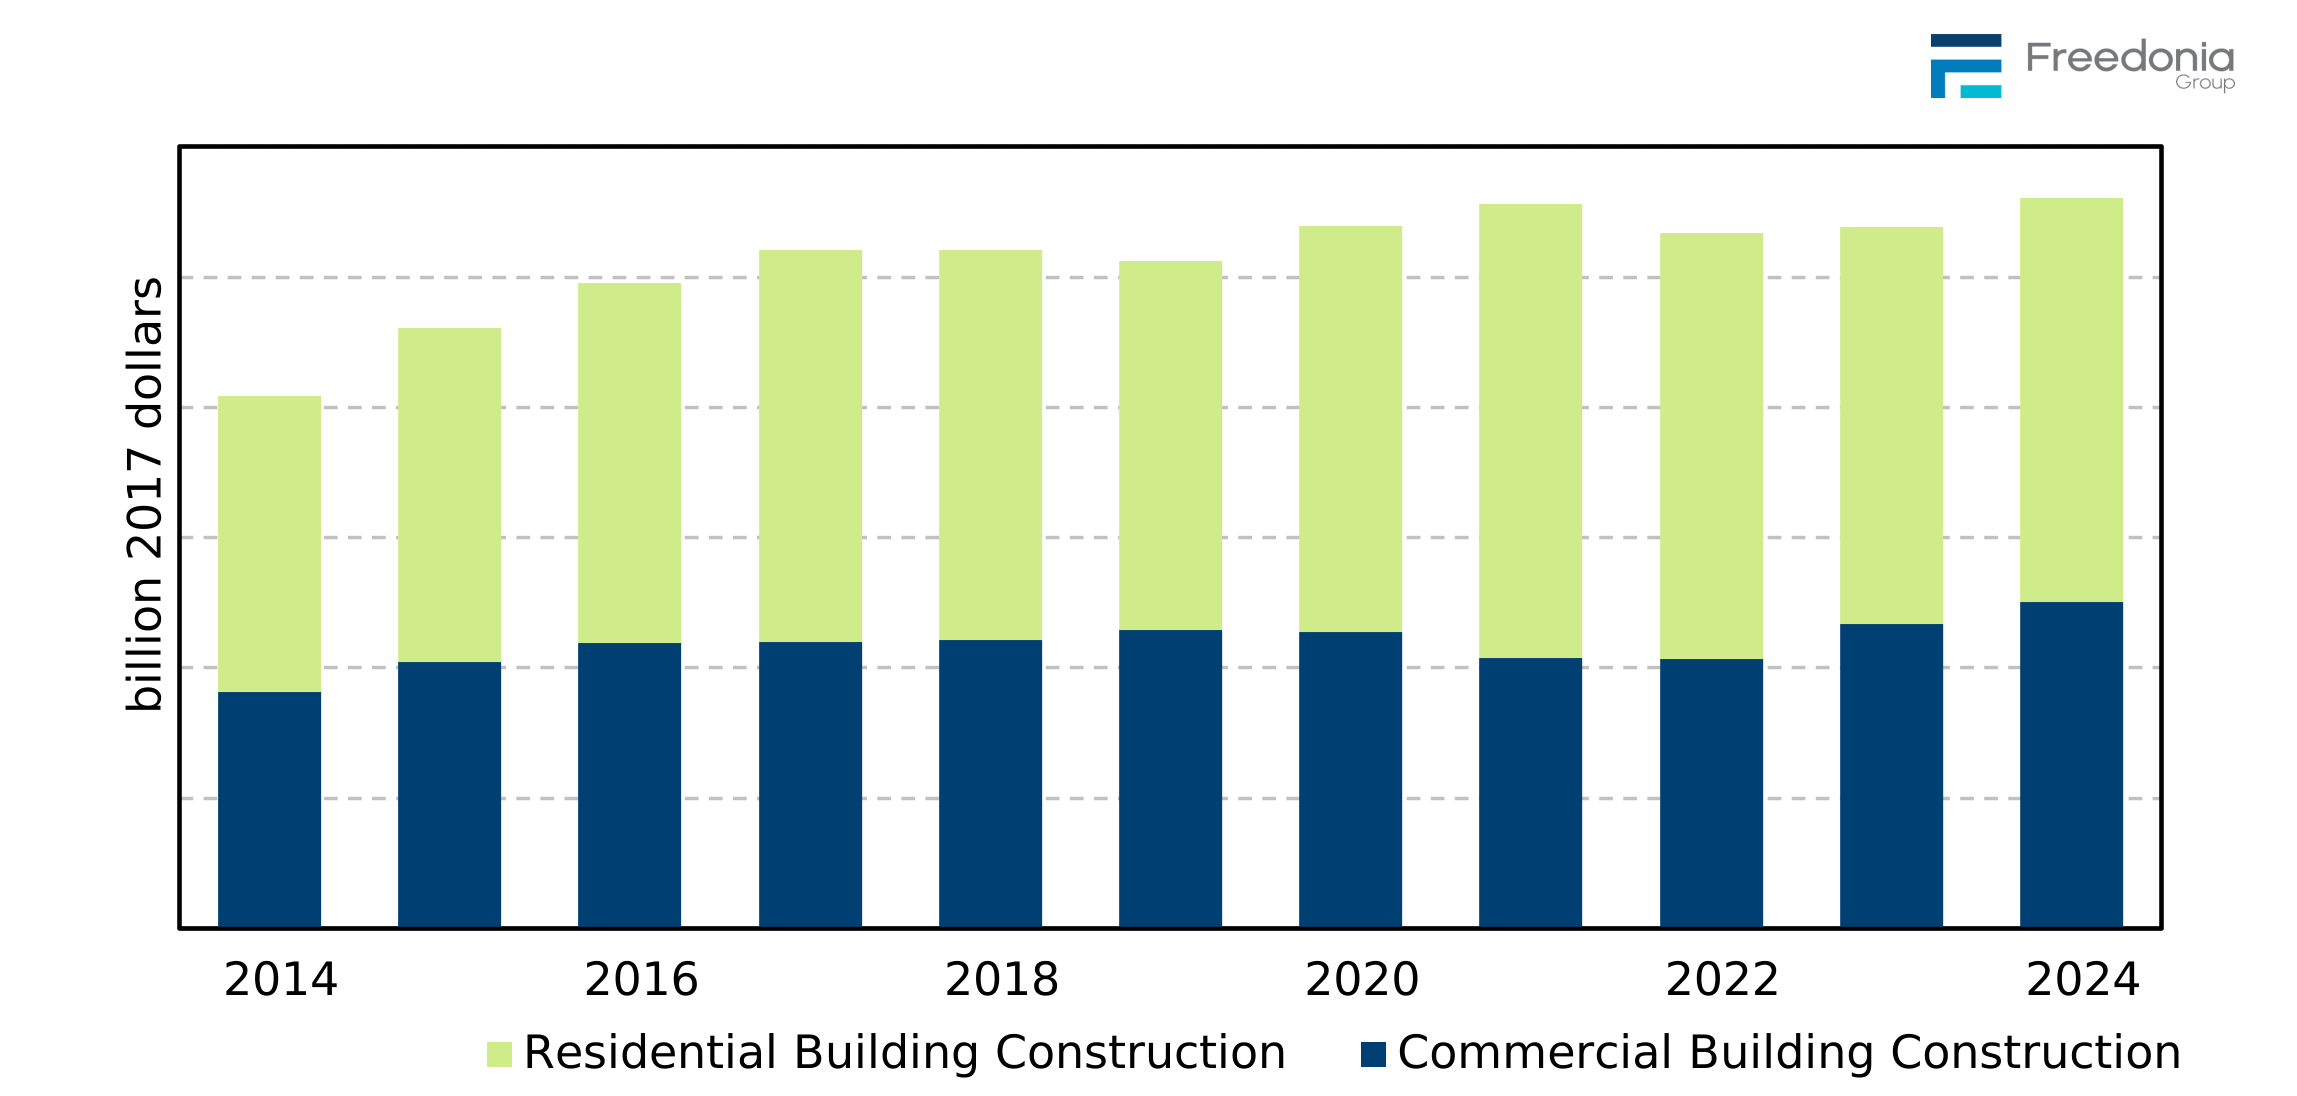
Demand for windows and doors – and the components used to manufacture them – relies heavily on trends in building construction, both new and repair and improvement activity. The types of buildings being constructed also influence the numbers and types of windows and doors used (e.g., residential versus commercial buildings).
Real building construction expenditures are forecast to rise 1.3% per year through 2029. Growth will be supported by an increase in housing starts, along with an increase in the construction of healthcare facilities and data centers.
Report Coverage for US Window & Door Components
| Current Total Market Size | $23.6 billion |
| Forecast Total Market Growth Rate | 2.6% CAGR from 2024-2029 |
| Historical Period | 2014-2024 |
| Forecast Period | 2024-2034 |
| Units Covered | |
| Regions | US |
| Countries Individually Covered | |
| Products | Frames (Jambs, Sills, and Heads) |
| Glass | |
| Door Slabs and Panels | |
| Window Sash (Railes, Stiles, Grilles) | |
| Screens | |
| Hardware (Locks, Latches, Hinges, and Other Hardware) | |
| Other Window and Door Components (Weatherstripping, Spacers) | |
| Markets | Original Equipment Manufacturers (OEMs), Aftermarket Residential, Commercial |
| Materials | Fiberglass, Metal, Vinyl, Wood |
| Point Where Data is Measured | Manufacturer’s Level |
| Additional Elements | Market Share in Total, Near Term Trend Analysis, Regulatory Trends, Mergers & Acquisitions, Cooperative Agreements, Windows & Doors Supply Chain |
Key Industry Participants Driving Trends
| Allegion | Jeld-Wen |
| Andersen | Miter Brands |
| ASSA ABLOY | Owens Corning (Masonite) |
| Cardinal Glass | Pella |
| Cornerstone | Quanex |
| Guardian Industries |
US Window & Door Components Report Scope
This report examines the US window and door components market by component type, market, window and door type, and window and door frame material in US dollars at the manufacturers’ level (i.e., excluding the value of features and services added between the manufacturer and end user). Historical data are provided for 2014, 2019, and 2024, and forecasts are given for 2029 and 2034.
The following components are included in the scope of this report:
-
components used in finished windows and doors manufactured by original equipment manufacturers (OEMs) for new construction and replacement applications
-
components that are separately sold in the aftermarket for improvement and repair purposes
The major window and door component segments are:
-
frames (i.e., jambs, sill, head pieces)
-
glass (including window glass and glass insets, sidelites, and transoms for doors), which encompasses:
-
insulated glass
-
gas-filled glass
-
low-emissivity (low-E) glass
-
impact-resistant glass
-
glass with other types of coatings, including heat-absorbing tints and reflective coatings
-
-
door slabs and panels, both of which refer to the part of the door that opens and closes and that fits within the frame (fixed panels for patio doors are also included here)
-
window sash (i.e., rails, stiles, and grilles –also known as muntins – that are sold as part of the panel)
-
screens, including those fitted within the window frame, either on the exterior or the interior, and the panels of screen doors and retractable screens, but excluding specialty screens (such as those that enclose covered patios) and the value of separately sold aftermarket parts (e.g., screen mesh)
-
hardware (locks, latches, handles, hinges, cranks, rollers, balance rods, and any other parts used to assemble and install fenestration)
-
all other components (e.g., aprons, astragals, between-the-glass blinds and shades, bumpers, separately sold grilles, mullions, glass spacers, door thresholds, weatherstrip, tracks and track covers)
Excluded from the scope of this report are products that are not considered part of the actual window or door, including:
-
adhesives, paint, and sealants
-
exterior blinds and curtains
-
flashing
-
moulding and trim
-
separately sold security systems, door openers, and doorbell systems
-
shutters
-
specialty screens, such as screen enclosures
-
separately sold screen mesh and smart window film
In addition, this study excludes components used in the manufacture of windows and doors for automobiles and other transportation equipment, cabinets, fencing gates, shower and bathroom stall doors, elevator doors, and pet doors.
- Executive Summary
- Figure 1-1. US Window & Door Components Market
- Short-Term Analysis
- Economic Forecast
- Table | Macroeconomic Indicators, 2023 - 2026 (billion 2017 dollars & billion dollars)
- Short-Term Construction Outlook
- Table | Construction Expenditures, 2023 - 2026 (billion 2017 dollars & billion dollars)
- Short-Term Window & Door Component Market Trends
- Table | Annual Window & Door Component Demand by Product & Market, 2022 - 2026 (million dollars)
- Figure 2-1. Annual Window & Door Component Demand, 2022 - 2026 (annual % change)
- Economic Forecast
- Overview
- Study Scope
- Figure 3-1. Window & Door Components: Product Examples
- Table | Descriptions of Selected Window & Door Components
- Historical Market Trends & Growth Drivers
- Table | Window & Door Component Demand, 2014 - 2024 (million dollars)
- Figure 3-2. Window & Door Component Demand, 2000 - 2024 (million dollars)
- Component Products Overview
- Market Value
- Table | Window & Door Component Demand by Product & Component Type, 2014, 2019, 2024, 2029, &2034 (million d
- Table | Annual Window & Door Component Demand by Product & Component Type, 2021 - 2028 (million dollars)
- Figure 3-3. Window & Door Component Demand by Type, 2014, 2019, 2024, 2029, &2034 (million dollars)
- Volume Demand
- Table | Selected Window & Door Component Demand, 2014, 2019, 2024, 2029, &2034 (million units, million squar
- Table | Annual Selected Window & Door Component Demand, 2021 - 2028 (million units, million square feet, mil
- Market Value
- Market Trends
- Residential vs Commercial
- Table | Window & Door Component Demand by End Use: Residential vs Commercial, 2014, 2019, 2024, 2029, &2034
- Table | Annual Window & Door Component Demand by End Use: Residential vs Commercial, 2021 - 2028 (million do
- Figure 3-4. Window & Door Component Demand by End Use: Residential vs Commercial, 2014, 2019, 2024,
- OEM vs Aftermarket
- Table | Window & Door Component Demand: OEM vs Aftermarket, 2014, 2019, 2024, 2029, &2034 (million dollars)
- Table | Annual Window & Door Component Demand: OEM vs Aftermarket, 2021 - 2028 (million dollars)
- Figure 3-5. Window & Door Component Demand: OEM vs Aftermarket, 2014, 2019, 2024, 2029, &2034 (milli
- OEM Window & Door Components
- Table | OEM Window & Door Component Demand by Component Type, 2014, 2019, 2024, 2029, &2034 (million dollars
- Figure 3-6. OEM Window & Door Component Demand by Component Type, 2014, 2019, 2024, 2029, &2034 (mil
- Aftermarket Window & Door Components
- Table | Aftermarket Window & Door Component Demand by Component Type, 2014, 2019, 2024, 2029, &2034 (million
- Figure 3-7. Aftermarket Window & Door Component Demand by Component Type, 2014, 2019, 2024, 2029, &2
- Residential vs Commercial
- Components Share of Window & Door Manufacturing Cost
- Figure 3-8. Component Share of OEM Window & Door Market Value by Component Type, 2024 (million dolla
- Materials Competition in Window & Door Frames
- Table | Window & Door Frame Demand by Material, 2014, 2019, 2024, 2029, &2034 (million dollars)
- Table | Annual Window & Door Frame Demand by Material, 2021 - 2028 (million dollars)
- Figure 3-9. Window & Door Frame Demand by Material, 2014, 2019, 2024, 2029, &2034 (million dollars)
- Pricing & Inflation
- Table | Selected Window & Door Component Prices, 2014, 2019, 2024, 2029, &2034 (dollars per square foot, dol
- Table | Annual Selected Window & Door Component Prices, 2021 - 2028 (dollars per square foot, dollars per un
- Figure 3-10. Average Window & Door Component Price Index, 2014 - 2029 (2023=100)
- Study Scope
- Factors Impacting Window & Door Components Demand
- Building Construction Outlook
- Table | Building Construction Expenditures, 2014, 2019, 2024, 2029, &2034 (billion 2017 dollars & billion do
- Figure 4-1. Building Construction Expenditures, 2014 - 2034 (billion 2017 dollars)
- Window & Door Production Trends
- Technology Trends & New Product Development
- Smart Glass (Electrochromic & Thermochromic Glass)
- Smart Home Integration Impacts Hardware
- Advanced Insulation/Vacuum-Insulated Glazing
- Advanced Security Features
- Window & Door Design Trends & Consumer Preferences
- Regulations & Government Incentives
- Building Codes
- Industry Standards & Specifications
- Sustainability Initiatives
- Recycling & Recycled Content
- Emissions Regulations
- Building Construction Outlook
- Frames (Jambs, Sills, &Heads)
- Scope & Product Description
- Figure 5-1. Window & Door Frames: Product Examples
- Total Window & Door Frame Demand
- Table | Window & Door Frame Demand by Product, 2014, 2019, 2024, 2029, &2034 (million dollars)
- Window Frames
- Table | Window Frame Demand by Window Type, 2014, 2019, 2024, 2029, &2034 (million dollars)
- Door Frames
- Table | Door Frame Demand by Door Type, 2014, 2019, 2024, 2029, &2034 (million dollars)
- Product Developments
- Steel-Reinforced Frames
- Figure 5-2. Steel-Reinforced Window & Door Frames: Product Examples
- Insulated Frames
- Figure 5-3. Insulated Window & Door Frames: Product Examples
- Steel-Reinforced Frames
- OEM vs. Aftermarket
- Table | Window & Door Frame Demand by Market, 2014, 2019, 2024, 2029, &2034 (million dollars)
- Key Suppliers
- Scope & Product Description
- Glass
- Scope & Product Description
- Figure 6-1. Window & Door Glass: Product Examples
- Total Window & Door Glass Demand
- Table | Window & Door Glass Demand by Product, 2014, 2019, 2024, 2029, &2034 (million dollars)
- Figure 6-2. Window & Door Glass Demand by Product, 2014, 2019, 2024, 2029, &2034 (million dollars)
- Window Glass
- Table | Window Glass Demand by Window Type, 2014, 2019, 2024, 2029, &2034 (million dollars)
- Door Glass
- Table | Door Glass Demand by Door Type, 2014, 2019, 2024, 2029, &2034 (million dollars)
- Product Developments
- Smart Window Glass
- Figure 6-3. Smart Window Glass: Product Examples
- Impact Resistance
- Figure 6-4. Impact-Resistant Windows: Share of Total Window Demand & Key Growth Drivers
- Smart Window Glass
- OEM vs. Aftermarket
- Table | Window & Door Glass Demand by Market, 2014, 2019, 2024, 2029, &2034 (million dollars)
- Key Suppliers
- Scope & Product Description
- Door Slabs & Panels
- Scope & Product Description
- Figure 7-1. Door Slabs & Panels: Product Examples
- Door Slab & Panel Demand
- Table | Door Slab & Panel Demand by Door Type, 2014, 2019, 2024, 2029, &2034 (million dollars)
- Figure 7-2. Door Slab & Panel Demand by Door Type, 2014, 2019, 2024, 2029, &2034 (million dollars)
- Product Developments
- Multifold & Multi-Panel Patio Doors
- Figure 7-3. Multifold & Multi-Panel Patio Doors: Product Examples
- Barn-Style Interior Doors
- Figure 7-4. Barn-Style Interior Doors: Product Examples
- Multifold & Multi-Panel Patio Doors
- OEM vs. Aftermarket
- Table | Door Slab & Panel Demand by Market, 2014, 2019, 2024, 2029, &2034 (million dollars)
- Key Suppliers
- Scope & Product Description
- Window Sash (Rails, Stiles, Grilles)
- Scope & Product Description
- Figure 8-1. Window Sashes: Product Examples
- Window Sash Demand
- Table | Window Sash Demand by Window Type, 2014, 2019, 2024, 2029, &2034 (million dollars)
- Figure 8-2. Window Sash Demand by Window Type, 2014, 2019, 2024, 2029, &2034 (million dollars)
- Product Developments: Modern Designs & Colors
- Figure 8-3. Window Sash Modern Designs & Colors: Product Examples
- OEM vs. Aftermarket
- Table | Window Sash Demand by Market, 2014, 2019, 2024, 2029, &2034 (million dollars)
- Suppliers
- Scope & Product Description
- Screens
- Scope & Product Description
- Figure 9-1. Window & Door Screens: Product Examples
- Total Window & Door Screen Demand
- Table | Window & Door Screen Demand by Product, 2014, 2019, 2024, 2029, &2034 (million dollars)
- Figure 9-2. Window & Door Screen Demand by Product, 2014, 2019, 2024, 2029, &2034 (million dollars)
- Window Screens
- Table | Window Screen Demand by Window Type, 2014, 2019, 2024, 2029, &2034 (million dollars)
- Door Screens
- Table | Door Screen Demand by Door Type, 2014, 2019, 2024, 2029, &2034 (million dollars)
- Product Developments: Retractable & Flexible Screens
- Figure 9-3. Retractable & Flexible Screens: Product Examples
- OEM vs. Aftermarket
- Table | Window & Door Screen Demand by Market, 2014, 2019, 2024, 2029, &2034 (million dollars)
- Key Suppliers
- Scope & Product Description
- Hardware (Locks, Latches, Hinges, &Other Hardware)
- Scope & Product Description
- Figure 10-1. Window & Door Hardware: Product Examples
- Total Window & Door Hardware Demand
- Table | Window & Door Hardware Demand by Product, 2014, 2019, 2024, 2029, &2034 (million dollars)
- Figure 10-2. Window & Door Hardware Demand by Product, 2014, 2019, 2024, 2029, &2034 (million dollar
- Product Developments: Smart Lock Technology
- Figure 10-3. Smart Lock Technology: Product Examples
- OEM vs. Aftermarket
- Table | Window & Door Hardware Demand by Market, 2014, 2019, 2024, 2029, &2034 (million dollars)
- Suppliers
- Scope & Product Description
- Other Window & Door Components (Weatherstripping, Spacers)
- Scope & Product Description
- Figure 11-1. Weatherstripping & Other Window & Door Components: Product Examples
- Figure 11-2. Other Window & Door Components: Product Examples
- Product Trends
- Demand by Type
- Table | Other Window & Door Component Demand by Product & Component Type, 2014, 2019, 2024, 2029, &2034 (mil
- Figure 11-3. Other Window & Door Component Demand by Component Type, 2014, 2019, 2024, 2029, &2034 (
- Weatherstripping
- Table | Weatherstripping Demand by Product, 2014, 2019, 2024, 2029, &2034 (million dollars)
- Spacers
- Table | Spacer Demand by Product & Material, 2014, 2019, 2024, 2029, &2034 (million dollars)
- All Other Components
- Table | All Other Window & Door Component Demand by Product, 2014, 2019, 2024, 2029, &2034 (million dollars)
- Demand by Type
- OEM vs. Aftermarket
- Table | Other Window & Door Component Demand by Market, 2014, 2019, 2024, 2029, &2034 (million dollars)
- Key Suppliers
- Scope & Product Description
- Industry Structure
- Key Findings & Industry Composition
- Table | US Window & Door Component Sales by Company, 2024 (million dollars)
- Market Share
- Figure 12-1. US Window & Door Component Market Share, 2024 (billion dollars)
- Figure 12-2. US Window & Door Component Market: Leading Supplier, 2024
- Figure 12-3. US Window & Door Component Market: Second Leading Supplier, 2024
- Figure 12-4. US Window & Door Component Market: Third Leading Supplier, 2024
- Figure 12-5. US Window & Door Component Market: Fourth Leading Supplier, 2024
- Figure 12-6. US Window & Door Component Market: Fifth Leading Supplier, 2024
- Windows & Door Supply Chain
- Figure 12-7. Window & Door Market Supply Chain
- Mergers & Acquisitions
- Table | Selected Mergers & Acquisitions
- Cooperative Agreements
- Table | Selected Cooperative Agreements
- List of Industry Participants
- Table | Selected Industry Participants
- Key Findings & Industry Composition
- Appendix
- Report Details
- Table | Relevant Industry Codes
- Table | Relevant Trade Codes
- Definitions
- Abbreviations
- Table | Abbreviations & Acronyms Used in Study
- Freedonia Methodology
- Study-Specific Methodology
- Sources
- Associations & Agencies
- Related Studies & Reports
- Macroeconomic Assumptions
- Economic Environment
- Table | Macroeconomic Indicators, 2014, 2019, 2024, 2029, &2034 (billion 2017 dollars)
- Demographic Trends
- Table | Population & Households, 2014, 2019, 2024, 2029, &2034 (million persons)
- Consumer Spending
- Table | Personal Consumption Expenditures, 2014, 2019, 2024, 2029, &2034 (billion 2017 dollars)
- Consumer Financing
- Table | Consumer Financing Environment, 2014 - 2024
- Building Construction
- Table | Building Construction Expenditures, 2014, 2019, 2024, 2029, &2034 (billion 2017 dollars & billion do
- Residential Building Construction
- Table | Residential Building Construction Expenditures, 2014, 2019, 2024, 2029, &2034 (billion 2017 dollars
- Residential Improvement & Repairs
- Table | Residential Improvement & Repair Expenditures, 2014, 2019, 2024, 2029, &2034 (billion 2017 dollars &
- Commercial Building Construction
- Table | Commercial Building Construction Expenditures, 2014, 2019, 2024, 2029, &2034 (billion 2017 dollars &
- Commercial Building Improvements & Repairs
- Table | Commercial Building Improvement & Repair Expenditures, 2014, 2019, 2024, 2029, &2034 (billion 2017 d
- Nonbuilding Construction Expenditures
- Table | Nonbuilding Construction Expenditures, 2014, 2019, 2024, 2029, &2034 (billion 2017 dollars & billion
- Housing Completions
- Table | New Housing Indicators, 2014, 2019, 2024, 2029, &2034 (thousand units)
- Economic Environment
- Report Details
In 2024 US demand for window and door components reached over $23 billion.
The US window and door component industry is experiencing significant shifts driven by several key trends.
The window and door components market is led by five companies – Cardinal Glass, MITER Brands, Andersen, Quanex, and JELD-WEN.