Report Overview
What opportunities are top for the flooring market?
-
Luxury vinyl tile
-
Increase in construction of new residential and nonresidential buildings
This Freedonia industry study analyzes the $242 billion global flooring industry. It presents historical demand data (2012, 2017, and 2022) and  forecasts (2027 and 2032) by product (carpets and rugs, resilient flooring, and nonresilient flooring), market (residential, nonresidential, transportation), application (new, remodeling) and major global region and country. Annual historical data and forecasts are also provided from 2019 to 2026. The study also evaluates company market share and competitive analysis on industry competitors including Mohawk Industries, Shaw, Tarkett, Gerflor Group, Interface, Oriental Weavers, and Engineered Floors.
Featuring 230 tables and 84 figures – available in Excel and Powerpoint! Learn More
See our discussion regarding Luxury Vinyl Flooring
Global demand for flooring is forecast to rise 4.5% per year to 26.1 billion square meters in 2027, driven by:
-
increased construction of new residential and nonresidential buildings, particularly in the Asia/Pacific region
-
higher spending on improvements and repairs to existing buildings in the US and Western Europe, especially among homeowners
-
greater use of finished floor coverings relative to total floor space as standards of living improve worldwide and the large US market trends toward hard surface floors rather than carpeting
-
rebounding motor vehicle production, boosting demand for carpeting in automobiles
However, the declining popularity of wall-to-wall carpeting and weak new housing outlooks in North America and Western Europe will restrain stronger advances.
Performance & Aesthetics Allow Luxury Vinyl Tile to Post Strong Sales Increases
Luxury vinyl tile (LVT), including SPC and WPC products, will gain market share through 2027, a continuation of trends during the 2017-2022 period. These products are durable, mimic popular aesthetics (such as stone and ceramics), and only cost slightly more than tufted carpeting; these factors have contributed greatly to LVT’s increased popularity in the US and Europe over the past decade. The US has been the major source of growth of these products, where demand for luxury vinyl tile has risen 33% annually since 2016.
The Asia/Pacific and Africa/Mideast Regions Account for Majority of Gains
In terms of area, the Asia/Pacific and Africa/Mideast regions are forecast to collectively account for 81% of absolute gains in flooring demand through 2027, with China alone counting for 30% of growth. The massive Chinese market will rebound as building construction activity improves following lockdown-related weakness in 2022, and strong advances are expected in India and Indonesia. In particular, ongoing industrialization will spur greater demand for flooring in commercial and industrial buildings in both regions.
Rising Motor Vehicle Production Aids Demand for Carpets & Rugs
Although carpet and rug demand will be restrained by a shift away from wall-to-wall tufted carpeting in markets like the US, notable gains will be incurred as motor vehicle production improves following difficulty during the pandemic. After weathering a sizable drop in production in 2020, a combination of supply chain issues – most notably a semiconductor shortage – and high interest rates in a number of countries restrained greater output growth. With most supply chain issues having either resolved themselves or eased significantly, production is poised to grow at a rate more in line with pre-pandemic periods. As such, demand for needlepunch carpeting, which accounts for the majority of transportation demand, will improve significantly.
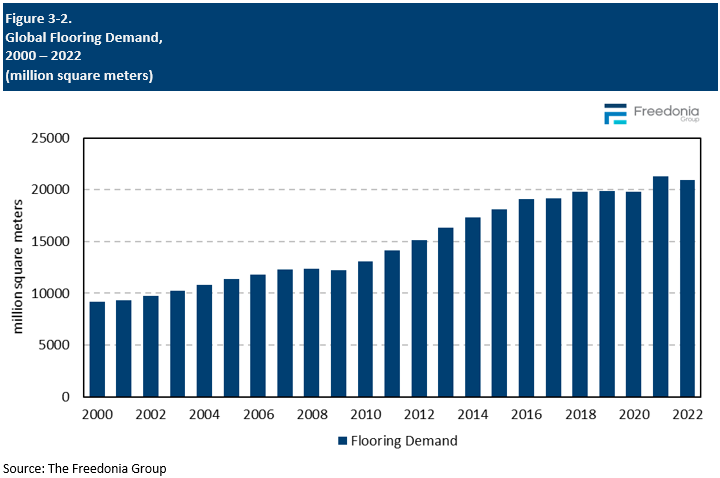
Historical Market Trends
Annual flooring demand is most heavily influenced by trends in the construction industry. Demand for flooring in volume terms is somewhat insulated from economic variations in new construction activity because of the significant replacement need in residential and nonresidential building applications:
-
A large base of installed flooring is subject to high levels of wear and will require replacement at some point as a matter of course.
-
Flooring may be damaged before the end of its lifespan by building fires or severe weather, requiring new flooring to be installed.
-
Flooring also serves a decorative purpose, so it may be replaced before the end of its product lifespan if a consumer desires to change the appearance of the structure in which they are installed.
-
Economic development in countries with lower incomes means that the number of homes without formal floor coverings is decreasing, providing more opportunities for flooring suppliers in times of lower construction activity.
However, due to currency and pricing effects, volatility in value terms can be quite significant. For example, from 2020 to 2022, pandemic-related supply chain issues and high raw material costs led to flooring price increases than in turn caused value demand to be somewhat less tethered to area demand.
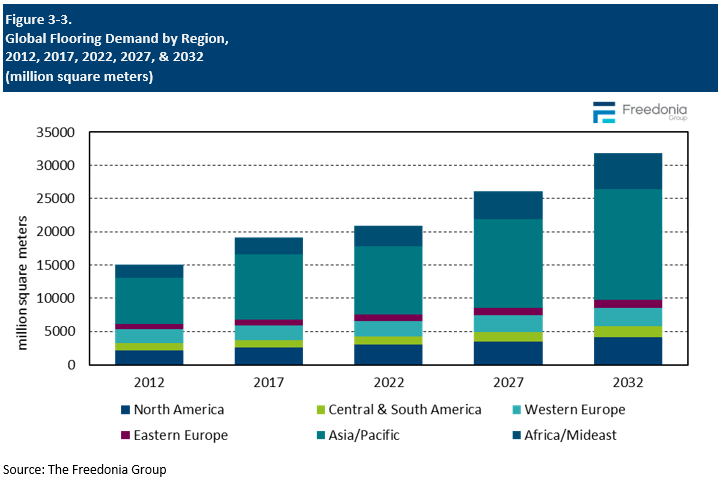
Area Demand by Region
Global demand for flooring is forecast to rise 4.5% per year to 26.1 billion square meters in 2027, driven by:
-
increased construction of new housing and nonresidential buildings
-
higher spending on improvements and repairs in existing buildings
-
greater use of finished floor coverings relative to total floor space as standards of living improve worldwide
Sales growth will be led by industrializing countries in the Asia/Pacific and Africa/Mideast regions, with China alone accounting for 30% of all global gains.
Demand growth in North America and Western Europe will be below average:
Sales growth in Western Europe will be fairly slow, reflecting the weak growth in construction activity expected in most of the region’s countries.
International Trade
While trade in flooring products is substantial in absolute terms, for many product types trade accounts for only a small share of the market. Products such as wood and ceramic tile (and, to an even greater extent, stone and marble) can be heavy and expensive to ship, giving an advantage to manufacturers sited close to centers of demand.
However, the share of global output traded across borders has grown in recent years, in part due to greater market share for vinyl flooring, which is lightweight compared to most other product types. Lighter weight also contributes to substantial trade in rugs.
China is expected to remain the world’s largest exporter of flooring products:
-
The country’s abundant clay resources support sizable production of commodity-grade ceramic flooring, which will allow Chinese producers to supply a significant share of the growth expected in developing countries worldwide.
-
China is a major producer of wood and vinyl flooring and tufted and woven carpets and rugs, making it a competitor in developed nations as well.
Other notable flooring exporters include:
-
Spain and Italy, which export ceramic tile throughout Europe, North Africa, and the Mideast
-
Turkey and India, which are significant exporters of carpets and rugs
-
Brazil, which exports wood and ceramic flooring
-
South Korea, a leading supplier of vinyl flooring
The majority of countries worldwide are net importers of flooring. The US had the largest trade deficit in 2022. Many countries in Western Europe – including the UK, France, and Germany – as well as Canada are also major net importers of flooring products.
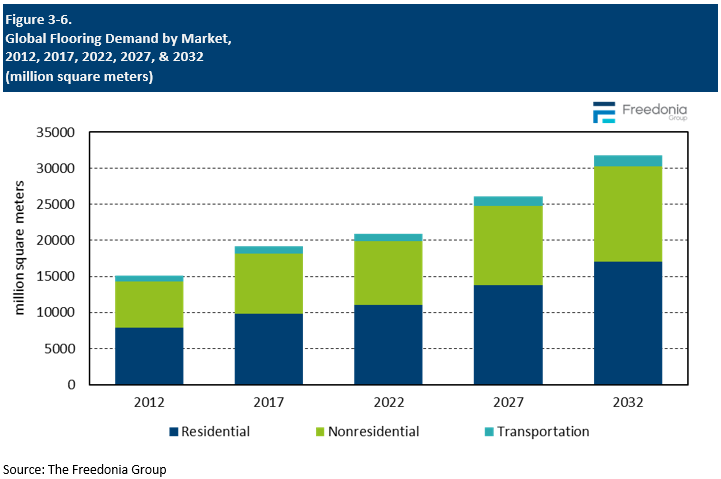
Demand by Market
Flooring products are primarily installed in residential and nonresidential buildings, with lesser demand in transportation equipment:
-
The residential market includes single-family homes, multifamily structures, and manufactured housing.
-
The nonresidential market comprises office and commercial, institutional, industrial, and other facilities.
-
Among the major applications in the transportation market are freight vehicles (e.g., trucks, ships, and rail cars) and fleet vehicles (e.g., taxi cabs and police cars).
-
Hard surface flooring is also used to a lesser extent in light vehicles, recreational vehicles (RVs), recreational boats, and aircraft.
Since the main use of flooring is in buildings, the primary factor determining flooring demand is building construction activity, both new construction and replacement projects. Replacement and remodeling activity has the most significant influence on floor covering sales, as most flooring is installed as part of repair or renovation projects.
Flooring demand is expected to increase across all major market segments:
-
In the residential market, gains will be driven by growing residential building construction in the Asia/Pacific and Africa/Mideast regions, along with continued spending on home renovations in the US and Western Europe. Stronger demand growth will be restrained by a decline in new home construction in Eastern Europe and stagnant home construction in Western Europe and North America.
-
Demand growth for flooring in the nonresidential segment will be bolstered by strong growth in nonresidential building construction in China and India.
-
Flooring demand in the transportation market will rebound in tandem with global motor vehicle production.