Need immediate assistance? Call 1 800.927.5900 or Contact Us
Demand for pipe in the US is projected to climb 2.9% per year through 2024 to $47.4 billion, rebounding from a low 2019 base. Increases in water and sewer construction spending will be a major driver of growth. On the other hand, a weaker economic outlook will depress construction and oil and gas drilling activity for some time, constraining demand in these major applications for pipe.
The COVID-19 pandemic has altered consumer behavior and shopping patterns, and a number of these shifts are expected to continue after the pandemic ends, which will support demand for pipe-intensive home appliances:
America’s Water and Infrastructure Act of 2018 has already funded several billion dollars in much needed improvements to the US potable water supply and wastewater disposal infrastructure. Nevertheless, much of the pipe currently in service is at the end of its useful life or has passed it. In May 2020, an update to the 2018 law was introduced in the US Senate. These and other measures are expected to support increases in water and sewer pipe demand, as states and municipalities acquire federal funding to replace aging pipelines.
Plastic pipe such as PVC and HDPE will continue to gain share over other material types in many markets due to such benefits as corrosion resistance – key for such applications as sewers and buried pipe applications with acidic soils – flexibility, which is important for trenchless installation, and low cost per linear foot due to their light weight. In addition, pipe replacement projects are expected to benefit suppliers of plastic pipe. Many communities are facing the replacement of aging water and sewer infrastructure, resulting in good growth for these sizable end markets for PVC and HDPE pipe.
In January 2020, Tenaris completed its acquisition of IPSCO Tubulars, a division of TMK (Russia). Tenaris’ resulting position in the US steel pipe market will make it over twice as large as its nearest competitor in steel, Zekelman Industries. Although the pipe industry has historically supported both small and large firms, the biggest companies are an increasing share of the market.
1. Executive Summary
2. Overview
Study Scope
Demand by Market
Market Value
Demand in Linear Feet
Demand in Pounds
Demand by Material
Market Value
Demand in Linear Feet
Demand in Pounds
Trade & Tariffs
Pricing Trends
Impact of COVID-19 on the Pipe Industry
Sustainability, Recycling, & Reuse
3. Oil & Gas Pipe
Market Scope & Definitions
Factors Impacting Oil & Gas Pipe Demand
Drilling & Hydraulic Fracturing Regulations
Oil & Gas Pipeline Construction
Oil & Gas Pipe Demand Outlook
Oil & Gas Pipe Demand by Material
Plastic Oil & Gas Pipe by Resin
Steel OCTG & Line Pipe
Demand by Application
Oil & Gas Drilling Pipe
Oil & Gas Transmission Pipe
Natural Gas Distribution Pipe
Oil & Gas Pipe Suppliers
4. Potable Water Pipe
Market Scope & Definitions
Potable Water Infrastructure Construction Overview
Potable Water Pipe Demand Outlook
Demand by Material
Plastic Potable Water Pipe Demand by Resin
Demand by Application
Water Transmission Pipe
Water Distribution Pipe
Service Pipe & Rural Water Pipe
5. Storm & Sanitary Sewer Pipe
Market Scope & Definitions
Sewer Infrastructure Construction Overview
Sewer Pipe Demand Outlook
Demand by Material
Plastic Storm & Sewer Pipe Demand by Resin
Demand by Market Sector
Storm Sewer Pipe
Sanitary Sewer Pipe
6. Conduit Pipe
Market Scope & Definitions
Telecommunications Construction Overview
Conduit Pipe Demand Outlook
Demand by Material
Conduit Plastic Pipe Demand by Resin
7. Industrial Processing Pipe
Market Scope & Definitions
Process Manufacturing Outlook
Process Pipe Demand Outlook
Demand by Material
Plastic Process Pipe Demand by Resin
8. Drain, Waste, Vent (DWV) Pipe
Scope & Definitions
Building Construction Outlook
Drain, Waste, Vent Pipe Demand Outlook
Demand by Material
Plastic Drain, Waste, Vent Pipe Demand by Resin
9. Irrigation Pipe
Scope & Definitions
Agricultural Industry & Land Usage Trends
Irrigation Pipe Demand Outlook
Demand by Material
Plastic Irrigation Pipe Demand by Resin
10. Structural & Mechanical Pipe
Scope & Definitions
Factors Impacting Pipe Demand
Structural & Mechanical Pipe Demand Outlook
Demand by Material
Plastic Structural & Mechanical Pipe Demand by Resin
Mechanical Pipe Demand by Application
Refrigeration Equipment & Appliances
Transportation Equipment
Other Mechanical Pipe Applications
11. Metal Pipe
Scope & Definitions
Demand by Material
Steel Pipe
Supply & Demand
Demand by Market
Steel Pipe Applications, Drivers, & Restraints
Market Share
Copper Pipe
Demand by Market
Market Share
Ductile Iron Pipe
Demand by Market
Market Share
Aluminum Pipe
Demand by Market
Aluminum Pipe Applications, Drivers, & Restraints
Market Share
Other Metal Pipe (Titanium, Nickel)
Demand by Market
Market Share
12. Plastic Pipe
Scope & Definitions
Plastic Pipe Applications, Drivers, & Restraints
Demand by Resin
Demand Overview
PVC
HDPE
PEX
CPVC
Fiberglass
ABS
Other Resins (Polypropylene, LDPE, Other)
Demand by Market
Market Share
13. Concrete & Clay Pipe
Concrete
Scope & Definition
Demand by Market
Market Share
Clay
Scope & Definition
Demand by Market
Suppliers
14. Industry Structure
Key Findings & Industry Composition
Market Share
Mergers & Acquisitions
List of Industry Participants
15. Appendix
Scope
Definitions
Abbreviations
Freedonia Methodology
Study-Specific Methodology
Sources
Associations & Agencies
Related Studies & Reports
Macroeconomic Assumptions
Economic Environment
Demographic Trends
Residential Building Construction
Commercial Building Construction
Nonbuilding Construction Expenditures
2. Overview
Table 2-1 | Pipe Demand by Market, 2009 - 2029 (million dollars)
Table 2-2 | Pipe Demand by Market, 2009 - 2029 (million linear feet)
Table 2-3 | Pipe Demand by Market, 2009 - 2029 (million pounds)
Table 2-4 | Pipe Demand by Material, 2009 - 2029 (million dollars)
Table 2-5 | Pipe Demand by Material, 2009 - 2029 (million linear feet & million dollars)
Table 2-6 | Pipe Demand by Material, 2009 - 2029 (million pounds & million dollars)
Table 2-7 | Average Pipe Prices by Material, 2009 - 2029 (dollars per pound & dollars per linear foot)
3. Oil & Gas Pipe
Table 3-1 | OCTG & Line Pipe Applications & Definitions
Table 3-2 | Oil & Natural Gas Pipe Demand by Application, 2009 - 2029 (million dollars, million pounds, & million linear feet)
Table 3-3 | Oil & Natural Gas Pipe Demand by Material, 2009 - 2029 (million dollars)
Table 3-4 | Plastic Oil & Natural Gas Pipe Demand by Resin, 2009 - 2029 (million dollars)
Table 3-5 | Steel Oil & Natural Gas Pipe Demand by Application, 2009 - 2029 (million dollars)
Table 3-6 | Oil & Gas Drilling Pipe Demand by Material, 2009 - 2029 (million dollars)
Table 3-7 | Oil & Gas Transmission Pipe Demand by Material, 2009 - 2029 (million dollars)
Table 3-8 | Natural Gas Distribution Pipe Demand by Material, 2009 - 2029 (million dollars)
4. Potable Water Pipe
Table 4-1 | Potable Water Applications & Definitions
Table 4-2 | Potable Water Pipe Demand by Application, 2009 - 2029 (million dollars, million pounds, & million linear feet)
Table 4-3 | Potable Water Pipe Demand by Material, 2009 - 2029 (million dollars)
Table 4-4 | Plastic Potable Water Pipe Demand by Resin, 2009 - 2029 (million dollars)
Table 4-5 | Water Transmission Pipe Demand by Material, 2009 - 2029 (million dollars)
Table 4-6 | Water Distribution Pipe Demand by Material, 2009 - 2029 (million dollars)
Table 4-7 | Other Potable Water Pipe Demand by Material, 2009 - 2029 (million dollars)
5. Storm & Sanitary Sewer Pipe
Table 5-1 | Storm & Sanitary Sewer Pipe Demand by Application, 2009 - 2029 (million dollars, million pounds, & million linear feet)
Table 5-2 | Storm & Sanitary Sewer Pipe Demand by Material, 2009 - 2029 (million dollars)
Table 5-3 | Plastic Storm & Sanitary Sewer Pipe Demand by Resin, 2009 - 2029 (million dollars)
Table 5-4 | Storm Sewer Pipe Demand by Material, 2009 - 2029 (million dollars)
Table 5-5 | Sanitary Sewer Pipe Demand by Material, 2009 - 2029 (million dollars)
6. Conduit Pipe
Table 6-1 | Conduit Pipe Demand, 2009 - 2029 (million dollars, million pounds, & million linear feet)
Table 6-2 | Conduit Pipe Demand by Material, 2009 - 2029 (million dollars)
Table 6-3 | Plastic Conduit Pipe Demand by Resin, 2009 - 2029 (million dollars)
7. Industrial Processing Pipe
Table 7-1 | Industrial Processing Pipe Demand, 2009 - 2029 (million dollars, million pounds, & million linear feet)
Table 7-2 | Industrial Processing Pipe Demand by Material, 2009 - 2029 (million dollars)
Table 7-3 | Plastic Industrial Processing Pipe Demand by Resin, 2009 - 2029 (million dollars)
8. Drain, Waste, Vent (DWV) Pipe
Table 8-1 | Building Construction Expenditures, 2009 - 2029 (billion 2012 dollars & billion dollars)
Table 8-2 | Drain, Waste, & Vent Pipe Demand, 2009 - 2029 (million dollars, million pounds, & million linear feet)
Table 8-3 | Drain, Waste, & Vent Pipe Demand by Material, 2009 - 2029 (million dollars)
Table 8-4 | Plastic Drain, Waste, & Vent Pipe Demand by Resin, 2009 - 2029 (million dollars)
9. Irrigation Pipe
Table 9-1 | Irrigation Pipe Demand by Material, 2009 - 2029 (million dollars, million pounds, & million linear feet)
Table 9-2 | Irrigation Pipe Demand by Material, 2009 - 2029 (million dollars)
Table 9-3 | Plastic Irrigation Pipe Demand by Resin, 2009 - 2029 (million dollars)
10. Structural & Mechanical Pipe
Table 10-1 | Structural & Mechanical Pipe Demand by Application, 2009 - 2029 (million dollars, million pounds, & million linear feet)
Table 10-2 | Structural & Mechanical Pipe Demand by Material, 2009 - 2029 (million dollars)
Table 10-3 | Plastic Structural & Mechanical Pipe Demand by Resin, 2009 - 2029 (million dollars)
11. Metal Pipe
Table 11-1 | Metal Pipe Demand by Material, 2009 - 2029 (million dollars, million pounds, & million linear feet)
Table 11-2 | Steel Pipe Supply & Demand, 2009 - 2029 (million dollars)
Table 11-3 | Steel Pipe Demand by Market, 2009 - 2029 (million dollars, million pounds, & million linear feet)
Table 11-4 | Steel Pipe Markets: Major Applications, Drivers, & Restraints
Table 11-5 | Copper Pipe Demand by Market, 2009 - 2029 (million dollars, million pounds, & million linear feet)
Table 11-6 | Ductile Iron Pipe Demand by Market, 2009 - 2029 (million dollars, million pounds, & million linear feet)
Table 11-7 | Aluminum Pipe Demand by Market, 2009 - 2029 (million dollars, million pounds, & million linear feet)
Table 11-8 | Aluminum Pipe Markets: Major Applications, Drivers, & Restraints
Table 11-9 | Other Nonferrous Metal Pipe Demand by Market, 2009 - 2029 (million dollars, million pounds, & million linear feet)
12. Plastic Pipe
Table 12-1 | Plastic Pipe Markets: Major Applications, Drivers, & Restraints
Table 12-2 | Plastic Pipe Demand by Resin, 2009 - 2029 (million dollars, million pounds, & million linear feet)
Table 12-3 | PVC Pipe Demand by Market, 2009 - 2029 (million dollars, million pounds, & million linear feet)
Table 12-4 | PVC Pipe: Performance Against Competitive Materials by Market
Table 12-5 | HDPE Pipe Demand by Market, 2009 - 2029 (million dollars, million pounds, & million linear feet)
Table 12-6 | HDPE Pipe: Performance Against Competitive Materials by Market
Table 12-7 | PEX Pipe Demand by Market, 2009 - 2029 (million dollars, million pounds, & million linear feet)
Table 12-8 | PEX Pipe Performance Against Competitive Materials by Market
Table 12-9 | CPVC Pipe Demand by Market, 2009 - 2029 (million dollars, million pounds, & million linear feet)
Table 12-10 | CPVC Pipe Performance Against Competitive Materials by Market
Table 12-11 | Fiberglass Pipe Demand by Market, 2009 - 2029 (million dollars, million pounds, & million linear feet)
Table 12-12 | Fiberglass Pipe: Performance Against Competitive Materials by Market
Table 12-13 | ABS Pipe Demand by Market, 2009 - 2029 (million dollars, million pounds, & million linear feet)
Table 12-14 | ABS Pipe: Performance Against Competitive Materials by Market
Table 12-15 | Other Plastic Pipe Demand by Resin & Market, 2009 - 2029 (million dollars, million pounds, & million linear feet)
Table 12-16 | Plastic Pipe Demand by Market, 2009 - 2029 (million dollars)
13. Concrete & Clay Pipe
Table 13-1 | Concrete Pipe Demand by Market, 2009 - 2029 (million dollars, million pounds, & million linear feet)
Table 13-2 | Clay Pipe Demand by Market, 2009 - 2029 (million dollars, million pounds, & million linear feet)
14. Industry Structure
Table 14-1 | US Pipe Sales by Company, 2019 (million dollars)
Table 14-2 | Selected Mergers & Acquisitions
Table 14-3 | Selected Industry Participants
15. Appendix
Table 15-1 | Relevant Industry Codes
Table 15-2 | Relevant HS Codes
Table 15-3 | Abbreviations & Acronyms Used in Study
Table 15-4 | Macroeconomic Indicators, 2009 - 2029 (billion 2012 dollars)
Table 15-5 | Population & Households, 2009 - 2029 (millions)
Table 15-6 | Residential Building Construction Expenditures, 2009 - 2029 (billion 2012 dollars & billion dollars)
Table 15-7 | Commercial Building Construction Expenditures, 2009 - 2029 (billion 2012 dollars & billion dollars)
Table 15-8 | Nonbuilding Construction Expenditures, 2009 - 2029 (billion 2012 dollars & billion dollars)
1. Executive Summary
Figure 1-1 | US Pipe Products Market
2. Overview
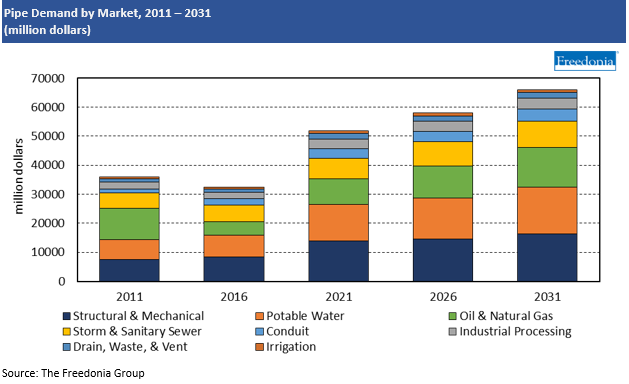
Figure 2-1 | Pipe Demand by Market, 2009 - 2029 (million dollars)
10. Structural & Mechanical Pipe
Figure 10-1 | Refrigeration Equipment & Appliance Pipe Demand, 2009 - 2024 (million dollars)
Figure 10-2 | Transportation Equipment Pipe Demand, 2009 - 2024 (million dollars)
Figure 10-3 | Other Structural & Mechanical Pipe Demand, 2009 - 2024 (million dollars)
11. Metal Pipe
Figure 11-1 | Steel Pipe Market Share by Company, 2019 (billion dollars)
Figure 11-2 | Copper Pipe Demand by Market, 2009 - 2029 (million dollars)
Figure 11-3 | Copper Pipe Market Share by Company, 2019 (billion dollars)
Figure 11-4 | Ductile Iron Pipe Demand by Market, 2009 - 2029 (million dollars)
Figure 11-5 | Ductile Iron Pipe Market Share by Company, 2019 (billion dollars)
Figure 11-6 | Aluminum Pipe Demand by Market, 2009 - 2029 (million dollars)
Figure 11-7 | Aluminum Pipe Market Share by Company, 2019 (billion dollars)
Figure 11-8 | Other Nonferrous Metal Pipe Demand by Market, 2009 - 2029 (million dollars)
Figure 11-9 | Other Nonferrous Metal Pipe Market Share by Company, 2019 (million dollars)
12. Plastic Pipe
Figure 12-1 | Plastic Pipe Demand by Market, 2009 - 2029 (million dollars)
Figure 12-2 | Plastic Pipe Market Share by Company, 2019 (billion dollars)
13. Concrete & Clay Pipe
Figure 13-1 | Concrete Pipe Demand by Market, 2009 - 2029 (million dollars)
Figure 13-2 | Concrete Pipe Market Share by Company, 2019 (billion dollars)
Figure 13-3 | Clay Pipe Demand by Market, 2009 - 2029 (million dollars)
14. Industry Structure
Figure 14-1 | US Pipe Market Share by Company, 2019 (billion dollars)
Figure 14-2 | US Pipe Market: Leading Supplier, 2019
Figure 14-3 | US Pipe Market: Second Leading Supplier, 2019
Figure 14-4 | US Pipe Market: Third Leading Supplier, 2019
Figure 14-5 | US Pipe Market: Fourth Leading Supplier, 2019
15. Appendix
Figure 15-1 | Annual Growth in Real GDP, 2000 - 2019, Compared to 1980 - 2005 Average (percent)
Figure 15-2 | Annual Population Growth, 2004 - 2019 (percent)
© by The Freedonia Group, a division of MarketResearch.com