Report Overview
Featuring 75 tables and 44 figures – now available in Excel and Powerpoint! Learn More

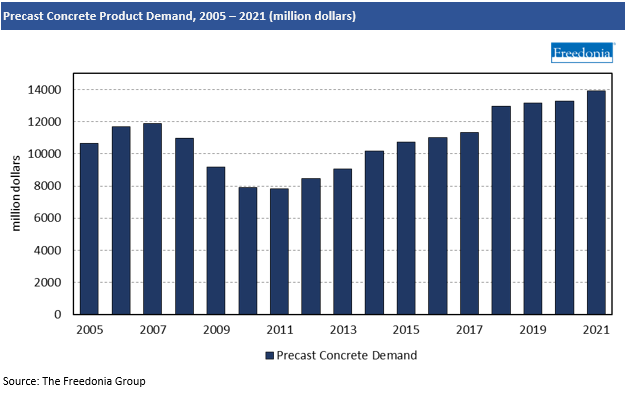
Through 2026, demand for precast concrete products is forecast to increase 5.9% per year to $18.5 billion. Gains will be driven by:
- increased commercial building construction
- a massive influx of federal funding for infrastructure projects
- the rising specification of precast concrete over competitive products because of its durability, strength, ease of installation, and ability to be customized
Commercial Building Market to Drive Demand Growth
Commercial buildings are the most important outlet for precast concrete products, as both the leading market and one of the fastest growing through 2026. Strong opportunities for demand in this market stem from:
- a rebound in underlying construction following losses during the pandemic
- greater use of precast concrete at the expense of competing materials
Precast concrete products are increasingly specified during the construction of a variety of commercial structures (including high-rise offices, hotels, and industrial buildings) because of their durability and uniformity, which is particularly important for large commercial buildings that require significant volumes of materials because it can speed construction. As skilled labor becomes more expensive and difficult to come by, efficiencies offered by precast products are growing in importance.
Infrastructure Law to Boost Precast Concrete Demand
Precast concrete product demand will be bolstered by the Infrastructure Investment & Jobs Act, which was passed in late 2021 and allocates $1 trillion (over eight years) for a wide array of infrastructure related projects around the US. Many of these projects – including the renovation of bridges, railroads, roads, highways, public utility structures, and water and sewage facilities – will provide opportunities for precast concrete manufacturers.
Precast Concrete Is Making Inroads Against Competitive Products in Structural Construction
Structural building components account for the leading share of precast concrete demand by product, and demand is expected to grow at the fastest pace through 2026. Precast concrete products will be increasingly specified as concrete slabs, prefabricated buildings, foundations, and supports because of their:
- ease of installation, which reduces construction costs and labor needs, a key factor as workers in general and skilled laborers in particular become increasingly scarce
- greater durability than competitive products like poured-in-place concrete
- consistent quality due to their production in factory settings
However, precast concrete products will continue to compete with poured-in-place concrete – throughout the forecast period and beyond – due to the latter’s lower cost and familiarity among building contractors.

Historical Trends
Demand for precast concrete generally tracks construction expenditures because most precast concrete products are sold to the construction industry:
- The correlation is especially strong with new building construction, as a variety of structural and architectural precast concrete products are installed at the time of initial construction.
- Transportation construction spending also heavily influences precast concrete product demand since they see use in a wide variety of infrastructure applications – including roads and highways, bridges, railway systems, ports, and more. This segment has been heavily impacted by federal infrastructure funding, such as the FAST act, which funded transportation infrastructure spending between 2015 and 2020.
- Other nonbuilding construction spending also impacts precast concrete demand for products used in utility structures as well as water and sewer systems.
Demand for precast concrete is also impacted by competitive products made from alternative materials:
- In structural applications, precast concrete competes primarily with poured-in-place concrete, which has advantages like lower initial cost and widespread contractor familiarity. However, precast concrete has been gaining share from poured-in-place concrete, driven in part by growing acceptance of the long-term performance benefits of precast concrete as well as its easier installation process.
- In other applications, precast concrete products compete with a much broader spectrum of materials. In both siding and fencing, for instance, precast concrete products contend for market share against materials that are lower cost (vinyl or wood composite, for instance) or offer stronger aesthetics (like brick). In these applications, precast concrete products also gain share due to their durability and ease of installation.
Products Overview
Precast concrete products can be categorized into four main groups:
- structural building components
- architectural building components
- water and wastewater handling products
- other products, including infrastructure components such as bridges, utility, cemetery, and agricultural products
Demand for precast concrete is contingent on a wide range of factors, including trends in construction expenditures, incidence of use in individual markets, and changes in consumer preferences.
Precast concrete demand is expected to increase 5.9% annually through 2026 to $18.5 billion, driven by growth in commercial building and infrastructure construction spending:
- Among product types, structural building components are expected to account for the largest share of demand gains, supported by their widespread use in the growing building construction market, particularly in commercial applications.
- Transportation products such as bridge components and railroad ties – included in the other products segment – are expected to grow at a rapid pace, driven by a rising use of precast concrete products in the various types of projects funded by the Infrastructure Investment & Jobs Act
- Water handling products demand will also be bolstered by the Infrastructure Investment & Jobs Act, which will support strong increases in sewer and water supply construction.
- Precast concrete architectural building components demand growth will be driven by rising use of precast concrete decorative facades and door and window components, especially on commercial buildings
This study analyzes US demand for precast concrete by product, market, and region.
Precast concrete demand is segmented into the following product categories:
- structural building components (e.g., precast concrete slabs; prefabricated building systems; structural supports; foundations; stairs, steps, and ramps)
- architectural building components (e.g., decorative facades, roofing tiles, siding, door and window components, fencing, and other products such as balconies, arches, columns, fireplace surrounds, internal partitions, and safe rooms)
- water handling products (e.g., grease interceptors, manholes, septic tanks, water and sewer system products, and other products such as hazardous materials collection units, leaching pits, and fire cisterns)
- other products, including transportation construction (e.g., bridge components, pavement units, culverts, noise and traffic barriers, bridge slabs and tees, pilings and other supports, retaining walls, railroad ties, and other products such as parking blocks and tunnel segments), utility, cemetery, agricultural, and marine products
The major precast concrete market segments analyzed are:
- commercial and residential buildings
- infrastructure, including roads and bridges, water and sewer, electric utilities, and other infrastructure projects such as railroad, marine, and airports
- niche markets, including cemetery products, agricultural structures, landscaping, and consumer and commercial products
Additionally, demand for precast concrete is broken out for the following US geographic regions and subregions:
- Northeast (Middle Atlantic and New England)
- Midwest (East North Central and West North Central)
- South (South Atlantic, East South Central, and West South Central)
- West (Mountain and Pacific)
Excluded from the scope of the study are site-poured concrete; concrete blocks, bricks, and pavers; and concrete pipe. Historical data for 2011, 2016, and 2021 and forecasts to 2026 and 2031 are presented in millions of dollars.