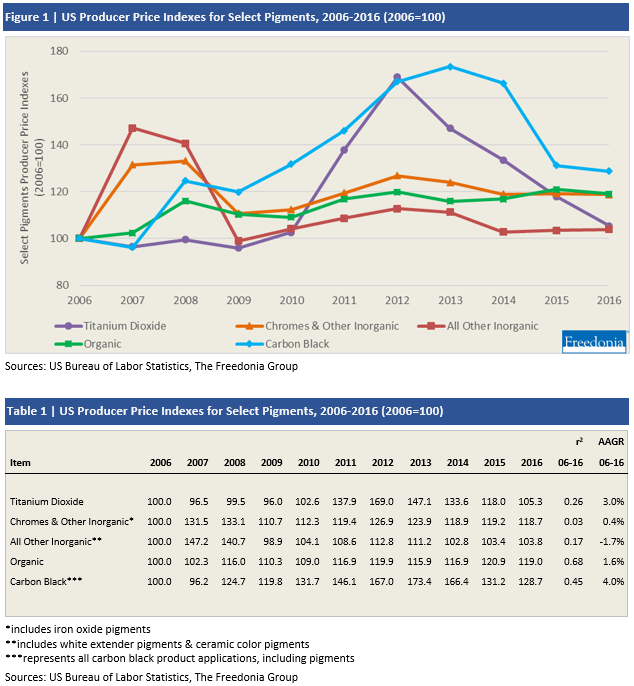
Over the 2006-2016 decade, pigment prices saw considerable volatility, growing significantly in the 2009-2012 period, but declining through 2016. In particular, the prices of carbon black and titanium dioxide pigments experienced the fastest gains and the steepest declines. Key factors that propelled these trends included rising global demand, supply constraints, and increases in the cost of key raw materials.
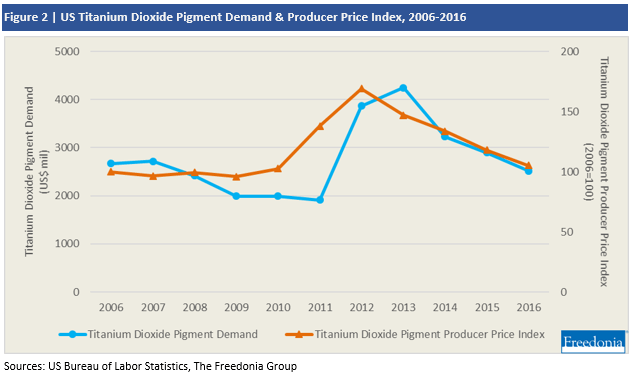
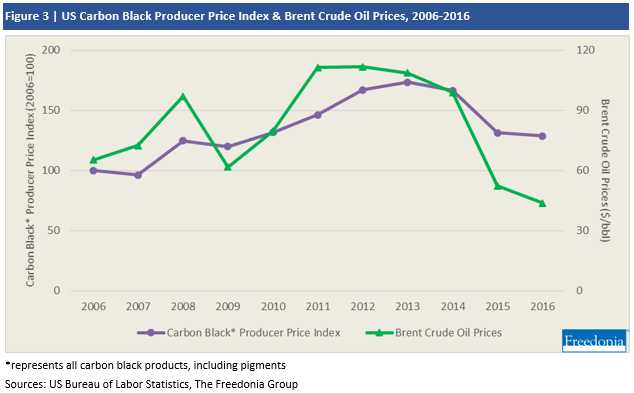
Expanding global demand and supply constraints drove large gains in the price of titanium dioxide pigment from 2010 to 2012. Many producers had reduced capacity during the 2009 global economic downturn as they faced a sharp drop in sales and weak profit margins. However, demand for titanium dioxide pigment rebounded in the aftermath of the downturn, creating shortages as many producers operated at near 100% capacity. As a result, prices surged in 2011 and 2012. Prices trended downward from 2012 through 2016 as producers added capacity and as users increasingly turned to substitute and extender white pigments. As the chart below shows, the majority of the increase in the value demand of titanium dioxide pigment was driven by increases in prices (rather than the volume of pigment consumed). Similarly, the rising and falling price of crude oil drove fluctuations in carbon black prices.
Learn More
For more insights into the US pigments industry, see Pigments: United States, a report published by the Freedonia Focus Reports division of The Freedonia Group. This report forecasts US pigments demand and shipments in nominal US dollars at the manufacturer level to 2021. Total demand is segmented by product in terms of:
- titanium dioxide
- other inorganic whites such as calcium carbonates, kaolin, and talc
- organic
- carbon black
- other inorganic pigments such as iron oxides, cadmium yellows, and chromium oxide greens
To illustrate historical trends, total demand, total shipments, the various segments, and trade are provided in annual series from 2006 to 2016.
Related Focus Reports include Adhesives & Sealants: United States, Commercial Printing: United States , Paint & Coatings: United States, Titanium: United States, Thermoplastic Resins: United States, World Paint & Coatings.
About the Author
Leon Mengri is a Senior Market Research Analyst with Freedonia Focus Reports. He conducts research and writes a variety of Focus Reports, which offer concise overviews of market size, product segmentation, business trends, and more.