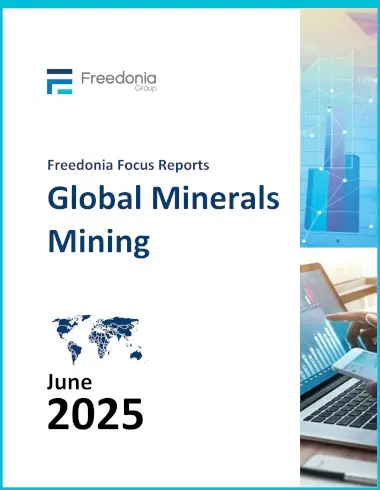
Minerals Mining: Global Report
This report forecasts to 2029 global minerals mining by commodity and major world region in metric tons. Commodity segments include: construction aggregates, industrial sand and gravel, phosphate rock, potash, and other minerals such as feldspar, gypsum, and mica.
Free Sample Report
Request a free sample of this report and our team will email it to you.
Report Overview
This report forecasts to 2029 global minerals mining by commodity and major world region in metric tons. Commodity segments include: construction aggregates, industrial sand and gravel, phosphate rock, potash, and other minerals such as feldspar, gypsum, and mica.
Major world regions include North America, Western Europe, Asia/Pacific, and all other regions.
To illustrate historical trends, world, commodity, and regional (including commodity segments) are provided for 2019 and 2024.
Other various topics, including profiles of pertinent leading companies, are covered in this report. A full outline of report items by page is available in the Table of Contents.
Related NAICS Codes
| NAICS Code | Code Description |
|---|---|
| 212312 | Crushed and Broken Limestone Mining and Quarrying |
| 212313 | Crushed and Broken Granite Mining and Quarrying |
| 212319 | Other Crushed and Broken Stone Mining and Quarrying |
| 212321 | Construction Sand and Gravel Mining |
| 212322 | Industrial Sand Mining |
| 212391 | Potash, Soda, and Borate Mineral Mining |
| 212392 | Phosphate Rock Mining |
| 212399 | All Other Nonmetallic Mineral Mining |
Table of Contents
HIGHLIGHTS
GLOBAL MINING BY COMMODITY OVERVIEW & FORECASTS
- Construction Aggregates
- Industrial Sand & Gravel
- Phosphate Rock
- Potash
- Other Minerals
REGIONAL SEGMENTATION & FORECASTS
- Regional Minerals Mining Overview
- North America
- Western Europe
- Asia/Pacific
- Other Regions
INDUSTRY STRUCTURE
- Industry Characteristics
- Market Leaders
ABOUT THIS REPORT
- Scope
- Sources
- Industry Codes
- Freedonia Methodology
- Resources
LIST OF TABLES & FIGURES
- Figure 1 | Global Minerals Mining Outlook, 2024 – 2029
- Figure 2 | Global Minerals Mining by Commodity; 2019, 2024, 2029 (bil m tons)
- Table 1 | Global Minerals Mining by Commodity; 2019, 2024, 2029 (mil m tons)
- Figure 3 | Global Minerals Mining by Commodity; 2019, 2024, 2029 (%)
- Figure 4 | Global Minerals Mining by Region; 2019, 2024, 2029 (bil m tons)
- Table 2 | Global Minerals Mining by Region; 2019, 2024, 2029 (mil m tons)
- Figure 5 | Global Minerals Mining by Region; 2019, 2024, 2029 (%)
- Figure 6 | North America: Minerals Mining by Commodity; 2019, 2024, 2029 (mil m tons)
- Table 3 | North America: Minerals Mining by Commodity; 2019, 2024, 2029 (mil m tons)
- Figure 7 | Western Europe: Minerals Mining by Commodity; 2019, 2024, 2029 (mil m tons)
- Table 4 | Western Europe: Minerals Mining by Commodity; 2019, 2024, 2029 (mil m tons)
- Figure 8 | Asia/Pacific: Minerals Mining by Commodity; 2019, 2024, 2029 (bil m tons)
- Table 5 | Asia/Pacific: Minerals Mining by Commodity; 2019, 2024, 2029 (mil m tons)
- Figure 9 | Other Regions: Minerals Mining by Region; 2019, 2024, 2029 (bil m tons)
- Figure 10 | Other Regions: Minerals Mining by Commodity; 2019, 2024, 2029 (bil m tons)
- Table 6 | Other Regions: Minerals Mining by Region & Commodity; 2019, 2024, 2029 (mil m tons)
- Table 7 | NAICS & SIC Codes Related to Minerals Mining
- Table 8 | HS Codes Related to Minerals Mining