Carpets & Rugs
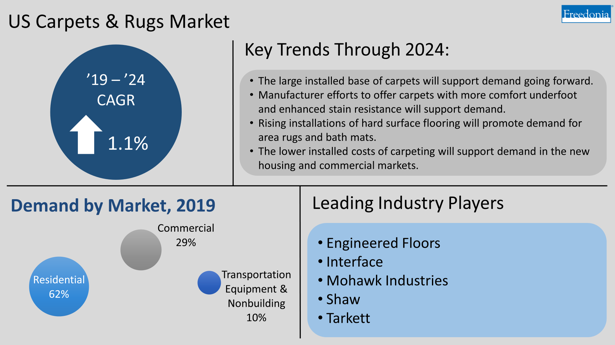
Carpet and rug demand in area terms is projected to rise on average 1.1% per year to 11.6 billion square feet in 2024.

Free Sample Report
Request a free sample of this report and our team will email it to you.
Report Overview
Featuring 62 tables and 26 figures – now available in Excel and Powerpoint! Learn More
This comprehensive study examines the US carpet and rug industry. Hard surface flooring is excluded from the scope of this study.
Demand for carpets and rugs is discussed in terms of product:
- tufted carpets and rugs
- broadloom
- vehicular
- carpet tile
- scatter rugs, bath mats, and accent rugs
- synthetic turf
- woven carpets and rugs
- Axminster
- Wilton (or jacquard)
- velvet
- needlepunched
- other carpets and rugs (e.g., braided, knitted, knotted, hooked)
Excluded from the study are handmade yet commercially produced carpets and rugs. Also excluded are handmade artisanal products.
Demand is discussed in terms of market:
- residential – new and replacement and remodeling application for single-family, multifamily, and manufactured housing types
- commercial – new and replacement and remodeling applications for office, trade, and lodging; institutional; industrial; and other commercial buildings (e.g., government buildings, athletic facilities)
- transportation equipment and other nonbuilding construction:
- motor vehicles
- recreational vehicles and boats
- aircraft
- ships
- trains
- nonbuilding structures (e.g., decks, docks)
Historical data for 2009, 2014, and 2019 and forecasts to 2024 and 2029 are provided for carpet and rug demand in both area terms (square feet) and value terms (US dollars).Data from the US Census Department were consulted in the preparation of this study and a list of related codes is presented here for informational purposes. However, these codes may not include all products covered in this report or may exclude some products of interest and the data have thus been adjusted accordingly.
Area Demand
Carpet and rug demand in area terms is projected to rise on average 1.1% per year to 11.6 billion square feet in 2024. Gains will be supported by:
- increasing single-family housing completions, as builders often specify carpet because of its favorable aesthetics and modest cost
- the large base of installed carpets in both residences and commercial structures that require periodic replacement due to wear
- manufacturers’ efforts to offer carpets with specific performance properties, such as extra-soft surface textures or those designed to resist pet dander
However, growth will be limited by competition from hard surface flooring, which will continue to take market share away from installed carpeting and rugs:
- Consumers looking for more durable, low-maintenance flooring increasingly choose hard surface products while others prefer the appearance of decorative tile or wood flooring.
- Many hard surface flooring materials, such as LVT, laminate, decorative tile, and some hardwood flooring types, can be installed by a homeowner as part of a DIY project. Carpet, in contrast, is almost always installed by professional installers, adding to the time and cost of a project.
- Some consumers will select hard surface flooring instead of carpeting due to concerns about health and safety. Carpets and rugs are more likely to retain particulates that affect indoor air quality (IAQ). Furthermore, it is more difficult to sterilize carpeted floors – a major consideration in the wake of the COVID-19 pandemic.
Tufted products accounted for the largest share of demand in 2019, with 77% of the market, and will continue to dominate going forward. Tufted carpet and rug demand will be supported by the:
- ongoing widespread use of broadloom wall-to-wall carpeting and area rugs
- high level of interest in using carpet tile in commercial structures
Demand by Market
Carpets and rugs are primarily installed in residential and commercial buildings, and to a much lesser extent in transportation equipment.
Since the main use of carpets and rugs is in buildings, the primary factor determining carpet and rug demand is building construction activity, both new construction and replacement projects. Improvement and repair activity plays the most important role in spurring demand, as most carpets and rugs are installed as part of replacement and remodeling projects. There is a large base of installed carpets and rugs, most of which have an average lifespan of about 10 years, although many consumers retain carpeting for even longer periods of time.
Carpet and rug demand in area terms is projected to rise 1.1% per year to 11.6 billion square feet in 2024:
- The residential market will continue to account for the largest share of carpet and rug demand in 2024, with growth outpacing all other markets going forward.
- Demand for carpets and rugs in the commercial market will see minimal gains as the segment tries to recover from the effects of the COVID-19 pandemic on commercial building construction, particularly in the large office, trade, and lodging segment.
- Stagnant production of motor vehicles – particularly automobiles – will cause demand in the transportation equipment and nonbuilding market to remain flat.
While many similarities exist between residential and commercial carpet, there are a handful of significant differences:
- Commercial carpet is generally produced in patterns rather than solid colors, as patterned carpet is better at hiding stains, while solid color carpeting is more prominent in the residential sector.
- Commercial tufted carpets are typically a smaller gauge (e.g., one-eighth or one-tenth) than residential varieties, while tufted residential carpets have a greater tendency to utilize cut pile construction than commercial products.
- Residential consumers often desire softer carpets that provide an enhanced tactile feel or better retain warmth. Building owners and managers tend to select carpeting that is durable and easy to install for moderate cost.
- Vehicular carpet is unlike residential and commercial products in that the majority of vehicular carpet is designed to meet the custom specifications of individual OEMs. These specifications include sound suppression and fire resistance, as well as durability, low cost, and light weight. Additionally, the bulk of carpet installed at the OEM level remains in place throughout the life of the vehicle.
US demand for carpets and rugs is forecast to advance 1.1% annually to 11.6 billion square feet valued at $13.2 billion in 2024. Gains will be supported by such factors as:
- increases in single-family housing starts – carpeting is installed in many newly built homes because of its low cost and consumer familiarity with the material
- manufacturers’ efforts to offer products that meet specific performance properties, such as carpets that are pet-friendly or are engineered to be soft
- the large installed base of carpeting, which must be replaced as carpets age and become worn or out-of-date – in most cases, older and worn carpets are replaced by similar products
However, more rapid demand advances will be restrained by:
- strong competition from hard surface flooring – particularly luxury vinyl tile (LVT) – which is seeing rising use in residences as homeowners look to enhance the appearance and value of their properties, though area rugs will benefit from this trend to an extent as they are used with hard floors
- a contraction in commercial construction spending due to the COVID-19 pandemic, which will negatively affect demand for carpet tile
Residential Market Remains Strong Despite COVID-19 Pandemic
The COVID-19 pandemic hurt both residential and commercial carpet and rug demand in 2020:
- After a slight decline at the onset of the pandemic, residential carpet and rug demand recovered through the rest of the year as many homeowners – having plenty of time to consider the deficiencies of their residences – engaged in home improvement projects, such as the installation of carpet or the addition of rugs to change the look of a room.
- The commercial market did not fare as well, as cash-strapped business owners put off remodeling and replacement projects (such as flooring replacement) and as new commercial construction spending fell because commercial lenders were more leery of investing in large-scale projects.
Broadloom Carpet to Remain Leading Product
Broadloom carpet – which held half of US carpet and rug demand by area in 2019 – will continue to account for the largest share of demand through 2024. Homebuilders and commercial specifiers will opt for the material because of its low cost, while homeowners will select broadloom carpet because of its softness, which many people find to be comforting. Manufacturers will expand product offerings of broadloom carpets with enhanced aesthetics and performance properties to promote sales.
Residential Market to Post Strong Gains
The residential market will account for nearly all demand gains through 2024. Solid growth in single-family housing starts will lead market advances, as homebuilders will continue to specify carpeting because of its modest cost and favorable aesthetics. Carpets and rugs will continue to see use in the remodeling and replacement segment, as homeowners add carpeting to bedrooms, home offices, and family rooms because of its ability to create a feeling of warmth underfoot and because of its sound deadening properties.
- Executive Summary
- Figure 1-1 | US Carpets & Rugs Market
- About This Report
- Report Details
- Study Scope & Product Description
- Figure 2-1 | Carpets & Rugs: Product Examples
- Impact of COVID-19 Pandemic
- Table | Annual Carpet & Rug Demand by Product, 2019 – 2024
- Table | Annual Carpet & Rug Demand by Market, 2019 – 2024
- Figure 2-2 | Annual Carpet & Rug Demand by Market, 2019 – 2024
- Overview
- Historical Market Trends
- Table | Carpet & Rug Market, 2009 – 2019
- Figure 3-1 | Carpet & Rug Demand, 2009 – 2019
- Demand by Product
- Area Demand
- Table | Carpet & Rug Demand by Product, 2009 – 2029
- Market Value
- Table | Carpet & Rug Demand, 2009 – 2029
- Area Demand
- Demand by Market
- Table | Carpet & Rug Demand by Market, 2009 – 2029
- Shipments & Foreign Trade
- Production
- Table | Carpet & Rug Supply & Demand, 2009 – 2029
- Imports
- Figure 3-2 | US Carpet & Rug Imports: Share by Source, 2019
- Figure 3-3 | US Carpet & Rug Imports by Source, 2009 – 2019
- Exports
- Figure 3-4 | US Carpet & Rug Exports: Share by Destination, 2019
- Production
- Pricing Trends
- Figure 3-5 | Carpet & Rug Average Prices, 2009 – 2019
- Competitive Products
- Figure 3-6 | Comparative Growth Rates for Selected Flooring Products, 2019 – 2024
- Sustainability Trends
- Recycling Activity
- Recycled Content Use
- Green Building Practices
- Indoor Air Quality Concerns
- Historical Market Trends
- Tufted Carpets & Rugs
- Scope & Product Description
- Figure 4-1 | Tufted Carpets & Rugs: Product Examples
- Product Trends
- Demand by Product
- Table | Tufted Carpet & Rug Demand by Product, 2009 – 2029
- Broadloom
- Table | Broadloom Carpet & Rug Demand by Market, 2009 – 2029
- Vehicular Carpet
- Table | Vehicular Carpet & Rug Demand, 2009 – 2029
- Carpet Tile
- Table | Carpet Tile Demand by Market, 2009 – 2029
- Scatter Rugs, Bath Mats, &Accent Rugs
- Table | Scatter Rug, Bath Mat, &Accent Rug Demand by Market, 2009 – 2029
- Synthetic Turf
- Table | Synthetic Turf Demand by Market, 2009 – 2029
- Demand by Product
- Demand by Market
- Table | Tufted Carpet & Rug Demand by Market, 2009 – 2029
- Shipments & Foreign Trade
- Table | Tufted Carpet & Rug Supply & Demand, 2009 – 2029
- Figure 4-2 | Tufted Carpet Imports: Share by Source, 2019
- Market Share
- Figure 4-3 | Tufted Carpet & Rug Market Share by Company, 2019
- Scope & Product Description
- Woven Carpets & Rugs
- Scope & Product Description
- Figure 5-1 | Woven Carpets & Rugs: Product Examples
- Product Trends
- Demand by Product
- Table | Woven Carpet & Rug Demand by Product, 2009 – 2029
- Axminster
- Table | Axminster Carpet & Rug Demand by Market, 2009 – 2029
- Wilton
- Table | Wilton Carpet & Rug Demand by Market, 2009 – 2029
- Velvet
- Table | Velvet Carpet & Rug Demand by Market, 2009 – 2029
- Demand by Product
- Demand by Market
- Table | Woven Carpet & Rug Demand by Market, 2009 – 2029
- Shipments & Foreign Trade
- Table | Woven Carpet & Rug Supply & Demand, 2009 – 2029
- Figure 5-2 | Woven Carpet & Rug Imports: Share by Source, 2019
- Market Share
- Figure 5-3 | Woven Carpet & Rug Market Share by Company, 2019
- Scope & Product Description
- Needlepunched & Other Carpets & Rugs
- Scope & Product Description
- Figure 6-1 | Needlepunched & Other Carpets & Rugs: Product Examples
- Demand by Product
- Table | Needlepunched & Other Carpet & Rug Demand, 2009 – 2029
- Needlepunched Carpets & Rugs
- Table | Needlepunched Carpet & Rug Demand by Market, 2009 – 2029
- Other Carpets & Rugs
- Table | Other Carpet & Rug Demand by Market, 2009 – 2029
- Demand by Market
- Table | Needlepunched & Other Carpet & Rug Demand by Market, 2009 – 2029
- Shipments & Foreign Trade
- Table | Needlepunched & Other Carpet & Rug Supply & Demand, 2009 – 2029
- Figure 6-2 | Needlepunched & Other Carpet & Rug Imports: Share by Source, 2019
- Leading Suppliers
- Scope & Product Description
- Residential Carpets & Rugs
- Demand by Product & Application
- Table | Residential Carpet & Rug Demand by Application & Product, 2009 – 2029
- New Construction
- Table | New Residential Carpet & Rug Demand by Housing Type & Product, 2009 – 2029
- Replacement & Remodeling
- Table | Residential Replacement & Remodeling Carpet & Rug Demand by Housing Type & Product, 2009 – 2029
- Building Types
- Demand by Housing Type
- Table | Residential Carpet & Rug Demand by Housing Type, 2009 – 2029
- Single-Family
- Table | Single-Family Housing Carpet & Rug Demand by Application, 2009 – 2029
- Multifamily
- Table | Multifamily Housing Carpet & Rug Demand by Application, 2009 – 2029
- Manufactured Housing
- Table | Manufactured Housing Carpet & Rug Demand by Application, 2009 – 2029
- Demand by Housing Type
- Demand by Product & Application
- Commercial Carpets & Rugs
- Demand by Product & Market Sector
- Table | Commercial Carpet & Rug Demand by Application & Product, 2009 – 2029
- New Construction
- Table | New Commercial Carpet & Rug Demand by Building Type & Product, 2009 – 2029
- Replacement & Remodeling
- Table | Commercial Replacement & Remodeling Carpet & Rug Demand by Building Type & Product, 2009 – 2029
- Building Types
- Demand by Building Type
- Table | Commercial Carpet & Rug Demand by Building Type, 2009 – 2029
- Office, Trade & Lodging
- Table | Office, Trade, &Lodging Carpet & Rug Demand by Application, 2009 – 2029
- Institutional
- Table | Institutional Carpet & Rug Demand by Application, 2009 – 2029
- Industrial
- Table | Industrial Carpet & Rug Demand by Application, 2009 – 2029
- Other Commercial Buildings
- Table | Other Commercial Carpet & Rug Demand by Application, 2009 – 2029
- Demand by Building Type
- Demand by Product & Market Sector
- Transportation Equipment & Nonbuilding Carpets & Rugs
- Demand by Product & Application
- Table | Transportation Equipment & Nonbuilding Carpet & Rug Demand by Application & Product, 2009 – 2029
- Motor Vehicle Flooring
- Other
- Demand by Product & Application
- Suppliers & Market Share
- Key Findings & Industry Composition
- Table | US Carpets & Rugs Sales by Company, 2019
- Market Share
- Figure 10-1 | US Carpets & Rugs Market Share by Company, 2019
- Shaw Industries
- Figure 10-2 | US Carpets & Rugs Market: Leading Supplier, 2019
- Mohawk Industries
- Figure 10-3 | US Carpets & Rugs Market: Second Leading Supplier, 2019
- Engineered Floors
- Figure 10-4 | US Carpets & Rugs Market: Third Leading Supplier, 2019
- Interface
- Figure 10-5 | US Carpets & Rugs Market: Fourth Leading Supplier, 2019
- Tarkett
- Figure 10-6 | US Carpets & Rugs Market: Fifth Leading Supplier, 2019
- Mergers & Acquisitions
- Table | Selected Mergers & Acquisitions
- List of Industry Participants
- Table | Selected Industry Participants
- Key Findings & Industry Composition
- Appendix
- Scope
- Table | Relevant Industry Codes
- Table | Relevant HS Codes
- Definitions
- General
- Markets
- Products
- Abbreviations
- Table | Abbreviations & Acronyms Used in Study
- Freedonia Methodology
- A Comprehensive Approach to Data Analysis
- High-Quality, Industry-Leading Market Research
- Study-Specific Methodology
- Sources
- Associations & Agencies
- Related Studies & Reports
- Freedonia Group US Studies
- Freedonia Group Global Studies
- Freedonia Focus Reports
- Knowledge Center
- Macroeconomic Assumptions
- Economic Environment
- Table | Macroeconomic Indicators, 2009 – 2029
- Figure 11-1 | Annual Growth in Real GDP, 2000 – 2019, Compared to 1980 – 2005 Average
- Demographic Trends
- Table | Population & Households, 2009 – 2029
- Figure 11-2 | Annual Population Growth, 2004 – 2019
- Consumer Spending
- Table | Personal Consumption Expenditures, 2009 – 2029
- Consumer Financing
- Table | Consumer Financing Environment, 2009 – 2019
- Building Construction
- Table | Building Construction Expenditures, 2009 – 2029
- Residential Building Construction
- Table | Residential Building Construction Expenditures, 2009 – 2029
- Housing Completions
- Table | New Housing Indicators, 2009 – 2029
- Figure 11-3 | New Housing Square Footage by Housing Type, 2004 – 2019
- Residential Improvements & Repairs
- Table | Residential Improvement & Repair Expenditures, 2009 – 2029
- Commercial Building Construction
- Table | Commercial Building Construction Expenditures, 2009 – 2029
- Commercial Building Stock
- Table | Commercial Building Stock by Type, 2009 – 2029
- Commercial Building Improvements & Repairs
- Table | Commercial Building Improvement & Repair Expenditures, 2009 – 2029
- Nonbuilding Construction Expenditures
- Table | Nonbuilding Construction Expenditures, 2009 – 2029
- Motor Vehicles
- Table | Motor Vehicle Indicators, 2009 – 2029
- Recreational Boats, Recreational Vehicles, &Civilian Aircraft Shipments
- Table | Recreational Boats, Recreational Vehicles, &Civilian Aircraft Shipments, 2009 – 2029
- Economic Environment
- Scope
US demand for carpets and rugs is forecast to advance 1.1% annually to 11.6 billion square feet valued at $13.2 billion in 2024.
Broadloom carpet – which held half of US carpet and rug demand by area in 2019 – will continue to account for the largest share of demand through 2024.
Industry competitors include Mohawk Industries, Shaw Industries, Engineered Floors, and Interface.