Report Overview
 What roofing materials meet government cool roofing criteria?
This Freedonia industry study analyzes the 96.3 million squares US commercial roofing industry. It presents historical demand data (2012, 2017, and 2022) and forecasts (2027 and 2032) by product (plastic single-ply, metal, bituminous, rubber, asphalt shingles, and other), by application (new and reroofing) and US geographic subregion. The study also evaluates company market share and competitive analysis on industry competitors, including Carlisle Companies, Elevate, GAF Materials, and Johns Manville.
Featuring 150 tables and 52 figures – available in Excel and Powerpoint! Learn More
US commercial roofing demand in area terms is projected to increase minimally to 96.3 million squares in 2027. Growth in area terms will be restrained primarily by a slowdown in commercial reroofing activity after increases in 2020 and 2021. Gains will stem from the new commercial building segment. New demand is forecast to increase, on average, during the forecast period from a depressed 2022 base.
Demand in value terms is expected to fall less than 1.0% annually through 2027 to $9.1 billion – representing a significant reduction in demand from the 2017-2022 period – as most commercial roofing product prices will moderate following price spikes in 2021 and 2022 that resulted from supply chain issues and high raw material costs.
Metal Roofing Growing at the Fastest Rate of Any Single Commercial Roofing Material
Commercial metal roofing – which exhibited above average growth in the previous five-year period – will grow at the fastest rate, as well as account for the largest absolute gains, of any single commercial roofing material through 2027. Gains will be driven by:
-
rising installations of prefabricated metal buildings
-
continuing interest in the use of metal roofing as a weather-resistant alternative to products like roofing membranes
-
its ability to serve as a cool roofing material that reduces a building’s energy consumption and lowers utility bills
Standing seam roofing will continue accounting for the largest share of commercial metal roofing demand, supported by its strong leak and wind protection and ability to be used in both low- and steep-slope applications.
Public & Private Investment Spurs Roofing Sales for a Variety of Commercial Buildings
Among commercial building types, transportation, government, and industrial buildings are anticipated to see demand grow at the fastest rate:
-
Gains will be driven by the new roofing segment, with the Infrastructure Investment and Jobs Act of 2021 spurring new construction at a variety of transportation facilities.
-
Reroofing activity will further support demand as government agencies – calling for environmentally friendly and energy-efficient buildings – are expected to install more roofing that meets cool roofing criteria, such as plastic, metal, and vegetative types.
-
New industrial building construction will see demand gains as more manufacturing plants and related facilities are erected by US firms looking to add domestic capacity:
- Many companies had trouble importing products from China (and other nations) during the COVID-19 pandemic.
- Supply chain difficulties drove up product costs and limited firms’ abilities to ship goods to the US, encouraging additional domestic manufacturing capacity.
Historical Market Trends
Shifts in demand for commercial roofing can vary from year to year and are determined by numerous factors, primarily those related to building construction activity. They include:
-
interest rates – low interest rates may encourage business owners to take out lines of credit often used to fund roof repair and replacement projects, while high interest rates may dissuade them from doing this
-
the number and types of commercial buildings erected or repaired in any given year
-
the type of roof (e.g., steep-slope or low-slope) installed on a structure that will be repaired or replaced
-
the types of roofing materials most often specified in a particular region of the US
-
the roofing materials originally installed on the structure
The US has a significant number of businesses with roofs that are at or near the end of their life expectancies. Thus, age-related reroofing is the most significant driver of roofing demand in the US.
Additionally, multiple other variables can affect demand for roofing in a particular year or over a short period of time. Among these are:
-
weather conditions, especially outbreaks of severe weather that can cause widespread damage to roofs (e.g., hurricanes and tropical storms, tornadoes, hailstorms, and winter storms)
-
changes and modifications to state and local building codes
-
the adoption of legislation (such as the Tax Cuts and Jobs Act of 2017) that can cause a temporary increase in reroofing activity
-
insurers requiring building owners to replace older or worn roofs with newer materials that better resist severe weather on condition of maintaining coverage
-
changes in the price of raw materials (e.g., asphalt, metal, lumber) that can cause the per-square cost of roofing materials to increase or decrease sharply
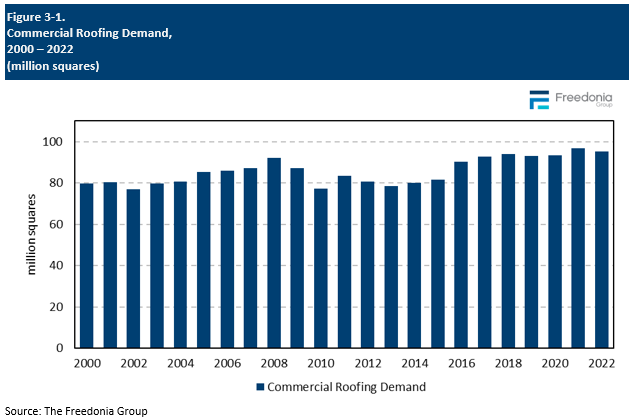
Commercial roofing demand advanced slightly in 2020, though the level of demand was still below 2018 levels. This growth was spurred by multiple outbreaks of severe weather across the US. Levels increased rapidly in 2021, despite continued restraint from supply chain issues and increased inflation. Roofing demand in volume terms declined in 2022 due to weakness in commercial building construction, but market value continued to exhibit growth because of continuing inflation and supply chain disruptions.
Supply & Demand
Foreign Trade
Overall, the US is a minor net importer of commercial roofing products. In general, foreign trade plays a minor role in the US roofing market; imports accounted for 4% of US sales in 2022 and exported roofing materials accounted for around 3% of US industry shipments that year.
Trade in roofing materials between the US and foreign countries is limited by a number of factors, including:
-
the weight and bulk of most roofing products, which make shipment across long distances costly and impractical
-
differences in aesthetic and performance requirements between the US and other countries
-
regional variations in building codes and material preferences
The US’ main trading partner in roofing products is Canada, which generally accounts for about 70% of imports and exports in any given year because:
-
Structures in the two countries share similar designs and are constructed in the same manner with similar materials.
-
The weather and climate patterns in the two countries are similar in the northern half of the US and Canada – including harsh winters with heavy snowfalls, short but hot summers, and periodic instances of tornadoes, hailstorms, and other severe weather events.
-
Roofing designed for use in the northern half of the US meets Canadian building code requirements.
-
The proximity of the two countries means that it is sometimes a shorter distance to ship to Canada than to other parts of the US.
Other countries that supply roofing materials to the US include:
-
China (metal roofing panels, as well as sheet metal that can be fabricated into roofing)
-
Mexico (roofing tiles and bituminous low-slope roofing)
-
Italy (bituminous low-slope roofing membranes)
-
South Korea (metal roofing materials)
-
the United Arab Emirates (bituminous low-slope membranes)
Pricing Trends
Roofing product price levels differ greatly due to the large number of products used as roofing materials and their varying raw material and production costs. Factors impacting the price of roofing products in general include:
-
the price of key raw materials (e.g., asphalt, metal, plastic resins, lumber)
-
costs related to the production of roofing materials (manufacturing equipment, energy)
-
transportation and distribution expenses related to delivering finished products to distributors
-
labor – many industries have difficulties in finding trained skilled workers to operate and maintain production equipment
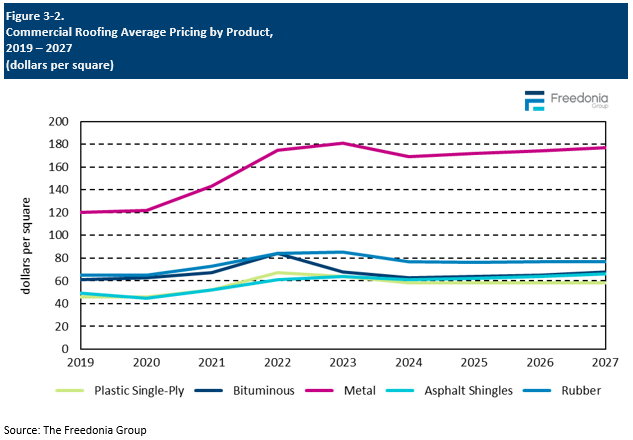
The average price of commercial roofing products is forecast to decline less than 1.0% per year through 2027, a significant reversal from the 2017-2022 period. Pricing in the latter part of that period was affected by significant supply chain issues that plagued numerous industries, with product shortages and higher raw material costs pitching prices upward, especially for those items that require crude oil.
Commercial roofing product pricing started to moderate in 2023 as inflationary pressures lessened, and those prices are forecast to continue to decline in 2024 as normalization continues. Value growth in the latter part of the forecast period will largely result from increasing use of higher value products. Manufacturers will offer more costly products that look and perform better than conventional options. These generally use raw materials more intensively, boosting their per-square prices. Examples include:
-
standing seam metal roofing with corrosion-resistant compounds
-
polymer-modified bituminous membranes
-
rubber roofing membranes with thicker backings that enhance puncture and tear resistance
-
laminated asphalt shingles that have multiple layers of fiberglass matting and asphalt