US Engineered Stone Countertops
Demand for engineered stone countertops is expected to rise 9.6% per year to 404 million square feet in 2026.
Free Sample Report
Request a free sample of this report and our team will email it to you.
Report Overview
Featuring 24 tables and 20 figures – now available in Excel and Powerpoint! Learn More
Demand for engineered stone countertops is expected to rise 9.6% per year to 404 million square feet in 2026, solidifying the material’s position as the most popular type of countertop in the country. This strong rate of growth will be supported by:
- consumers preferring more natural looking surfaces
- the increasing availability of the material and selection of colors in line with current design trends from both domestic and foreign suppliers
- increasing usage in high-end lodging and institutional construction due to engineered stone’s favorable aesthetics and performance properties
- an abundant supply of low-cost quartz slabs from India and Vietnam
While kitchens represent the largest application for engineered stone countertops, as these rooms tend to have the largest amount of counter space, design trends are also driving increased usage in bathroom vanities as well as in countertops in other areas of the home, such as wet bars. Homeowners are looking to bring a cohesive design aesthetic throughout their homes and elevate all spaces with attractive materials.
Engineered Stone Continues to Gain Share Over Competitive Countertop Surface Materials
In 2021, engineered stone surpassed laminate to become the most used countertop material in the US, driven by a rapid increase in low-cost slab imports over the past decade. As prices declined and color availability expanded, consumers became more willing to purchase higher cost engineered stone countertops. Engineered stone will continue to expand its market share over competitive materials, supported by:
- strong consumer preferences for the aesthetics and quality of engineered stone over laminates
- advantages relative to natural stone such as color uniformity and a smoother, nonporous surface that is resistant to biological contaminants
Low-Cost Imports from India & Vietnam Fill Supply Gap Resulting from Tariffs on China
Once the largest source of quartz slab imports to the US, China now exports less than 1 million square feet of the material to the US per year. After steep tariffs were imposed on quartz slabs from China in 2018, US producers and fabricators sought other sources of low-cost quartz slab to fill the supply gap. Imports from India, Turkey, and Vietnam significantly increased, more than making up for the supply losses from China. While antidumping duties were also imposed on quartz slabs from India and Turkey in 2019, these tariffs were lower than those imposed on China, and import activity from both countries has remained strong.
Historical Market Trends
Engineered stone countertop demand is driven by a number of factors, including:
- new housing construction
- single-family residential remodels, which often include the replacement of countertops or the addition of a bathroom, outdoor kitchen, or wet bar
- shifts in consumer tastes, such as a change in preference toward countertops with a more natural stone aesthetic and away from laminates, resulting in increased engineered stone demand in the residential remodeling market
Though much smaller markets, demand for engineered stone countertops is also supported to an extent by trends in commercial building construction, as well as recreational vehicle (RV) and boat, civilian aircraft, railroad equipment, and heavy vehicle production.
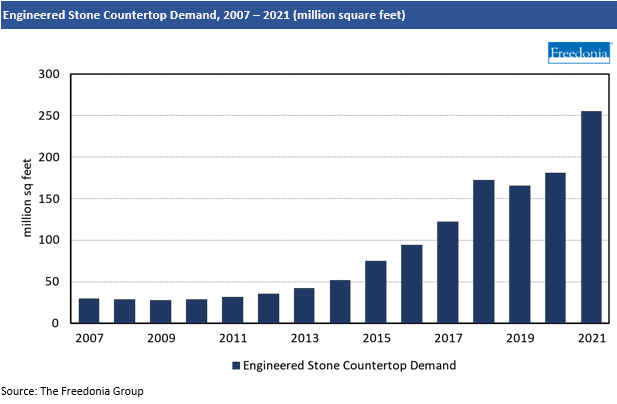
During the 2011-2021 period, engineered stone countertop demand grew at a 23% annual rate, boosted by:
- the rapid emergence of engineered stone as the preferred material for residential countertop replacement projects
- a sharp increase in the availability of low-cost imported engineered stone, which increased the material’s affordability among US households
Engineered stone countertop demand declined only in 2019 due to weakness in new construction. Significant single-family housing remodeling activity in the US supports a rather steady level of demand for engineered stone countertops.
Pricing Trends
In 2021, the average cost of engineered stone countertops was $69 a square foot, one of the higher average prices of any countertop material. The average price per square foot of engineered stone countertops is forecast to grow 1.7% annually to $75 in 2026 due to:
- inflation and supply chain issues in the US
- the threat of further tariffs on quartz slab imports, preventing foreign suppliers from offering products at a cost significantly below the average slab import price
Prices vary considerably between imported products and domestically produced products. US-made engineered stone countertops are highly priced due to the high cost of raw materials and fabrication in the country. While foreign suppliers in Spain and Canada generally offer upmarket products with higher prices, most engineered stone countertop imports are low-cost products from India, Vietnam, and other countries with low labor costs and abundant raw material supply.
Competitive Products
Engineered stone competes primarily against granite and marble, and in recent years, porcelain slab and sintered stone (such as Cosentino’s Dekton) in mid- to high-end residential applications.
Engineered stone countertops are mostly installed in residential kitchens, where it competes primarily with natural stone. However, , engineered stone also competes with high-end niche materials in this segment, such as porcelain slab, sintered stone, stainless steel, concrete, and recycled materials.
In recent years, the popularity of engineered quartz bathroom vanity tops has increased substantially. These tops compete directly with granite vanities.
In the nonresidential market, engineered stone faces stiff competition from laminates and solid surface, as these materials are significantly less expensive than engineered stone. Additionally, countertops are used for more utilitarian purposes in these applications, resulting in sufficient durability at a low cost taking priority over aesthetics.
- Executive Summary
- Figure 1-1 | Engineered Stone Countertops Market
- About This Report
- Report Details
- Study Scope & Product Description
- Figure 2-1 | Engineered Stone Countertops: Product Examples
- Impact of COVID-19 Pandemic
- Table | Annual Engineered Stone Countertop Demand by Market, 2019 – 2022
- Figure 2-2 | Engineered Stone Countertop Volume Demand by Market, 2019 – 2023
- Overview
- Historical Market Trends
- Table | Engineered Stone Countertop Demand, 2011 – 2021
- Figure 3-1 | Engineered Stone Countertop Demand, 2007 – 2021
- Supply & Demand
- Table | Engineered Stone Countertop Supply & Demand, 2011 – 2031
- Pricing Trends
- Figure 3-2 | Engineered Stone Countertop Prices, 2011 – 2031
- Figure 3-3 | Imported vs. Domestic Engineered Stone Countertop Prices, 2011 – 2021
- Competitive Products
- Figure 3-4 | Comparative Growth: Engineered Stone Countertops & Competitive Products, 2021 – 2026
- Global Perspective
- Figure 3-5 | Global Demand for Engineered Stone Countertops by Region, 2021 – 2026
- Historical Market Trends
- Factors Impacting Countertop Demand
- Building Construction Outlook
- Sustainability Trends
- Green Building Initiatives
- Recycled Content
- Health Concerns
- Product Quality Standards
- Installation Costs
- Figure 4-1 | Engineered Stone Countertops: Material & Installation Costs, 2021
- Markets
- Demand by Market
- Table | Engineered Stone Countertop Demand by Market, 2011 – 2031
- Figure 5-1 | Engineered Stone Countertop Demand by Market, 2011 – 2031
- Residential Buildings
- Table | Residential Buildings Market for Engineered Stone Countertops by Area of Installation & Project Type
- Figure 5-2 | Residential Engineered Stone Countertop Demand by Project Type, 2011 – 2031
- Commercial Buildings
- Table | Commercial Buildings Market for Engineered Stone Countertops by Area of Installation & Project Type,
- Figure 5-3 | Commercial Engineered Stone Countertop Demand by Project Type, 2011 – 2031
- Vehicles
- Table | Vehicle Market for Engineered Stone Countertops by Project Type, 2011 – 2031
- Figure 5-4 | Vehicle Engineered Stone Countertop Demand by Project Type, 2011 – 2031
- Demand by Market
- Areas of Installation
- Demand by Area of Installation
- Table | Engineered Stone Countertop Demand by Area of Installation, 2011 – 2031
- Figure 6-1 | Engineered Stone Countertop Demand by Area of Installation, 2011 – 2031
- Kitchen Countertops
- Table | Engineered Stone Kitchen Countertop Demand by Market, 2011 – 2031
- Figure 6-2 | Engineered Stone Kitchen Countertop Demand by Market, 2011 – 2031
- Bathroom Countertops
- Table | Engineered Stone Bathroom Countertop Demand by Market, 2011 – 2031
- Figure 6-3 | Engineered Stone Bathroom Countertop Demand by Market, 2011 – 2031
- Other Areas of Installation
- Table | Other Engineered Stone Countertop Demand by Market, 2011 – 2031
- Figure 6-4 | Other Engineered Stone Countertop Demand by Market, 2011 – 2031
- Demand by Area of Installation
- Key Suppliers & Market Share
- Industry Composition
- Market Share
- Figure 7-1 | Engineered Stone Countertop Market Share by Company, 2021
- Mergers & Acquisitions
- Table | Selected Mergers & Acquisitions
- Manufacturing
- Appendix
- Scope
- Table | Relevant Industry Codes
- Table | Relevant HS Codes
- Definitions
- Freedonia Methodology
- Study-Specific Methodology
- Sources
- Associations & Agencies
- Related Studies & Reports
- Macroeconomic Assumptions
- Economic Environment
- Table | Macroeconomic Indicators, 2011 – 2031
- Demographic Trends
- Table | Population & Households, 2011 – 2031
- Building Construction
- Table | Building Construction Expenditures, 2011 – 2031
- Residential Building Construction
- Table | Residential Building Construction Expenditures, 2011 – 2031
- Residential Improvements & Repairs
- Table | Residential Improvement & Repair Expenditures, 2011 – 2031
- Commercial Building Construction
- Table | Commercial Building Construction Expenditures, 2011 – 2031
- Commercial Building Improvements & Repairs
- Table | Commercial Building Improvement & Repair Expenditures, 2011 – 2031
- Housing Completions
- Table | New Housing Indicators, 2011 – 2031
- Figure 8-1 | New Housing Square Footage by Housing Type, 2006 – 2021
- Housing Stock
- Table | Housing Stock by Type, 2011 – 2031
- Figure 8-2 | Housing Stock: Share by Year of Construction, 2021
- Consumer Financing
- Table | Consumer Financing Environment, 2011 – 2021
- Economic Environment
- Scope
US demand for engineered stone countertops is expected to grow 9.6% annually through 2026.
The 2021 market size for engineered stone countertops in the US is $17.7 billion.
The leading players are Caesarstone, Cambria, Cosentino, LX Hausys, and Vicostone.