US Food Trays & Bowls
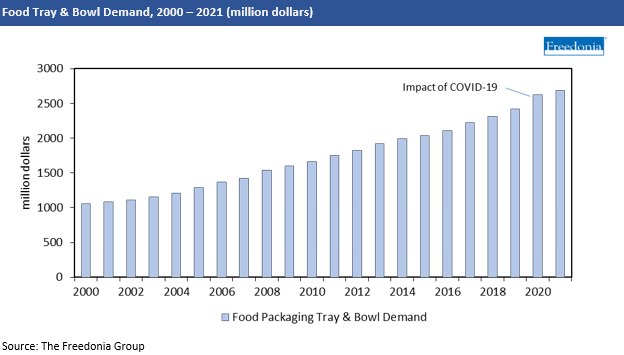
Demand for food packaging trays and bowls is forecast to increase 3.3% per year to $3.1 billion in 2025.
Free Sample Report
Request a free sample of this report and our team will email it to you.
Report Overview
Featuring 24 tables and 20 figures – now available in Excel and Powerpoint! Learn More
 Demand for food packaging trays and bowls is forecast to increase 3.3% per year to $3.1 billion in 2025, driven by:
- healthy sales growth following a pandemic-related acceleration in popularity for frozen dinners and fresh prepared foods in trays and especially bowls due to their convenience
- continuing popularity of packaging-intensive single serving sizes in key food applications, such as prepared foods (e.g., frozen meal bowls, personal pizzas, fresh prepared meals); frozen desserts; and fresh-cut produce
- increased focus on sustainability causing major food brands to shift from plastic to higher value materials such as molded fiber, paperboard, and bioplastics
However, competition from rigid and flexible packaging alternatives are expected to continue to hinder further growth in some applications.
Above Average Growth for Bowls Driven by Novelty & Convenience
While trays continue to see much wider use, bowls are expected to see faster growth from a lower market base. Sales will be boosted by the shift to bowls from traditional trays in some frozen dinner applications due to their shelf appeal, which evokes a more contemporary and fresh image for many consumers. Sales will also be supported by the rising use of value added materials that are compostable, recyclable, and/or sourced from recycled or renewable materials.
Molded Sugarcane Poised for Growth as a Sustainable Alternative Material
Molded sugarcane is experiencing rapid sales growth in the foodservice sector, and this trend is expected to spread to retail food packaging trays and bowls over the next decade. A renewable and degradable alternative to plastic and paper, sugarcane – and other similar new molded fiber materials – is seen as holding promise due to its strong performance (e.g., leak protection) compared to molded pulp. In the short term the material’s high cost will likely limit adoption to premium brands/segments that focus on sustainability. However, significant growth opportunities are expected in a broad array of fresh produce; prepared foods; and meat, poultry, and seafood applications.
Product Overview
Demand for food trays and bowls is forecast to increase 3.3% per year through 2025, totaling $3.1 billion. Gains will be supported by:
- the rising popularity of prepared foods – a major use for trays and bowls – as well as increasing demand in more mature market segments like meat, poultry, and seafood; baked goods; and fresh produce
- efforts to improve the sustainability of food trays and bowls, such as the introduction of sugarcane and thermoformed paperboard trays
Trays will continue to account for the largest share of demand, supported by their status as one of the leading packaging types in meat, poultry, and seafood applications (as well as baked goods, fresh produce, and frozen food). However, trays will lose market share to bowls going forward:
- Bowls are expected to post much faster growth than trays, bolstered by their growing use with frozen dinners and other prepared foods.
- In addition to bowls’ convenience and amenability to portion control, the shelf appeal and recyclability of many available bowls makes them an attractive choice for organic and other premium brands, which seek to impart a modern and healthy aesthetic for their products.
Factors Impacting Tray & Bowl Demand
Food Production Outlook
The most important factor in the amount of food packaging needed is the outlook for food production, both in terms of the volume produced and the types of food that are popular. For instance, food trays and bowls are most widely used in such applications as:
- meat, poultry, and seafood
- prepared foods
- baked goods
- fresh produce
While trends in the amount of food produced and consumed at the aggregate level tend to be relatively stable – tracking growth in population and food pricing levels – the mix of food produced can vary over time under the influence of changing consumer dietary preferences.
Food shipments, including fresh produce, are forecast to rise 2.7% per year to $706 billion in 2025:
- Among the major tray and bowl applications, prepared foods will see the fastest growth, boosted by the trend toward single-serving frozen food options due to their convenience and continued new product introductions.
- Meat, poultry, and seafood will account for the highest share of output value, aided by a renewed focus on proteins for healthy lifestyles, although competition from meat alternatives will limit advances to some degree.
As a result of the COVID-19 pandemic and its attendant lockdowns and stay-at-home orders, the e-commerce channel has grown. That growth has compelled many traditional supermarket and hypermarket chains to expand their already existing pickup and delivery operations.
An important trend affecting traditional brick-and-mortar food retailers and the use of trays and bowls is the increased popularity of prepared foods, which are time-saving alternatives to home-cooked meals. The COVID-19 pandemic had some positive and negative effects on this already popular category as more people worked from home:
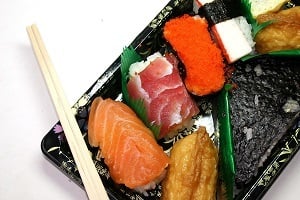
- On one hand, it was hampered by the work-from-home trend as fewer people commuted to offices or were otherwise out-and-about to pick up grab-and-go foods often found in these grocery prepared food sections, such as sandwiches, soups, salads, and sushi.
- On the other hand, the segment got a boost from people who were working from home or who were otherwise eating at home more than in past years.
However, even as social distancing has eased and restaurant dining continues to recover, many consumers are expected to continue to buy prepared meals and dine out less frequently than they did pre-pandemic. This will prompt grocery stores to expand their prepared foods offerings and even partner with restaurants to sell restaurant-prepared meals at the grocery store.
- Executive Summary
- Figure 1-1 | Food Tray & Bowl Market Outlook
- About This Report
- Report Details
- Study Scope & Product Description
- Figure 2-1 | Food Trays & Bowls: Product Examples
- Impact of COVID-19 Pandemic
- Table | Annual Food Tray & Bowl Demand by Product, 2019 – 2022
- Figure 2-2 | Annual Food Tray & Bowl Demand, 2018 – 2023
- Overview
- Historical Market Trends
- Table | Food Tray & Bowl Demand, 2010 – 2021
- Figure 3-1 | Food Tray & Bowl Demand, 2000 – 2021
- Product Overview
- Table | Food Tray & Bowl Demand by Product, 2010 – 2025
- Factors Impacting Tray & Bowl Demand
- Food Production Outlook
- Figure 3-2 | Food Shipments, 2010 – 2025
- Retail Channel Trends
- Importance of Sustainability
- Recycling & Recycled Content
- Compostability
- Food Production Outlook
- Historical Market Trends
- Applications
- Demand by Application
- Table | Food Tray & Bowl Demand by Application, 2010 – 2025
- Figure 4-1 | Food Tray & Bowl Demand by Application, 2010 – 2025
- Meat, Poultry, &Seafood
- Table | Meat, Poultry, &Seafood Tray Demand by Application, 2010 – 2025
- Figure 4-2 | Meat, Poultry, &Seafood Tray Demand by Application, 2010 – 2025
- Prepared Foods
- Table | Prepared Foods Tray & Bowl Demand by Application & Product, 2010 – 2025
- Figure 4-3 | Prepared Foods Tray & Bowl Demand by Application, 2010 – 2025
- Baked Goods
- Table | Baked Goods Tray Demand by Application, 2010 – 2025
- Figure 4-4 | Baked Goods Tray Demand by Application, 2010 – 2025
- Fresh Produce
- Table | Fresh Produce Tray & Bowl Demand by Application & Product, 2010 – 2025
- Figure 4-5 | Fresh Produce Tray & Bowl Demand by Application, 2010 – 2025
- Other Food
- Table | Other Food Tray & Bowl Demand by Application & Product, 2010 – 2025
- Figure 4-6 | Other Food Tray & Bowl Demand by Application, 2010 – 2025
- Demand by Application
- Material Trends
- Demand by Material
- Table | Food Tray & Bowl Demand by Material, 2010 – 2025
- Figure 5-1 | Food Tray & Bowl Demand by Material, 2010 – 2025
- Rigid Plastic
- Table | Rigid Plastic Food Tray & Bowl Demand by Application & Product, 2010 – 2025
- Figure 5-2 | Rigid Plastic Food Tray & Bowl Demand by Application, 2010 – 2025
- Plastic Foam (EPS)
- Table | Plastic Foam Food Tray & Bowl Demand by Application & Product, 2010 – 2025
- Figure 5-3 | Foam Food Tray & Bowl Demand by Application, 2010 – 2025
- Paperboard
- Table | Paperboard Food Tray & Bowl Demand by Application & Product, 2010 – 2025
- Figure 5-4 | Paperboard Food Tray & Bowl Demand by Application, 2010 – 2025
- Molded Fiber (Molded Pulp & Sugarcane)
- Table | Molded Fiber Food Tray & Bowl Demand by Application, Material, &Product, 2010 – 2025
- Figure 5-5 | Molded Fiber Food Tray & Bowl Demand by Application, 2010 – 2025
- Demand by Material
- Food Trays
- Demand by Application
- Table | Food Tray Demand by Application, 2010 – 2025
- Figure 6-1 | Food Tray Demand by Application, 2010 – 2025
- Demand by Material
- Table | Food Tray Demand by Material, 2010 – 2025
- Figure 6-2 | Food Tray & Flat Demand by Material, 2010 – 2025
- Product Innovation
- Leading Suppliers
- Demand by Application
- Food Packaging Bowls
- Demand by Application
- Table | Food Packaging Bowl Demand by Application, 2010 – 2025
- Figure 7-1 | Food Packaging Bowl Demand by Application, 2010 – 2025
- Demand by Material
- Table | Food Packaging Bowl Demand by Material, 2010 – 2025
- Figure 7-2 | Food Packaging Bowl Demand by Material, 2010 – 2025
- Product Innovation
- Leading Suppliers
- Demand by Application
- Key Suppliers & Industry Trends
- Industry Composition
- Key Suppliers
- Mergers & Acquisitions
- Table | Selected Mergers & Acquisitions
- Appendix
- Scope
- Table | Industry Codes Related to Food Packaging Trays & Bowls
- Definitions
- Freedonia Methodology
- Study-Specific Methodology
- Sources
- Related Studies & Reports
- Macroeconomic Assumptions
- Economic Environment
- Table | Macroeconomic Indicators, 2010 – 2025
- Demographics
- Table | Population & Households, 2010 – 2025
- Consumer Spending
- Table | Personal Consumption Expenditures & Retail Sales, 2010 – 2025
- Retail Sales
- Table | Nondurable Goods Retail Sales, 2010 – 2025
- Economic Environment
- Scope
Demand for food packaging trays and bowls is forecast to increase 3.3% per year to $3.1 billion in 2025.
Trays will continue to account for the largest share of demand, supported by their status as one of the leading packaging types in meat, poultry, and seafood applications (as well as baked goods, fresh produce, and frozen food).
Prepared foods will remain the fastest growing segment through 2025, though the mature usage of trays in baked goods and case-ready meats will continue to be the main driver of gains.