US Gaskets & Seals
This study analyzes the US market for gaskets and seals.

Free Sample Report
Request a free sample of this report and our team will email it to you.
Report Overview
12th Edition
This study analyzes the US market for gaskets and seals. The specific products covered are:
- gaskets, segmented into metallic and nonmetallic types (including elastomeric, fiber-based, plastic-based, expanded graphite, cork (which includes cork/rubber composite materials for the purposes of this study), leather, mica, and ceramics)
- molded seals and packings, including O-rings, flexible seals, diaphragm seals, and other molded seals and packings
- body seals, including those used in motor vehicles, machinery, and aerospace and other transportation equipment
- shaft seals, including rotary oil seals and mechanical seals
- compression packings
Featuring 31 tables and 31 figures – now available in Excel and Powerpoint! Learn More
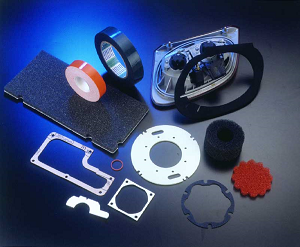
Gaskets and seals are primarily used as components of durable equipment. The market segments broken out in this study are:
- motor vehicles
- machinery, including construction and related equipment; general purpose machinery; engines, turbines, and power transmission equipment; heating, ventilation, air conditioning (HVAC), refrigeration, and service equipment; and other equipment such as metalworking and industrial machinery
- electrical and electronic products, including:
- measuring and controlling equipment such as educational, medical, and scientific instruments; industrial controls; navigation instruments for transportation equipment; air and noise monitoring equipment; leak detection and control instruments; process monitoring; and temperature and pressure gauges (including separately sold aerospace types)
- electrical equipment, which is classified as electrical transmission and distribution equipment, electrical industrial apparatus, lighting and wiring equipment, and miscellaneous electrical goods such as batteries and fuel cells (Gaskets and seals used in turbines and power generating equipment are included with engines, turbines, and power transmission equipment.)
- computers and electronic equipment such as copy and facsimile machines, audio and visual equipment, and other consumer and communications electronic products, as well as electronic components such as semiconductors, electronic capacitors and resistors, electronic coils, transformers, electronic connectors, bare printed circuit boards, and printed circuit assemblies (electronic assemblies)
- appliances, including both major (e.g., dishwashers, ovens, refrigerators, washing machines) and small types, and gaskets and shaft seals utilized in appliance motors
- aerospace equipment (military and commercial aircraft, as well as space vehicles)
- marine and rail equipment
- other markets, including domestic hot water boilers; heat exchangers; plumbing fixtures and fittings; sprinkler systems; steam condensers; transportation equipment such as ATVs, golf carts, motorcycles, tanks and travel trailers; and windows and doors
Historical data (2008, 2013, and 2018) and forecasts for 2023 are provided in current dollars for the market as a whole, as well as for all products and markets listed above.
Demand for gaskets and seals in the US is forecast to increase 3.3% per year through 2023 to $10.3 billion, with sales boosted by ongoing manufacturing gains in a number of durable goods industries.
However, continued improvements in gasket and seal design will limit long term sales potential as the better performance and longer lifespan of sealing products installed in original equipment restricts aftermarket opportunities.
Key Findings in the Gaskets & Seals Study:
Key Product Trends Through 2023
Molded seals and packings are expected to post the strongest advances in demand through 2023, with particularly favorable prospects in machinery and processing equipment, where these products are critical components in hydraulic and other fluid power systems.
Advances in body seals will be hampered by slow growth in the motor vehicle market. However, demand for body seals installed in other transportation equipment, such as aerospace, marine, and rail equipment, will be boosted by strong expected increases in equipment production.
Nonmetallic gaskets will also register below average gains through 2023. Demand will be restrained by ongoing competition with other sealing products, especially metallic gaskets, and the limited performance capabilities of some products included in this segment.
Key Market Trends Through 2023
Although they will remain the largest market segment for gaskets and seals, motor vehicles will register the slowest advances. An expected decline in automobile production will offset advances in heavy truck and bus shipments.
Marine and rail equipment are expected to post the fastest gains of any market segment, though they will remain a small market for gaskets and seals. US production of this equipment is expected to be particularly strong through 2023, bolstering demand for necessary components.
Strong expected output gains for aerospace equipment and machinery, such as off-road equipment (for the agriculture, construction, forestry, and mining industries) and engines, turbines, and power transmission equipment will contribute to above average gasket and seal sales. This is due to the fact that this equipment typically uses a significant quantity of gaskets and seals, and most sealing products used are of higher quality to ensure that the equipment functions properly.
Study Coverage
This Freedonia industry study analyzes the $8.8 billion US gasket and seal market. It presents historical demand data (2008, 2013, and 2018) and forecasts for 2023 by product (conventional metallic gaskets, machined metallic seals, elastomeric gaskets, advanced fiber gaskets, plastic-based gaskets, expanded graphite gaskets, conventional fiber gaskets, molded seals and packings, body seals, shaft seals, and compression packings) and market (motor vehicles; construction and related machinery; general purpose machinery; engine, turbine, and power transmission equipment; HVAC, refrigeration, and service equipment; measuring and control instruments; electrical equipment; computers and electronics; appliances; aerospace equipment; marine and rail equipment). The study also evaluates company market share and analyzes industry competitors including Dana, EnPro Industries, Federal Mogul, Freudenberg, Henniges Automotive, John Crane, Parker Hannifin, and SKF.
- Market Brief
- Figure 1-1 | US Gasket & Seal Market
- Overview
- Factors Impacting Gasket & Seal Demand
- Historical Demand Trends
- Figure 2-1 | Gasket & Seal Demand by Type, 2004 - 2018
- Pricing Trends
- Table | Gasket & Seal Pricing, 2008 - 2023
- Technology & Material Trends
- Products
- Gaskets vs. Seals & Packings
- Table | Gasket & Seal Demand, 2008 - 2023
- Figure 3-1 | Gasket & Seal Demand Share, 2008 - 2023
- Gaskets
- Demand by Product
- Table | Gasket Demand by Product, 2008 - 2023
- Figure 3-2 | Gasket Demand Share by Product, 2018
- Metallic Gaskets
- Table | Metallic Gasket Demand by Type, 2008 - 2023
- Figure 3-3 | Metallic Gaskets Demand by Type, 2004 - 2018
- Nonmetallic Gaskets
- Table | Nonmetallic Gasket Demand by Material, 2008 - 2023
- Figure 3-4 | Nonmetallic Gasket Demand by Material, 2004 - 2018
- Table | Elastomeric Gasket Demand by Type, 2008 - 2023
- Table | Advanced Fiber-Based Gasket Demand by Type, 2008 - 2023
- Table | Plastic-Based Gasket Demand by Type, 2008 - 2023
- Table | Expanded Graphite Gasket Demand, 2008 - 2023
- Table | Conventional Fiber-Based Gasket Demand by Type, 2008 - 2023
- Table | Other Nonmetallic Gasket Demand by Type, 2008 - 2023
- Demand by Product
- Seals & Packings
- Demand by Product
- Table | Seal & Packing Demand by Product, 2008 - 2023
- Figure 3-5 | Seal & Packing Demand Share by Product, 2018
- Molded Seals & Packings
- Table | Molded Seal & Packing Demand by Type, 2008 - 2023
- Figure 3-6 | Molded Seal & Packing Demand by Type, 2004 - 2018
- Body Seals
- Table | Body Seal Demand by Application, 2008 - 2023
- Figure 3-7 | Motor Vehicle Body Seal Demand by Application, 2004 - 2018
- Figure 3-8 | Other Body Seal Demand by Application, 2004 - 2018
- Shaft Seals
- Table | Shaft Seal Demand by Type, 2008 - 2023
- Figure 3-9 | Shaft Seal Demand by Type, 2004 - 2018
- Compression Packings
- Table | Compression Packings Demand by Material, 2008 - 2023
- Figure 3-10 | Compression Packings Demand by Material, 2004 - 2018
- Demand by Product
- Gaskets vs. Seals & Packings
- Markets
- Gasket & Seal Demand by Market & Source
- Table | Gasket & Seal Demand by Market & Source, 2008 - 2023
- Figure 4-1 | Gasket & Seal Demand Share by Market, 2018
- Motor Vehicles
- Table | Motor Vehicle Gasket & Seal Demand by Source, 2008 - 2023
- Figure 4-2 | OEM Motor Vehicle Gasket & Seal Demand, 2004 - 2018
- Figure 4-3 | Aftermarket Motor Vehicle Gasket & Seal Demand, 2004 - 2018
- Machinery
- Demand by Equipment Type & Source
- Table | Machinery Gasket & Seal Demand by Equipment Type & Source, 2008 - 2023
- Figure 4-4 | Machinery Gasket & Seal Demand, 2004 - 2018
- Construction & Related Equipment
- Figure 4-5 | Construction & Related Equipment Gasket & Seal Demand, 2004 - 2018
- General Purpose Machinery
- Figure 4-6 | General Purpose Machinery Gasket & Seal Demand, 2004 - 2018
- Engine, Turbine, &Power Transmission Equipment
- Figure 4-7 | Engine, Turbine, &Power Transmission Equipment Gasket & Seal Demand, 2004 - 2018
- HVAC, Refrigeration, &Service Equipment
- Figure 4-8 | HVAC, Refrigeration, &Service Equipment Gasket & Seal Demand, 2004 - 2018
- Other Machinery
- Figure 4-9 | Other Machinery Gasket & Seal Demand, 2004 - 2018
- Demand by Equipment Type & Source
- Electrical & Electronic Products
- Demand by Product Type & Source
- Table | Electrical & Electronic Gasket & Seal Demand by Product Type & Source, 2008 - 2023
- Figure 4-10 | Electrical & Electronic Product Gasket & Seal Demand, 2004 - 2018
- Measuring & Controlling Instruments
- Figure 4-11 | Measuring & Controlling Instrument Gasket & Seal Demand, 2004 - 2018
- Electrical Equipment
- Figure 4-12 | Electrical Equipment Gasket & Seal Demand, 2004 - 2018
- Computers & Electronic Equipment
- Figure 4-13 | Computers & Electronic Equipment Gasket & Seal Demand, 2004 - 2018
- Appliances
- Figure 4-14 | Appliance Gasket & Seal Demand, 2004 - 2018
- Demand by Product Type & Source
- Aerospace Equipment
- Table | Aerospace Equipment Gasket & Seal Demand by Source, 2008 - 2023
- Figure 4-15 | Aerospace Equipment Gasket & Seal Demand, 2004 - 2018
- Marine & Rail Equipment
- Table | Marine & Rail Equipment Gasket & Seal Demand by Source, 2008 - 2023
- Figure 4-16 | Marine & Rail Gasket & Seal Demand, 2004 - 2018
- Other Markets
- Table | Gasket & Seal Demand in Other Markets by Source, 2008 - 2023
- Figure 4-17 | Gasket & Seal Demand in Other Markets, 2004 - 2018
- Gasket & Seal Demand by Market & Source
- Industry Structure
- Key Findings & Industry Composition
- Table | US Gasket & Seal Sales by Company, 2018
- Market Share
- Figure 5-1 | US Gasket & Seal Market Share by Company, 2018
- Mergers & Acquisitions
- Table | Selected Acquisitions & Divestitures
- Cooperative Agreements
- Table | Selected Cooperative Agreements
- Key Findings & Industry Composition
- Appendix
- Scope
- Table | Relevant NAICS & SIC Codes
- Table | Relevant HS Codes
- Definitions
- Abbreviations
- Table | Abbreviations Used in This Report
- Methodology
- Related Studies & Reports
- Macroeconomic Assumptions
- Economic Environment
- Table | Macroeconomic Indicators, 2008 - 2023
- Figure 6-1 | Annual Growth in Real GDP, 2000 - 2018, Compared to 1980 - 2005 Average
- Manufacturers' Shipments
- Table | Manufacturers' Shipments, 2008 - 2023
- Economic Environment
- Scope