Global Farm Tractors
This Freedonia study analyzes the more than $55 billion global farm tractor market. The study provides agricultural tractor demand for 2011, 2016, and 2021, and forecasts for 2026 and 2031.
Free Sample Report
Request a free sample of this report and our team will email it to you.
Report Overview
According to industry analyst Gleb Mytko, "Tractor sales rebounded at a double-digit annual pace in all regions in 2021, with the Africa/Mideast region, Central and South America, and Eastern Europe registering growth of more than 20%."
This Freedonia study analyzes the more than $55 billion global farm tractor market.  The study provides agricultural tractor demand for 2011, 2016, and 2021, and forecasts for 2026 and 2031. We also offer annual data for all countries for the 2018-2025 period. This study also presents farm tractor demand by type (wheel tractors, crawler tractors, and pedestrian-controlled tractors) for 20 countries. Finally, it evaluates market share for the top six manufacturers worldwide, such as AGCO, Deere, and Kubota.
Featuring 88 tables and 40 figures – available in Excel and Powerpoint! Learn More
- advances in global farming agricultural activity and rising agricultural commodity prices, leading to farm income growth
- farmers increasingly replacing aging machinery and investing in newly developed agricultural technologies as they face a variety of workforce issues (e.g., skilled operator shortages, rising wages, new protections for works)
- high levels of government support for their respective agricultural sectors, ranging from direct subsidies to farmers to programs promoting advanced farming practices to more specialized initiatives (such as a farm machinery rental schemes in India)
- government and industry initiatives designed to insulate farmers from the impact of climate change, reduce the environmental impact of farming, and promote technological innovation in the agricultural sector
Asia/Pacific, North America, & Western Europe Account for Vast Majority of Absolute Gains
The large Asia/Pacific market is projected to register the largest gains during the forecast period; multiple developing and mature markets will perform well through 2026:- The growing use of state-of-the-art tractors – including automated, and electric and hybrid models – will be the leading driver of market gains in countries such as Australia, Japan, South Korea, and Taiwan.
- In developing nations, farmers will increasingly purchase tractors as they shift away from manual farming techniques.
The favorable growth prospects of the mature West European and North American markets can be attributed to the significant tractor replacement needs of both regions. Farmers in Western Europe and North America invest heavily in technology because of their large financial resources and high levels of government support; consequently, they will be among the first adopters of newly developed tractors. The intensification of agricultural sector workforce issues – as well as adoption of new regional and national regulations – will drive investment in newly developed farming technologies.
Demand by Region
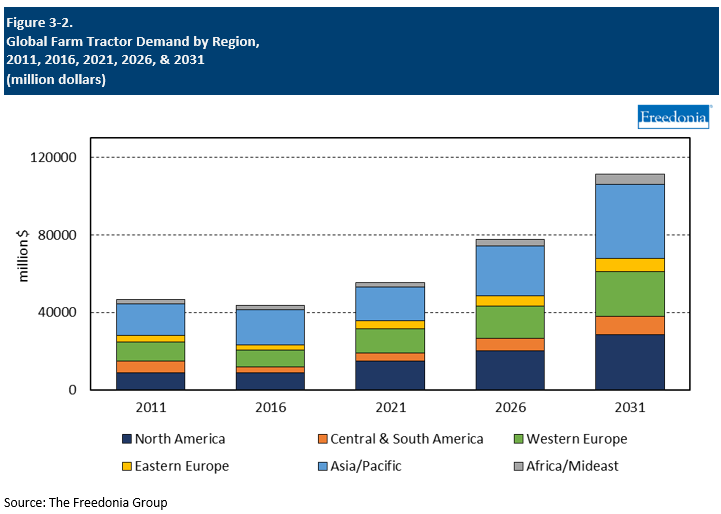
Through 2026, global demand for farm tractors is projected to advance 7.0% annually to $77.8 billion. The use of tractors will continue expanding swiftly in most developing regions because these machines represent the most basic type of agricultural equipment; as such, they are typically the first machines purchased by farmers because they:- perform multiple functions
- are suitable for a wide range of applications, ranging from orchards to grain farming
- have compatibility with numerous attachments
- are available in most countries
- have long lifespans
In North America, Europe, and mature Asia/Pacific markets, tractor segment gains will be bolstered by:
- their massive replacement needs
- the introduction of newly developed models, including those that automate key functions
- the incorporation of new technologies – ranging from sophisticated sensors to advanced hybrid and electric engines – which will drive up machinery prices and contribute to gains in value terms
Agricaltural Commodity Pricing
Changes in commodity prices, and thus farm income, are a key factor in the outlook for the global farm tractor industry. Key commodities include:
-
corn
-
dairy products
-
fresh vegetables
-
potatoes
-
rice
-
soybeans
-
sugar cane
-
wheat
Commodity prices vary around the world, especially at the local level. However, the increasingly global scope of the agricultural industry results in prices settling around global averages.
Crop yields in a given year also affect price. Years with higher than average yields will generally result in lower prices for agricultural goods, while years when crop yields are low can drive up prices.
Fluctuations in crop prices can influence the types of crops produced in a country, as low prices for a certain crop can cause farmers to plant other, more profitable crops for future harvests. Many national governments subsidize crops and offer aid to farmers in an effort to maintain farm production, particularly for strategically important agricultural commodities. However, not all crops are subsidized nor do all nations participate in farm subsidies.
Unlike many industries, where raw material or commodity prices can result in reducing or eliminating production, agricultural commodities are essential for sustaining a healthy population, and thus many farmers continue to grow and produce crops even when prices are low. However, low crop prices do impact a farmer’s ability or willingness to invest in farm tractors – as when crop prices are low there may not be sufficient capital to purchase a new top-of-the-line tractors. In these instances, farmers may choose to repair existing tractors or purchase either lower-priced new tractors or used tractors.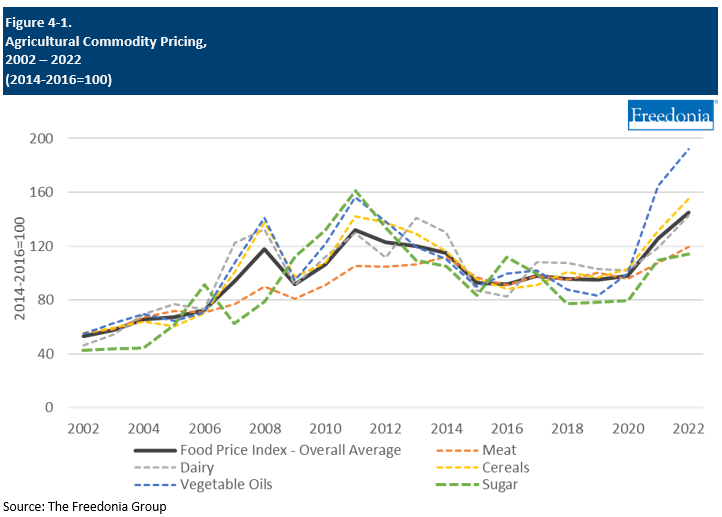
- advances in global farming agricultural activity and rising agricultural commodity prices, leading to farm income growth
- farmers increasingly replacing aging machinery and investing in newly developed agricultural technologies as they face a variety of workforce issues (e.g., skilled operator shortages, rising wages, new protections for works)
- high levels of government support for their respective agricultural sectors, ranging from direct subsidies to farmers to programs promoting advanced farming practices to more specialized initiatives (such as a farm machinery rental schemes in India)
- government and industry initiatives designed to insulate farmers from the impact of climate change, reduce the environmental impact of farming, and promote technological innovation in the agricultural sector
Asia/Pacific, North America, & Western Europe Account for Vast Majority of Absolute Gains
The large Asia/Pacific market is projected to register the largest gains during the forecast period; multiple developing and mature markets will perform well through 2026:- The growing use of state-of-the-art tractors – including automated, and electric and hybrid models – will be the leading driver of market gains in countries such as Australia, Japan, South Korea, and Taiwan.
- In developing nations, farmers will increasingly purchase tractors as they shift away from manual farming techniques.
The favorable growth prospects of the mature West European and North American markets can be attributed to the significant tractor replacement needs of both regions. Farmers in Western Europe and North America invest heavily in technology because of their large financial resources and high levels of government support; consequently, they will be among the first adopters of newly developed tractors. The intensification of agricultural sector workforce issues – as well as adoption of new regional and national regulations – will drive investment in newly developed farming technologies.
Demand by Region
Through 2026, global demand for farm tractors is projected to advance 7.0% annually to $77.8 billion. The use of tractors will continue expanding swiftly in most developing regions because these machines represent the most basic type of agricultural equipment; as such, they are typically the first machines purchased by farmers because they:- perform multiple functions
- are suitable for a wide range of applications, ranging from orchards to grain farming
- have compatibility with numerous attachments
- are available in most countries
- have long lifespans
In North America, Europe, and mature Asia/Pacific markets, tractor segment gains will be bolstered by:
- their massive replacement needs
- the introduction of newly developed models, including those that automate key functions
- the incorporation of new technologies – ranging from sophisticated sensors to advanced hybrid and electric engines – which will drive up machinery prices and contribute to gains in value terms

Agricaltural Commodity Pricing
Changes in commodity prices, and thus farm income, are a key factor in the outlook for the global farm tractor industry. Key commodities include:
-
corn
-
dairy products
-
fresh vegetables
-
potatoes
-
rice
-
soybeans
-
sugar cane
-
wheat
Commodity prices vary around the world, especially at the local level. However, the increasingly global scope of the agricultural industry results in prices settling around global averages.
Crop yields in a given year also affect price. Years with higher than average yields will generally result in lower prices for agricultural goods, while years when crop yields are low can drive up prices.
Fluctuations in crop prices can influence the types of crops produced in a country, as low prices for a certain crop can cause farmers to plant other, more profitable crops for future harvests. Many national governments subsidize crops and offer aid to farmers in an effort to maintain farm production, particularly for strategically important agricultural commodities. However, not all crops are subsidized nor do all nations participate in farm subsidies.
Unlike many industries, where raw material or commodity prices can result in reducing or eliminating production, agricultural commodities are essential for sustaining a healthy population, and thus many farmers continue to grow and produce crops even when prices are low. However, low crop prices do impact a farmer’s ability or willingness to invest in farm tractors – as when crop prices are low there may not be sufficient capital to purchase a new top-of-the-line tractors. In these instances, farmers may choose to repair existing tractors or purchase either lower-priced new tractors or used tractors.

- Executive Summary
- Figure 1-1. Global Farm Tractor Market Outlook
- About This Report
- Report Details
- Study Scope & Product Description
- Figure 2-1. Farm Tractors: Product Examples
- Impact of the COVID-19 Pandemic
- Table | Annual Global Farm Tractor Demand by Region, 2019 – 2022
- Table | Annual Global Farm Tractor Demand by Type, 2019 – 2022
- Figure 2-2. Annual Global Farm Tractor Demand Growth, 2019 – 2024
- Overview
- Historical Market Trends
- Table | Global Farm Tractor Demand, 2011 – 2021
- Figure 3-1. Global Farm Tractor Demand, 2003 – 2021
- Demand by Region
- Table | Global Farm Tractor Demand by Region, 2011, 2016, 2021, 2026, &2031
- Table | Annual Global Farm Tractor Demand by Region, 2018 – 2025
- Figure 3-2. Global Farm Tractor Demand by Region, 2011, 2016, 2021, 2026, &2031
- Demand by Type
- Table | Global Farm Tractor Demand by Type, 2011, 2016, 2021, 2026, &2031
- Table | Annual Global Farm Tractor Demand by Type, 2018 – 2025
- Wheeled Tractors
- Table | Global Wheeled Farm Tractor Demand by Region, 2011, 2016, 2021, 2026, &2031
- Table | Annual Global Wheeled Farm Tractor Demand by Region, 2018 – 2025
- Crawler Tractors
- Table | Global Crawler Farm Tractor Demand by Region, 2011, 2016, 2021, 2026, &2031
- Table | Annual Global Crawler Farm Tractor Demand by Region, 2018 – 2025
- Pedestrian-Controlled Tractors
- Table | Global Pedestrian-Controlled Farm Tractor Demand by Region, 2011, 2016, 2021, 2026, &2031
- Table | Annual Global Pedestrian-Controlled Farm Tractor Demand by Region, 2018 – 2025
- Leading Country Markets
- Figure 3-3. Global Farm Tractors: Leading Country Markets, 2021
- Pricing Trends
- Figure 3-4. Global Farm Tractor Prices, 2016 – 2026
- International Trade
- Market Share
- Figure 3-5. Global Farm Tractor Market Share by Company, 2021
- Historical Market Trends
- Factors Impacting Farm Tractor Demand
- Global Agricultural Outlook
- Table | Global Agricultural Value Added, 2011, 2016, 2021, 2026, &2031
- Table | Annual Global Agricultural Value Added, 2018 – 2025
- Agricultural Commodity Pricing
- Figure 4-1. Agricultural Commodity Pricing, 2002 – 2022
- Labor Force Productivity in Agriculture
- Government Subsidies & Regulations
- Crop Subsidies
- Emissions Regulations
- Safety Regulations
- Technical Standards
- Technology Trends
- Current Farm Tractor Technology
- Technological Outlook: Automation & Other Advanced Technologies
- Functional Competition (Used & Rebuilt Equipment)
- Global Agricultural Outlook
- North America
- North America: Farm Tractor Market Size
- North America: Demand by Country & Type
- Table | North America: Farm Tractor Demand by Country & Type, 2011, 2016, 2021, 2026, &2031
- Table | North America: Annual Farm Tractor Demand by Country & Type, 2018 – 2025
- Figure 5-1. North America: Farm Tractor Demand by Country & Type, 2021
- United States
- Table | United States: Farm Tractor Demand by Type, 2011, 2016, 2021, 2026, &2031
- Table | United States: Annual Farm Tractor Demand by Type, 2018 – 2025
- Figure 5-2. United States: Farm Tractor Demand by Type, 2003 – 2021
- Canada
- Table | Canada: Farm Tractor Demand by Type, 2011, 2016, 2021, 2026, &2031
- Table | Canada: Annual Farm Tractor Demand by Type, 2018 – 2025
- Figure 5-3. Canada: Farm Tractor Demand by Type, 2003 – 2021
- Mexico
- Table | Mexico: Farm Tractor Demand by Type, 2011, 2016, 2021, 2026, &2031
- Table | Mexico: Annual Farm Tractor Demand by Type, 2018 – 2025
- Figure 5-4. Mexico: Farm Tractor Demand by Type, 2003 – 2021
- Central & South America
- Central & South America: Farm Tractor Market Size
- Central & South America: Demand by Country & Type
- Table | Central & South America: Farm Tractor Demand by Country & Type, 2011, 2016, 2021, 2026, &2031
- Table | Central & South America: Annual Farm Tractor Demand by Country & Type, 2018 – 2025
- Figure 6-1. Central & South America: Farm Tractor Demand by Country & Type, 2021
- Brazil
- Table | Brazil: Farm Tractor Demand by Type, 2011, 2016, 2021, 2026, &2031
- Table | Brazil: Annual Farm Tractor Demand by Type, 2018 – 2025
- Figure 6-2. Brazil: Farm Tractor Demand by Type, 2003 – 2021
- Argentina
- Table | Argentina: Farm Tractor Demand by Type, 2011, 2016, 2021, 2026, &2031
- Table | Argentina: Annual Farm Tractor Demand by Type, 2018 – 2025
- Figure 6-3. Argentina: Farm Tractor Demand by Type, 2003 – 2021
- Other Central & South America
- Table | Other Central & South America: Farm Tractor Demand by Type, 2011, 2016, 2021, 2026, &2031
- Table | Other Central & South America: Annual Farm Tractor Demand by Type, 2018 – 2025
- Figure 6-4. Other Central & South America: Farm Tractor Demand by Type, 2003 – 2021
- Western Europe
- Western Europe: Farm Tractor Market Size
- Western Europe: Demand by Country & Type
- Table | Western Europe: Farm Tractor Demand by Country & Type, 2011, 2016, 2021, 2026, &2031
- Table | Western Europe: Annual Farm Tractor Demand by Country & Type, 2018 – 2025
- Figure 7-1. Western Europe: Farm Tractor Demand by Country & Type, 2021
- France
- Table | France: Farm Tractor Demand by Type, 2011, 2016, 2021, 2026, &2031
- Table | France: Annual Farm Tractor Demand by Type, 2018 – 2025
- Figure 7-2. France: Farm Tractor Demand by Type, 2003 – 2021
- Italy
- Table | Italy: Farm Tractor Demand by Type, 2011, 2016, 2021, 2026, &2031
- Table | Italy: Annual Farm Tractor Demand by Type, 2018 – 2025
- Figure 7-3. Italy: Farm Tractor Demand by Type, 2003 – 2021
- Germany
- Table | Germany: Farm Tractor Demand by Type, 2011, 2016, 2021, 2026, &2031
- Table | Germany: Annual Farm Tractor Demand by Type, 2018 – 2025
- Figure 7-4. Germany: Farm Tractor Demand by Type, 2003 – 2021
- United Kingdom
- Table | United Kingdom: Farm Tractor Demand by Type, 2011, 2016, 2021, 2026, &2031
- Table | United Kingdom: Annual Farm Tractor Demand by Type, 2018 – 2025
- Figure 7-5. United Kingdom: Farm Tractor Demand by Type, 2003 – 2021
- Spain
- Table | Spain: Farm Tractor Demand by Type, 2011, 2016, 2021, 2026, &2031
- Table | Spain: Annual Farm Tractor Demand by Type, 2018 – 2025
- Figure 7-6. Spain: Farm Tractor Demand by Type, 2003 – 2021
- Netherlands
- Table | Netherlands: Farm Tractor Demand by Type, 2011, 2016, 2021, 2026, &2031
- Table | Netherlands: Annual Farm Tractor Demand by Type, 2018 – 2025
- Figure 7-7. Netherlands: Farm Tractor Demand by Type, 2023 – 2021
- Other Western Europe
- Table | Other Western Europe: Farm Tractor Demand by Type, 2011, 2016, 2021, 2026, &2031
- Table | Other Western Europe: Annual Farm Tractor Demand by Type, 2018 – 2025
- Figure 7-8. Other Western Europe: Farm Tractor Demand by Type, 2003 – 2021
- Eastern Europe
- Eastern Europe: Farm Tractor Market Size
- Eastern Europe: Demand by Country & Type
- Table | Eastern Europe: Farm Tractor Demand by Country & Type, 2011, 2016, 2021, 2026, &2031
- Table | Eastern Europe: Annual Farm Tractor Demand by Country & Type, 2018 – 2025
- Figure 8-1. Eastern Europe: Farm Tractor Demand by Country & Type, 2021
- Russia
- Table | Russia: Farm Tractor Demand by Type, 2011, 2016, 2021, 2026, &2031
- Table | Russia: Annual Farm Tractor Demand by Type, 2018 – 2025
- Figure 8-2. Russia: Farm Tractor Demand by Type, 2003 – 2021
- Poland
- Table | Poland: Farm Tractor Demand by Type, 2011, 2016, 2021, 2026, &2031
- Table | Poland: Annual Farm Tractor Demand by Type, 2018 – 2025
- Figure 8-3. Poland: Farm Tractor Demand by Type, 2003 – 2021
- Other Eastern Europe
- Table | Other Eastern Europe: Farm Tractor Demand by Type, 2011, 2016, 2021, 2026, &2031
- Table | Other Eastern Europe: Annual Farm Tractor Demand by Type, 2018 – 2025
- Figure 8-4. Other Eastern Europe: Farm Tractor Demand by Type, 2003 – 2021
- Asia/Pacific
- Asia/Pacific: Farm Tractor Market Size
- Asia/Pacific: Demand by Country & Type
- Table | Asia/Pacific: Farm Tractor Demand by Country & Type, 2011, 2016, 2021, 2026, &2031
- Table | Asia/Pacific: Annual Farm Tractor Demand by Country & Type, 2018 – 2025
- Figure 9-1. Asia/Pacific: Farm Tractor Demand by Country & Type, 2021
- China
- Table | China: Farm Tractor Demand by Type, 2011, 2016, 2021, 2026, &2031
- Table | China: Annual Farm Tractor Demand by Type, 2018 – 2025
- Figure 9-2. China: Farm Tractor Demand by Type, 2003 – 2021
- India
- Table | India: Farm Tractor Demand by Type, 2011, 2016, 2021, 2026, &2031
- Table | India: Annual Farm Tractor Demand by Type, 2018 – 2025
- Figure 9-3. India: Farm Tractor Demand by Type, 2003 – 2021
- Japan
- Table | Japan: Farm Tractor Demand by Type, 2011, 2016, 2021, 2026, &2031
- Table | Japan: Annual Farm Tractor Demand by Type, 2018 – 2025
- Figure 9-4. Japan: Farm Tractor Demand by Type, 2003 – 2021
- Australia
- Table | Australia: Farm Tractor Demand by Type, 2011, 2016, 2021, 2026, &2031
- Table | Australia: Annual Farm Tractor Demand by Type, 2018 – 2025
- Figure 9-5. Australia: Farm Tractor Demand by Type, 2003 – 2021
- South Korea
- Table | South Korea: Farm Tractor Demand by Type, 2011, 2016, 2021, 2026, &2031
- Table | South Korea: Annual Farm Tractor Demand by Type, 2018 – 2025
- Figure 9-6. South Korea: Farm Tractor Demand by Type, 2003 – 2021
- Thailand
- Table | Thailand: Farm Tractor Demand by Type, 2011, 2016, 2021, 2026, &2031
- Table | Thailand: Annual Farm Tractor Demand by Type, 2018 – 2025
- Figure 9-7. Thailand: Farm Tractor Demand by Type, 2003 – 2021
- Other Asia/Pacific
- Table | Other Asia/Pacific: Farm Tractor Demand by Type, 2011, 2016, 2021, 2026, &2031
- Table | Other Asia/Pacific: Annual Farm Tractor Demand by Type, 2018 – 2025
- Figure 9-8. Other Asia/Pacific: Farm Tractor Demand by Type, 2003 – 2021
- Africa/Mideast
- Africa/Mideast: Farm Tractor Market Size
- Africa/Mideast: Demand by Country & Type
- Table | Africa/Mideast: Farm Tractor Demand by Country & Type, 2011, 2016, 2021, 2026, &2031
- Table | Africa/Mideast: Annual Farm Tractor Demand by Country & Type, 2018 – 2025
- Figure 10-1. Africa/Mideast: Farm Tractor Demand by Country & Type, 2021
- Turkey
- Table | Turkey: Farm Tractor Demand by Type, 2011, 2016, 2021, 2026, &2031
- Table | Turkey: Annual Farm Tractor Demand by Type, 2018 – 2025
- Figure 10-2. Turkey: Farm Tractor Demand by Type, 2003 – 2021
- Other Africa/Mideast
- Table | Other Africa/Mideast: Farm Tractor Demand by Type, 2011, 2016, 2021, 2026, &2031
- Table | Other Africa/Mideast: Annual Farm Tractor Demand by Type, 2018 – 2025
- Figure 10-3. Other Africa/Mideast: Farm Tractor Demand by Type, 2003 – 2021
- Appendix
- Scope
- Table | Relevant HS Codes
- Table | Relevant NAICS & SIC Codes
- Table | Relevant NACE Codes
- Definitions
- Freedonia Methodology
- Study-Specific Methodology
- Sources
- Associations & Agencies
- Related Studies & Reports
- Country Lists by Region
- Table | Countries in North America
- Table | Countries in Central & South America
- Table | Countries in Western Europe
- Table | Countries in Eastern Europe
- Table | Countries in the Asia/Pacific Region
- Table | Countries in the Africa/Mideast Region
- Macroeconomic Assumptions
- Economic Environment
- Table | Global Gross Domestic Product by Region & Country, 2011, 2016, 2021, 2026, &2031
- Demographic Trends
- Table | Global Population by Region & Country, 2011, 2016, 2021, 2026, &2031
- Economic Environment
- Scope
Changes in farm income (and the value of agricultural products sold) are a key factor in the outlook for farm tractor purchases, especially for farmers that are unable to finance large purchases.
Worldwide demand for farm tractors is forecast to grow 7.0% per year to $77.8 billion in 2026.
In value terms, wheeled tractors account for the vast majority of farm tractor sales.
In 2021, the leading suppliers of agricultural tractors were (in descending order) Deere (US), CNH Industrial (UK), Kubota (Japan), AGCO (US), CLAAS (Germany), and Mahindra (India).