Report Overview
 Learn more about the global nonwovens market:
-
Aging populations influencing demand for personal care nonwovens in developed markets
-
Medical/surgical market to remain elevated
-
Sustainability concerns driving product development
This Freedonia industry study analyzes the 12.0 million metric ton global nonwovens industry. It presents historical demand data (2012, 2017, and 2022) and forecasts (2027 and 2032) by application (disposables, durables), web formation process (spunmelt, carded, wetlaid, airlaid), market (personal hygiene, wipes, construction, filtration, medical/surgical, motor vehicle, other markets), and region (North America, Central and South America, Western Europe, Eastern Europe, Asia/Pacific, Africa/Midesat). Demand in dollar and area terms are also addressed. The study also evaluates company market share and competitive analysis on industry competitors including Ahlstrom, Berry Global, Fitesa, Freudenberg, and Kimberly-Clark.
Featuring 276 tables and 105 figures – available in Excel and Powerpoint! Learn More
Read the Blog: Nonwoven Updates – Legislation and Other Factors Affecting the Industry
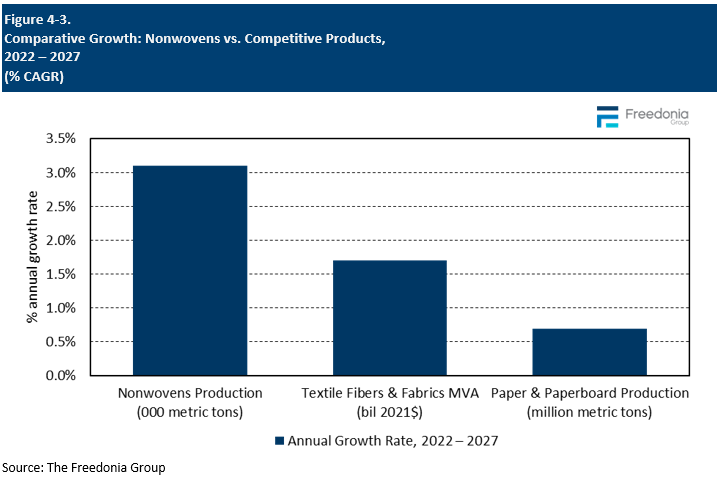
Global demand for nonwovens is forecast to increase 3.1% per year to 14.1 million metric tons in 2027. Improving standards of living will boost demand for nonwovens used in consumer and medical products, with expanding manufacturing activity further driving gains in a variety of durable goods applications.
Market value is expected to rise 3.4% per year to $63.1 billion, a deceleration from the prior five-year period as price growth moderates following above-average increases from 2020 to 2022 that resulted from:
-
supply chain disruptions associated with the pandemic, as producers faced unreliable logistics and inconsistent raw materials supply
-
surging demand for certain nonwoven-inclusive products, most notably medical masks
-
a spike in the prices of oil and petroleum products following the 2022 onset of the Russia-Ukraine war
Global Demographic Changes Altering Personal Hygiene Market
Personal hygiene products are the most significant individual market for nonwovens, and infant diapers and training pants represent the largest segment of that market. Rising standards of living will enable greater penetration of these products in lower-income markets, but shifting demographics worldwide will challenge stronger gains.
Most high-income nations have faced flat-to-declining populations for some time, and the under-five population is forecast to shrink through 2027 in both North America and Europe. In addition, middle-income countries entering the high-earning ranks are displaying similar demographic trends, with birthrates falling as income levels rise. Most notably, China’s birthrate dropped considerably during the COVID-19 pandemic, and a steep decline in the under-five population will greatly hamper opportunities for nonwovens in infant-related personal hygiene products.
These challenges will be somewhat offset by rapid growth in the world’s population of individuals aged 65-and-older, reflecting the aging of earlier generations combined with improved healthcare. Growth in this segment will support healthy demand gains for adult incontinence products, which currently represent a minority of the personal hygiene nonwovens market.
Meltblown Nonwovens Producers Facing Overcapacity
Meltblown nonwovens were the product segment most severely impacted by the COVID-19 pandemic, as booming demand for medical masks led to high levels of capacity investment in this relatively low-volume segment. As demand waned following the peak of the pandemic, the global meltblown nonwovens industry was left with significant excess capacity. To make use of it, producers are working to broaden applications for these materials and exploring opportunities for greater use of nonwovens in markets like wipes and filtration.
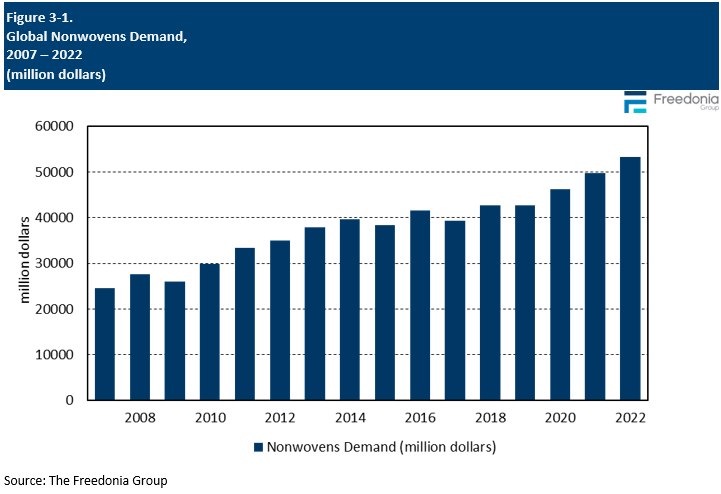
Historical Market Trends
Demand for nonwovens is primarily driven by trends in manufacturing industries. Due to the wide variety of applications for these materials, demand is not linked particularly closely to any one industry. As a result, for most of recent history, the market size in weight terms has steadily increased with expanding economic development globally.
A large share of nonwovens are used in consumer cleaning and hygiene products, which typically have relatively little year-to-year volatility. Demand in these segments tends to be driven by population growth and income levels, and rising consumer spending in the industrializing world fueled healthy growth throughout the 2010s. Similarly, expanding populations and improving standards of living have precipitated greater healthcare spending around the world, thereby aiding demand in the medical/surgical segment.
The nonwovens industry does include some segments that tend to feature relatively high volatility, most notably construction and motor vehicles. Trends in the motor vehicle industry also impact demand for nonwovens in the filtration market, as motor vehicles use a multitude of filters.
The COVID-19 pandemic induced significant short-term changes in global use of nonwovens, which offset the generally negative impact on manufacturing industries. Most notably, demand for disposable medical masks ballooned, thereby fueling dramatic demand growth for nonwoven materials used therein. In addition, greater attention to sanitation supported the use of cleaning products and, in many markets, boosted demand for nonwovens in consumer wipes.
The global nonwovens market is significantly more volatile when examined by value rather than by weight. The cost of nonwovens is tied to prices for petroleum products, which can vary greatly from year-to-year. Prices of nonwovens are also linked to conditions in the broader supply chain, so inflationary environments – like the one experienced during the COVID-19 pandemic – can precipitate large year-over-year changes in market value.
Value, Pricing, & Product Mix
Market Value
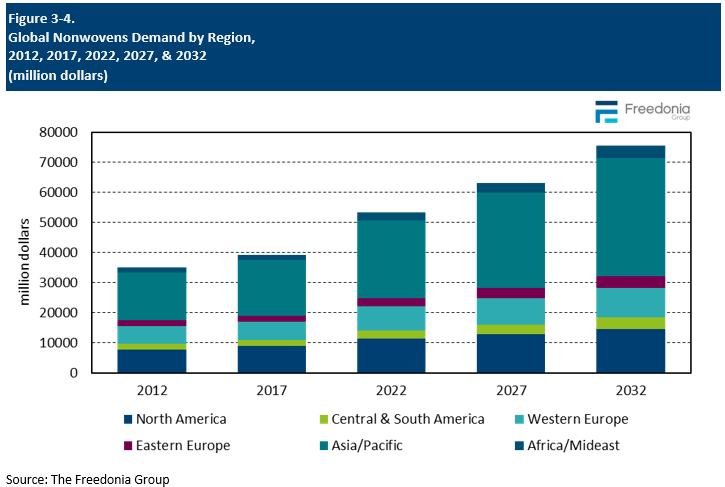
Global demand for nonwovens is forecast to increase 3.4% per year to $63.1 billion in 2027, fueled by gains in volume terms that will result from broad, worldwide growth in the manufacturing of consumer and industrial goods. The pace of gains will be slower than was seen between 2017 and 2022, though, as price increases are expected to moderate following a period of high inflation associated with the COVID-19 pandemic.
Asia/Pacific is expected to post the largest gains, rising to half of the world market in 2027. The region represents a somewhat smaller share of the total by value than by weight, reflecting relatively low price levels in many lower-income countries. Growth will be driven by expansion in the region’s lower-income countries:
-
Improving standards of living will boost demand for and production of wipes and personal hygiene products.
-
Development of regional manufacturing industries will support sales in applications like filtration, motor vehicles, and electrical and electronic equipment.
North America and Western Europe will continue to be important outlets for higher-end nonwovens and contribute to large markets for these products (in value terms). However, growth will be restrained by market maturity in both regions. Eastern Europe holds stronger growth prospects, as demand will be boosted by expansion of manufacturing industries throughout the region.
Africa/Mideast and Central and South America will remain among the world’s smallest regional markets for nonwovens in 2027. Both regions have underdeveloped manufacturing sectors, with limited financial flexibility reducing average price levels and further restraining the market size by value.
Competitive Materials
Nonwoven fabrics compete with a variety of other materials, including:
The decision to use one material instead of another is generally based on cost and performance considerations.
In most applications, nonwovens compete against woven or knitted fabrics – especially in such markets as apparel, bandages, furniture, household fabrics, geotextiles, and surgical gowns. These materials compete on both cost and performance. Nonwovens are significantly less costly than conventional woven or knit textiles, primarily because of greater production speed.
Lower production costs allow nonwovens to be used in short-life and disposables applications, where the costs of woven textiles limit their involvement. Disposability is particularly important in personal hygiene and medical applications because cleanliness and freshness are priorities.
In addition, the performance characteristics of nonwovens are more easily manipulated than those of conventional textiles. Nonwovens can be engineered to meet a particular application’s requirements by varying fibers, resins, finishing treatments, and web formation and bonding processes to provide the desired characteristics (level of absorbency, chemical reactivity, durability, softness, and strength). However, woven and knitted fabrics are generally stronger and more durable for use in long-life applications such as furniture, geotextiles, and home textiles.
In applications such as filters and wipes, nonwovens also compete with paper products. For these uses, paper is generally employed when lower cost is prioritized, while nonwovens are used when additional strength, durability, and softness are required.
Plastic sheeting competes with nonwovens in applications such as agricultural film, bandages, packaging, and protective clothing. Foam competes with nonwovens in applications like insulation, mattress pads, and upholstery backing.