Report Overview
-
Gutter guards will continue to grow in market share
-
Plastic gutter guards will continue to penetrate the market
This Freedonia industry study analyzes the $8 billion US market for gutters and downspouts. It presents historical demand data (2012, 2017, and 2022) and forecasts (2027 and 2032) as well as annual data for years 2019-2026. Unit demand and value demand data is shown for gutters and downspouts by material (steel, aluminum, plastic, copper), product type (gutters, downspouts, gutter guards, hardware & accessories) and market (new, improvement, and repair demand in both residential and commercial applications). The study also evaluates company market share and competitive analysis on industry competitors including Cornerstone, Leaf Home Solutions, OmniMax, Spectra Metals, and TopBuild.
Featuring 131 tables and 52 figures – available in Excel and Powerpoint! Learn about our Data Visualization Kit
Check out our recent discussion of Gutter Guards as well!
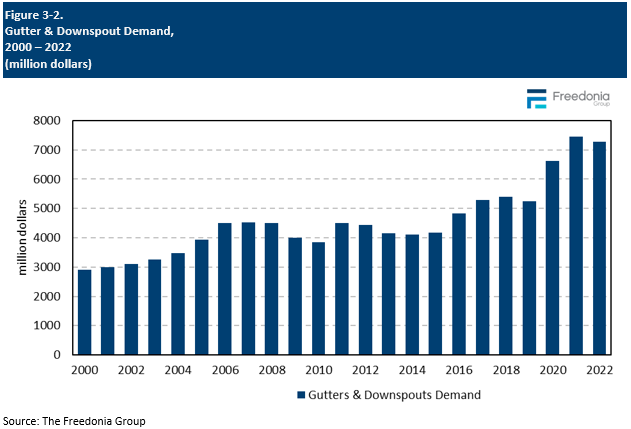
US demand for gutters and downspouts is forecast to rise less than 1.0% annually to 2.1 billion linear feet in 2027. While this rate of increase is not especially strong, it will represent a return to growth following the declines of the previous period, which were negatively impacted by a moderation in residential building construction in 2022. Rebounding commercial building construction will provide opportunities for gutter and downspout sales, as will an increase in single-family housing starts and improvement and repair activity in the latter part of the forecast period.
In value terms, demand is expected to grow 2.7% annually to $8.3 billion – a significant deceleration from the 2017-2022 period; market value in that span was boosted by price surges in 2021 and 2022, which resulted from a combination of supply chain issues and rising raw material costs.
Following Initial Weakness, Residential Market Will See Gains in Latter Part of Forecast Period
Following significantly elevated levels of gutter and downspout sales in 2020 and 2021, real demand in 2022 moderated as high interest rates and economic uncertainty began to weigh on the housing industry. Demand declined sharply in 2023 as housing starts fell and improvement and repair activity declined. However, these underlying indicators are expected to improve through the rest of the forecast period, with single-family housing starts returning to growth as interest rates ease and improvement and repair activity steadily rising, supporting the replacement of aging gutters and downspouts and the addition of gutter guards on existing homes.
Gutter Guards Will Grow in Popularity Among Homeowners
Demand for gutter guards – which are designed to keep leaves, pine needles, and other debris out of gutters – will rise as homeowners increasingly install these items to minimize the need to periodically clean gutters, a time-consuming and potentially dangerous task. Aluminum gutter guards will continue to account for the largest share of demand due to their light weight, which support their use among both professionals and DIYers. However, plastic gutter guards will continue to penetrate the market due to the wide variety of gutter guard options offered in plastic and the lower cost of these products compared to those made from aluminum and other metals.
Historical Market Trends
For the most part, sales of gutter and downspout products are dependent upon new building construction and a relatively predictable replacement cycle for existing buildings, with the residential aftermarket accounting for the vast majority of sales.
Demand tends to track changes in building construction activity although growth for gutters and downspouts is generally slower than that for overall construction, due primarily to the commodity nature of the products and the maturity of the market.
However, spending on gutter and downspout products can exceed growth in building construction during downturns due to:
-
the need to repair or replace gutters and downspouts in case of damage, which is not a discretionary expense for most homeowners
-
outbreaks of severe weather (such as hurricanes and tornadoes) that can cause damage to structures across a wide area, as demand for gutter systems may rise even if overall construction spending contracts
- the modest cost of gutter replacement compared to other home improvement projects can be attractive to homeowners who want to upgrade the appearance or function of their homes
Products Overview
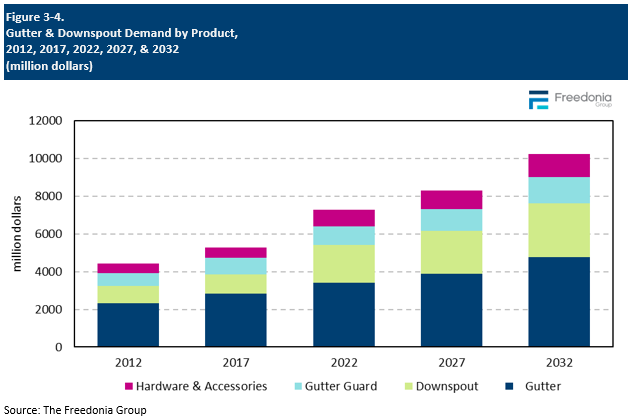
Market Value
Market value for gutter system products – including gutters, downspouts, gutter guards, and related hardware and accessories – is projected to rise 2.7% per year to $8.3 billion in 2027. Advances will come from:
Most rainware products are specified due to their durability and functionality, not for aesthetics; therefore, consumers generally choose gutters and downspouts based on price. This limits opportunities for value growth, as few consumers will opt for costly products like copper gutters and downspouts.
Demand for gutter guards does not necessarily track that of gutters. In fact, it is heavily dependent on residential applications because many homeowners add these products to existing gutters at a later date. This has fostered a secondary market; makers of gutter guard systems offer their products at premium prices, often having their own network of contractors who install their products to specification.. However, many gutter guards (especially those installed by DIY homeowners) are fairly inexpensive, which serves as a check on overall value demand advances.
Materials Overview
Gutter and downspout products are manufactured from a range of materials, including:
-
metals (aluminum, steel, copper, and zinc)
-
plastics (primarily polyvinyl chloride)
-
wood (mostly cedar and redwood)
-
fiberglass
-
concrete
Gutter and downspout materials must be rigid, corrosion, and impact resistant, and able to tolerate extremes of heat or cold.
Cost is among the most important factors that affects choice of rainware material. Materials are sold at a wide range of price points:
-
Plastics are the least expensive per foot.
-
Metals like aluminum and steel are mid-priced, though the cost of the latter has risen faster than the former over the last decade; that trend is currently intensified by higher tariffs on steel.
-
Copper, zinc, and wood are the most expensive (and least used) materials.
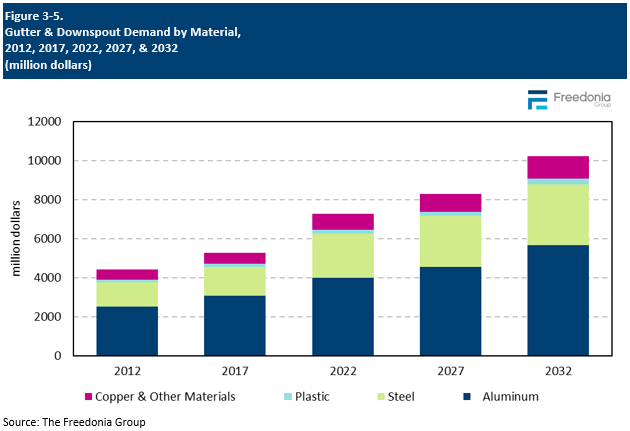
Aluminum will continue to be the most widely used gutter and downspout material. Steel products account for a smaller portion of demand, reflecting their low-volume use in the large residential market.
Use of plastic is limited by its low durability compared to metal, but cost-competitive vinyl rainware products are specified by some homeowners. Demand growth for plastic gutter and downspout products will come from the rising market penetration of gutter guards, a broad range of which – from the lowest priced types to costly proprietary systems – use plastic for its versatility and compatibility with all gutter types.
Gutter and downspout products made from copper and other materials account for a larger share of market value than volume because they are costly. Products made from these materials only account for a small share of total demand volume (and will continue to do so) due to both that expense and the fact that aluminum and steel can often provide the necessary performance.
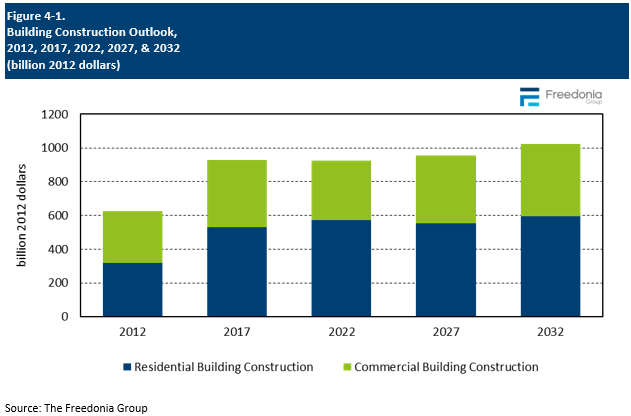
Building Construction Outlook
For the most part, sales of gutter and downspout products are dependent upon new building construction and a relatively predictable replacement cycle for existing buildings. With the residential aftermarket accounting for the vast majority of sales.
Demand tends to track changes in building construction activity, although growth for gutters and downspouts is generally slower than overall construction. This is largely attributable to the commodity nature of the products and the maturity of the market.
Real building construction activity is forecast to increase by an average of nearly 1.0% per year through 2027 to $954 billion. Residential building construction is expected to stagnate because expenditures declined again in 2023 following a sharp drop in 2022, which was the result of:
However, residential building construction will return to growth in 2024 as inflationary pressures retreat and the limited inventory of existing houses for sale will support demand for new single-family units. Elevated interest rates will remain an obstacle for residential construction in the near-term.
Commercial building construction is anticipated to rebound from the pandemic-induced losses incurred between 2017 and 2022, thereby supporting the construction of manufacturing and warehouse facilities and office, retail, and lodging sites. Building owners are also expected to engage in renovations that had been delayed during previous years.