Report Overview
See why professional demand for hand tools will provide a positive outlook for the market through 2027.
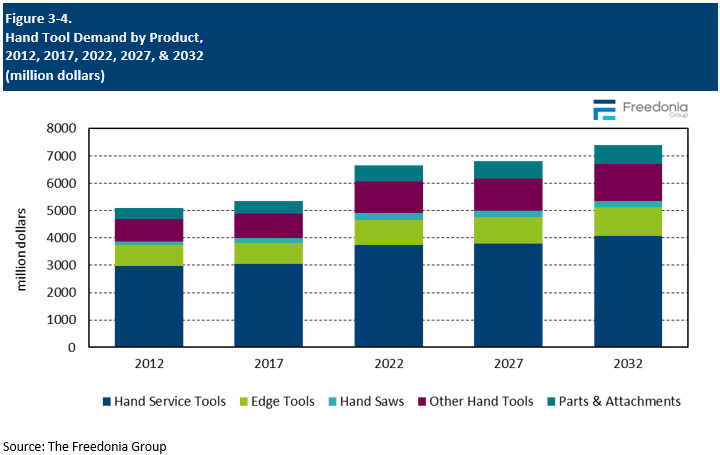
This Freedonia industry study analyzes the $6.7 billion US hand tool industry.  It presents historical demand data (2012, 2017 and 2022) and forecasts (2027 and 2032). Annual data from 2019-2026 is also presented. Tools purchased as a part of a tool set are included in each individual product category. Hand tool product categories encompass:
- hand service tools (specialized automotive tools such as airbag deployment tools, distributor clamp wrenches, lug wrenches, manual and hydraulic automobile jacks, muffler chisels, and seal replacers; wrenches; pliers; screwdrivers; hammers; and other hand service tools such as sledges, picks, mauls, nail pullers, clamps, caulking guns, and miscellaneous carpentry tools)
- edge tools (paint and masonry tools such as glasscutters, patching knives, putty knives, scrapers, spackling knives, taping knives, utility knives, and wallpaper strippers; chisels and gouges; and axes, adzes, and hatchets)
- hand saws
- other hand tools such as augers, files, levels, measuring tapes, multitools, planers, professional staplers, rasps, and tampers
- parts and attachments such as replacement handles for hand tools, repair pieces for hand tools, replacement nosepieces and jaws for hand tools, saw blades, and screwdriver bit sets
The markets for hand tools are:
- Professional (construction, automotive aftermarket, and industrial and other professional)
- Consumer
The distribution channels covered in the study are:
- Home centers
- Direct sales and distributors
- Hardware stores
- E-commerce
- Mass marketers
The study also evaluates company market share and competitive analysis on industry competitors including Apex Tool, Channellock, Enerpac, Estwing, Emerson, Great Neck, Great Star, Klein Tools, Leatherman, Snap-On, Stanley Black & Decker, Techtronic Industries, and Vontier.
Featuring 102 tables and 32 figures – available in Excel and Powerpoint! Learn More
This report includes data from 2011-2031 in 5 year intervals and tables featuring year-by-year data for 2018-2025.
See our discussion regarding the mature Hand Tools market
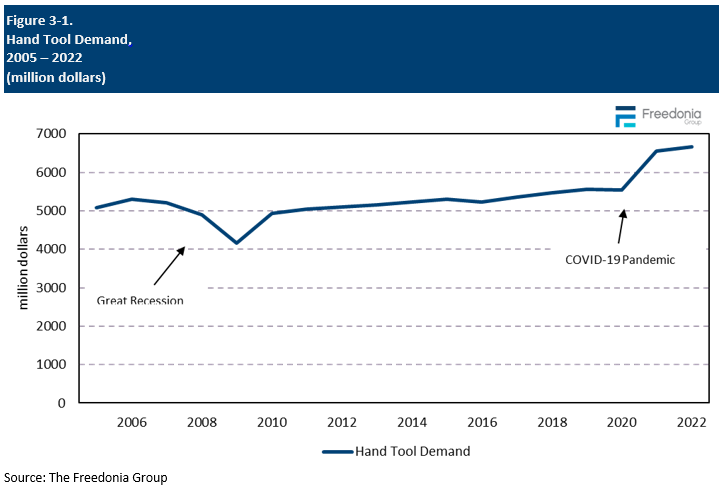
Demand for hand tools is expected to grow less than 1.0% per year to $6.8 billion in 2027, as unit sales decline and price growth moderates. The market for these products grew substantially in 2021 as pandemic-related trends supported strong gains in both the consumer and professional markets. Furthermore, price inflation as a result of ongoing supply chain issues and higher raw material prices offset declines in real terms in 2022, creating a high base and limiting growth prospects through the forecast.
Going forward, the hand tool industry is expected to face similar pre-pandemic restraints, including market maturity, long product lifecycles, and limited innovation. However, growth in key indicators will allow suppliers to maintain elevated levels of demand.
Professional Market Boosted by Macroeconomic Trends, but Labor Issues Remain a Concern
Demand for hand tools in the professional market will see some growth through 2027, supported by rising levels of construction and manufacturing activity, and an increase in the number of motor vehicles in use. However, hand tool sales continue to be negatively impacted by a shortage of skilled labor in a wide range of professions, which restricts the ability of entities to complete projects or increase output. In some industries, such as construction, it is common for professionals to own their own tool set, so any labor shortage limits the base of potential hand tool customers.
Imports Continue to Account for a Larger Share of Demand
In 2022, the share of demand met by imports reached 60%, a high for the industry and representing a decades-long trend toward hand tools being produced overseas. Despite efforts to put the US on more level footing with foreign producers in recent years, imports have continued to grow. Following tariffs levied on an array of hand tools from China, companies have looked to other foreign sources to produce and import hand tools rather than onshoring that production to the US. This trend is expected to continue, albeit at a slower rate as the supply chain issues that occurred during the pandemic illuminated the potential problems that can arise from not sourcing products domestically. However, US-made hand tools are expected to continue to maintain a significant position in the global market, supporting demand from both domestic and foreign end users.
Historical Trends
Hand tools are used in construction, industrial, and manufacturing settings to:
- build and repair structures and infrastructure
- produce and maintain automobiles and other vehicles
- manufacture durable goods such as cabinets, furniture, and machinery
Tools are also used for simple household, hobby, and do-it-yourself (DIY) tasks. The outlook in professional key end use sectors contributes directly to the health of the hand tools market on a year to year basis. However, their use in repair applications and general tasks insulates the market somewhat from more significant volatility.
At the broadest level, demand for hand tools is a reflection of growth in the overall economy. A combination of both consumer and industrial factors supports gains in the power tool industry:
- consumer: spending and trends in consumer behavior toward household projects and hobbies
- construction: new building construction activity and improvement and renovation activity
- automobile: fluctuations in automobile replacement and repair rates and expansion of the motor vehicle base
- industrial: manufacturing shipments and trends in professional tools
However, these trends are not mutually exclusive to these segments of the hand tool industry, as home renovation projects can be done by both consumers (DIY) and professionals (DIFM). Another factor is sales of existing homes, which are often dependent on current mortgage rates; such sales can spur consumers to purchase new tools, particularly if they are first time homebuyers. It can also lead to significant investment in the home via professional construction for renovations.
Historically, market gains have been somewhat limited by competition from sales or inheritance of used tools and power tools. In addition, most consumers do not use hand tools on a regular basis, limiting replacement demand for these products.
Supply & Demand
Trade Balance
Demand for hand tools in the US is forecast to rise less than 1.0% annually to $6.8 billion in 2027. Gains will be limited following the strong growth seen in 2021 during the COVID-19 pandemic and strong price gains in 2022. Looking forward, the market will be supported by a positive outlook for construction and manufacturing shipments.
However, the market for hand tools is relatively mature. Further growth in the in forecast will be limited by:
- a slowdown in price growth and limited opportunities for product innovation
- competition from power tools, which are becoming less expensive
- competition from used and rental tools (which are excluded from the scope of this study)
- the durability of most hand tools, which limits replacement sales
- a growing reliance on low-cost imports in virtually all product segments, which reduces average price growth and limits market value gains
The US is a significant net importer of hand tools, with a growing trade deficit in these products. The majority of hand tool demand in the US is met by imports, which can be produced at lower costs than domestically produced tools.
However, the US is also a significant exporter of hand tools, with strength in product areas such as specialized automotive tools, wrenches, and paint and masonry tools. Exports of hand tools are also significant because US manufacturing has a reputation for high quality, making higher end tools sourced from the US attractive in foreign markets.
Exports
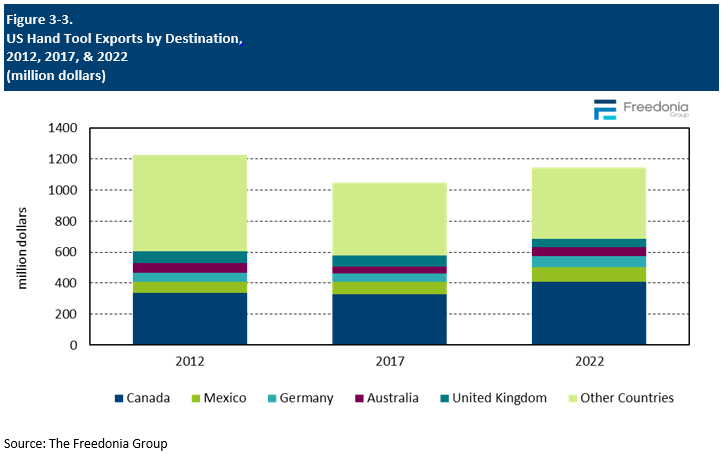
US exports of hand tools are expected to grow nearly 1.0% per year through 2027, matching gains in imports as US manufacturers continue to leverage their reputation for quality products to buyers in foreign countries.
- Because of the maturity of the US hand tool market, many US-based producers have turned to foreign markets to increase their sales, especially in key US export markets, such as Canada, Germany, and United Kingdom.
- The Asia/Pacific region remains an important export market for US hand tools based on their reputation for quality, with Australia, China, and Japan the top destinations.
- Mexico is another top destination for hand tools, receiving 8% of exports in 2022.
However, US producers compete with suppliers based in Europe (on quality) and in the Asia/Pacific region (on price), which continues to restrain advances in US exports.
Products Overview
Demand for hand tools in the US is forecast to rise nearly 1.0% annually to $6.8 billion in 2027, with demand in real terms declining in the short term before returning to growth in the latter part of the forecast period. Demand is expected to normalize following the strong gains seen in 2021 and robust price growth in 2022 – hand tools are historically a mature market with low replacement rates.
Above average growth is expected for multitools, which are popular with younger generations – many of whom are buying toolsets as they move into their first homes.
Pricing Patterns
Hand tool prices fluctuate across product categories, ranging from a few dollars for replacement parts and attachments or commodity-type products to hundreds of dollars for specialty and heavy-duty tools as well as tool sets used by professionals.
As hand tool designs are relatively well established, prices primarily differ based on raw material costs and the presence of value-added features, such as:
- improved ergonomics
- increased durability or strength
- multifunctional capabilities
- reduced vibration
For example, low-end steel claw hammers can cost a few dollars. However, higher-end all titanium varieties with shock-absorbing designs and ergonomically curved grips can sell for as much as $300 at retail.
Virtually every segment of the hand tool industry is subject to pricing pressures. The vast amount of imports of basic tools from countries with low labor costs has affected nearly all hand tool product segments, prohibiting domestic manufacturers of comparable products from significantly increasing prices for fear of losing business. Imports hold a particularly large share of demand for less specialized, commodity-type products, many of which are preferred by consumers or other users who do not require a highly durable tool.
The higher prices of domestically produced/higher value products can be justified by educating consumers about their quality, durability, or special features that may make some buyers more willing to pay a premium. Pricing pressure still affects suppliers of such items, but to a lesser extent since many people deliberately buy US-made hand tools due to their reputation for performance and quality.