Report Overview
 Minimalism or Maximalism…Consumers Still Want Organized Homes
This Freedonia industry study analyzes the $14.2 billion US home organization product industry. It presents historical demand data (2013, 2018, and 2023), forecasts (2028 and 2033), and annual historical and forecast data from 2020 to 2027 by material (metal and wire; plastic; wood; wicker and rattan; and textiles and other) product (bins, baskets, and totes; shelving; modular units; hanging storage; and accessories and hardware), room (closets; garages; family rooms; kitchens and pantries; bedrooms; utility rooms, basements, attics, and entryways; home offices; outdoor areas; bathrooms), and market (do-it-yourself and professional installation). The study includes consumer insights data and analysis. This study also analyzes consumer trends and growth opportunities, discusses the retail market, and evaluates company market share and competitive analysis on industry competitors including Closet Factory, Closets By Design, The Container Store, Dorel Industries, FirstService (California Closets), Griffon (ClosetMaid), Newell Brands, Organized Living, Sauder Woodworking, Sterilite, Stow, United Solutions, and Whirlpool (Gladiator).
Featuring 173 tables and 57 figures – available in Excel and Powerpoint! Learn More
Check out the Home Organization blog!
Demand for home organization products is forecast to increase 1.5% per year to $15.3 billion in 2028. Market value will be impacted by a significant moderation in prices following spikes in 2021 and 2022. In unit terms, sales will grow throughout the forecast period, but will remain below the levels reached during the pandemic-driven demand surge in 2020 and 2021, which was unprecedented and unsustainable. Consumers bought more than ever before, and given that most home organization products are durable and need infrequent replacement, future demand will be somewhat inhibited.
Opportunities exist in products that address consumer interest in:
-
Specialized or custom solutions: Consumers are increasingly looking to address specific storage needs, from high-value, professionally designed and installed closet system to lower value products such as accessories that help more efficiently organize kitchen items.
-
Products that are designed for more areas of the home: Consumers increasingly seek storage or organization solutions in more rooms in their home, from the garage to their outdoor space, entryways, home office, and flex spaces.
As Prices Moderate, Opportunities for Consumers Arise
Supply chain issues, high raw material costs, and an inflationary environment caused prices for home organization products to spike in 2021 and 2022. Prices remained high in 2023, having a negative impact on unit sales. However, prices are expected to moderate significantly in 2024, which will make these items more affordable to consumers. Products for closets and garages (especially modular units and shelving) will benefit the most in this environment since consumers place these high on their organizational priority lists. Consumers are also likely to refocus on popular areas such as pantries, home offices, and outdoor areas, and shift to higher-end materials like wood and textiles over plastic.
Modular Units to Drive Growth
Modular units are expected to account for the largest share of absolute gains of any product type due to their increasing use in closets, garages, and other rooms. Growth will be supported by the products’ easy customization and the ability to meet personal space needs, particularly important with the rise of “flex” spaces. Higher value and more complex modular units often require professional installation; however, DIY versions of units are increasingly available to consumers. Lower-end more basic products are typically installed professionally in multifamily housing complexes or a by stock homebuilder as part of the initial construction.
Historical Market Trends
Sales of home organization products are dependent on a number of macroeconomic factors, including:
Consumer trends have a large influence on sales of home organization products. Consumer preferences for home type and design can support product purchases:
-
Homes with larger closets aid sales of modular closet systems, while an open floor plan can lend itself to more shelving or storage in areas like basements or hall closets and pantries.
-
Additionally, internet and television can influence consumer behaviors and purchasing decisions. For example, organizing movements like Marie Kondo or The Home Edit can spur consumers to buy bins, baskets, shelving, and other home organization products.
In recent years, the market has experienced greater volatility due to the effect of the COVID-19 pandemic on behavioral trends and the supply of home organization products. In 2020 and 2021, sales rose due to greater improvement and repair activity as homeowners spent more time at home, causing them to renovate their spaces. In 2021 and 2022, supply chain issues and high raw material costs led prices to spike, causing market value to rise and in 2022, decouple from unit sales performance.
Product Types
Sales of home organization products are expected to advance 1.5% annually to $15.3 billion in 2028. Growth will be much slower than the 2018-2023 period since the COVID-driven demand surge in 2020 and 2021 was unprecedented and unsustainable. Consumers bought more than ever before and given that most home organization products are durable and need infrequent replacement, future demand will be somewhat inhibited.
While all products are expected to continue to grow through the forecast period, modular systems will see the largest absolute gains. Modular units will find additional opportunities for growth as they are used in increasingly diverse applications. Accessories and hardware sales will also benefit from their use in a growing number of modular systems, as well as to improve the functionality of current consumer spaces like kitchens and pantries.
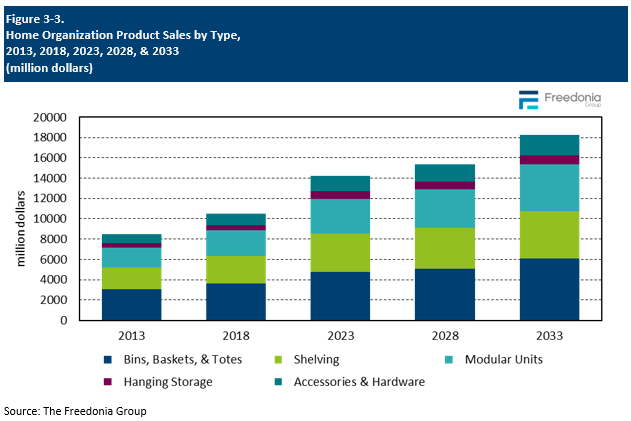
Bins, baskets, and totes account for the largest share of sales, representing 34% of sales in 2023. Gains will result partly from sales of textile baskets, which are higher value elements that are increasingly popular as attractive organization additions to shelving or modular systems.
Modular units are expected to account for the largest share of absolute gains of any product type as they remain popular for closets and see increasing use in garages and family rooms:
-
Modular units are desired for their customization and ability to meet the unique needs of consumers.
-
Growing sales of modular units that can be added on to or adjusted will offer further opportunities as consumers can be persuaded to make secondary purchases and upgrade in the future.
DIY (Do-It-Yourself) Trends
Sales of home organization products to DIY customers are projected to advance 1.4% per year through 2028 to $12.5 billion. Gains will be supported by:
-
the introduction of new products that are easy to install or do not require installation
-
viral movements like the Home Edit and Marie Kondo’s organization methods
-
websites like Pinterest, Instagram, and Houzz, which promote DIY home projects
-
TV programming, like that on HGTV, which inspire consumers to remodel and organize
This segment accounts for a much larger share of sales than products that are professionally installed due to the:
-
majority of home organization products not requiring any installation
-
widespread availability of RTA (ready to assemble) and other DIY products, which are increasingly accompanied by tutorial videos that teach consumers to install products on their own
-
affordability of DIY products compared to those that require professional installation, since the consumer avoids for paying for the associated labor
Going forward, sales of DIY products are expected to increase at a slower pace than professionally installed types due to the
-
popularity of the do-it-for-me (DIFM) movement, which supports consumers choosing to save time over money
-
increasing installation of modular units – which often require professional expertise during installation
Foreign Trade & the Importance of Imports
Imports account for a substantial share of sales, particularly in segments where sales are largely driven by price, and in those where products are relatively basic and production processes are standard.
-
US manufacturers experience a high degree of competition in plastic bins and totes, especially from producers in China and other Asian nations with low production costs.
-
Ready-to-assemble modular systems are also subject to growing competition from countries with low production costs, since these products can be packaged in boxes for easy transport.
A large portion of wicker and rattan home organization products sold in the US is produced in China, the Philippines, and other parts of Asia, where the raw materials for these goods are grown. This longstanding trend also holds for products made from bamboo, seagrass, banana leaves, and other tropical reed or plant materials. In addition, many private label manufacturers of baskets are located in countries with low production costs.