US Household Pesticides
This Freedonia industry study analyzes the $1.5 billion US household pesticide industry. It presents historical demand data (2011, 2016, and 2021) and forecasts (2026 and 2031) by product (insecticides, fungicides, and other pesticides), application, and formulation.
Free Sample Report
Request a free sample of this report and our team will email it to you.
Report Overview
Get household pesticide historical and forecast trends.
-
Product development continues to focus on creating safer alternatives for consumers
This Freedonia industry study analyzes the $1.5 billion US household pesticide industry.  It presents historical demand data (2011, 2016, and 2021) and forecasts (2026 and 2031) by product (insecticides, fungicides, and other pesticides), application (insect control, insect repellents, animal repellents, rodent control, and other applications), and formulation (liquids, aerosols, granules, powders and dusts, and other formulations). Annual data from 2018 to 2025 and historical demand is also presented. Demand is provided in US dollar terms. Also provided is real growth and pricing trend analysis as well as sales by retail distribution channel. The study also evaluates company market share of key industry players. Additionally, the study presents consumer survey data and analysis.
Featuring 31 tables and 10 figures – available in Excel and Powerpoint! Learn More
Demand for household pesticides is expected to grow less than 1.0% per year through 2026, reaching $1.5 billion. Gains will be limited following strong growth in 2020 and 2021, when the pandemic caused consumers to spend more time at home indoors or using outdoor living areas, as well as pursuing physical activities outside. Looking forward, the market will be maintained by:
-
product development that creates safer, higher value alternatives for consumers
-
the continued need for these products to prevent exposure to pests
Product Development Focusing on Safer Alternatives for Consumers
Suppliers of household pesticides are continually updating their products with new formulations of active and inert ingredients, which helps to support market growth in value terms. Much of this development is focused on finding safer alternatives to both real and perceived risks from these products. Products increasingly feature biopesticides or use formulations that offer a better safety profile. Additionally, products that offer safer ingredients will help drive adoption among holdouts going forward, particularly discerning consumers.
Necessity of Household Pesticides Will Maintain Market through the Forecast Period
The size of the household pesticides market will continue to be maintained by consumer concerns over insects’ ability to transmit diseases in both indoor and outdoor settings. This remains a primary concern even as consumers become more aware of the potential harm to end users and the environment that can arise from pesticide ingredients. Consumers will also not be deterred by rising prices for these products, as removing pests is deemed necessary in many situations.
Historical Market Trends
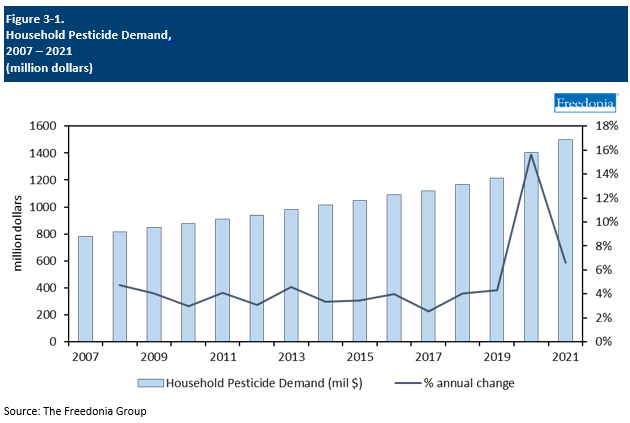
The US pesticide market overall can be volatile, although much of that volatility is attributable to the large agricultural sector. In the household segment, pesticide demand tends to be more stable, although it is still subject to fluctuations in weather, demographics, consumer spending, and residential building activity.
-
The overall market is mature and relatively slow growing in volume terms, with price changes due to product mix creating much of the longer term market trends.
-
Greater awareness of environmental and health hazards has historically been one of the strongest drivers of demand for safer products, leading to a shift in product mix.
Specific factors causing year-to-year changes in home and garden pesticide demand include:
-
the health of the US economy and levels of disposable income
-
levels of new residential building construction
-
consumer preferences regarding DIY versus professional pest care services
-
concerns about disease transmission via insects such as mosquitoes or ticks
-
weather patterns
-
the popularity of nonchemical pesticide alternatives
In addition, product mix and product pricing can have a significant impact on growth in market value, especially when products come off patent. Furthermore, inflationary pressures brought on by the large economy caused value gains in 2021.
Demand by Product
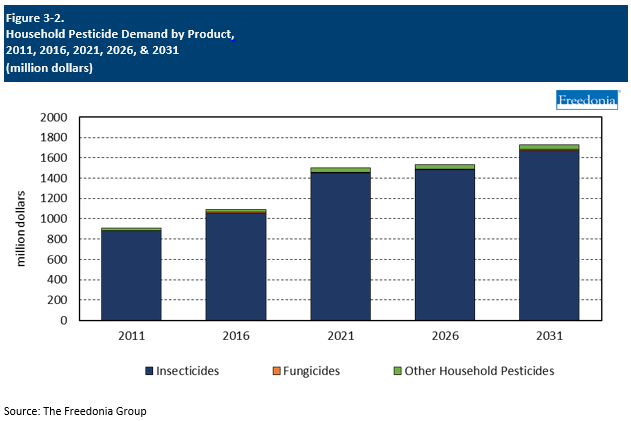
Household pesticide demand is forecast to grow less than 1.0% per year to $1.5 billion in 2026. Demand will moderate significantly following elevated sales in 2020 and 2021 that resulted from pandemic-related shifts in activity, including more time eating and cooking at home, which brought about greater potential for pest infestations. Additionally, competition from professional services will limit gains for the market.
Market value growth will be supported by the rising popularity of higher value formulations, such as biopesticides, which reflects ongoing health concerns about pesticide use and greater concern about environmental issues among consumers. However, products based on commodity active ingredients will maintain the bulk of demand, restraining value growth to a certain degree.
Going forward, insecticides will continue to represent the majority of demand, accounting for 97% of sales in 2026. Insecticides, whether controls or repellents, are not often viewed as an elective. Homeowners typically will not tolerate household insect infestations or put themselves at risk contracting an insect-borne disease.
Demand by Formulation
Household pesticides are available in a wide variety of formulations:
-
Aerosols account for the largest share of demand, reflecting the dominance of spray cans as a delivery method for insect repellents.
-
Liquid products also are the most common type of formulation for household insecticides.
-
Granular, powder and dust, and gel formulations are all common in insect control applications.
-
Rodenticides are mainly formulated as solid blocks or as pastes.
Demand for household pesticides is projected to grow less than 1.0% per year from a high 2021 base to just over $1.5 billion in 2026:
-
Aerosols are expected to maintain the largest share of demand and show some slight growth through the forecast period due their use in repellents as well as other products. However, potential concern for inert ingredients may limit this type going forward.
-
Demand for easy-to-use formulations such as liquids is expected to remain relatively flat through 2026.
Other formulations will show healthy outlooks, a continuation of historical trends. Products in this category are favored because they are more targeted and can be concealed in some sort of container like a station or trap.
Household Pesticide Pricing & Real Growth
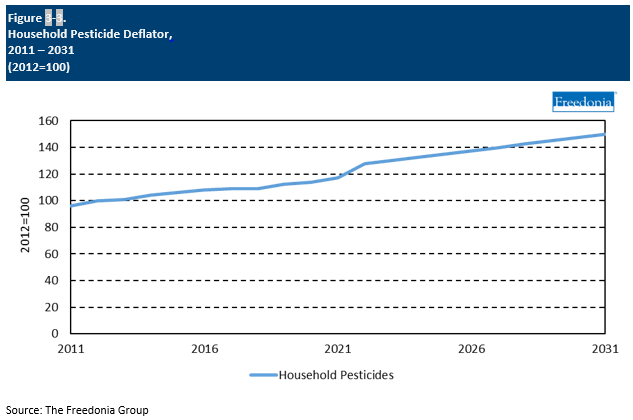
Household pesticide average prices are expected to climb 3.3% per year through 2026, an acceleration from the previous five-year period. Price growth in the near term resulted from inflation- and supply chain-related issues that arose from a strong consumer spending environment. Most notably, prices surged in 2022 as higher transportation and fuel costs passed through the supply chain.
Price growth through the forecast period will also be supported by the use of higher value formulations and packaging. For example, biopesticides, which are preferred due to their more environmentally friendly formulations, will see increasing use.
Despite the healthy growth expected in average prices, market value for household pesticides is expected to rise less than 1.0% per year through 2026. In real terms, demand will decline as consumer usage of these products normalizes from the high levels of demand in 2020 and 2021.
While active ingredients typically constitute a small percentage of a consumer pesticide formulation, which limits the impact of material price fluctuations on consumer products, pricing for materials and the costs associated with acquiring them can affect product pricing.
Demand for household pesticides is expected to grow less than 1.0% per year through 2026, reaching $1.5 billion. Gains will be limited following strong growth in 2020 and 2021, when the pandemic caused consumers to spend more time at home indoors or using outdoor living areas, as well as pursuing physical activities outside. Looking forward, the market will be maintained by:
-
product development that creates safer, higher value alternatives for consumers
-
the continued need for these products to prevent exposure to pests
Product Development Focusing on Safer Alternatives for Consumers
Suppliers of household pesticides are continually updating their products with new formulations of active and inert ingredients, which helps to support market growth in value terms. Much of this development is focused on finding safer alternatives to both real and perceived risks from these products. Products increasingly feature biopesticides or use formulations that offer a better safety profile. Additionally, products that offer safer ingredients will help drive adoption among holdouts going forward, particularly discerning consumers.
Necessity of Household Pesticides Will Maintain Market through the Forecast Period
The size of the household pesticides market will continue to be maintained by consumer concerns over insects’ ability to transmit diseases in both indoor and outdoor settings. This remains a primary concern even as consumers become more aware of the potential harm to end users and the environment that can arise from pesticide ingredients. Consumers will also not be deterred by rising prices for these products, as removing pests is deemed necessary in many situations.
Historical Market Trends
The US pesticide market overall can be volatile, although much of that volatility is attributable to the large agricultural sector. In the household segment, pesticide demand tends to be more stable, although it is still subject to fluctuations in weather, demographics, consumer spending, and residential building activity.
-
The overall market is mature and relatively slow growing in volume terms, with price changes due to product mix creating much of the longer term market trends.
-
Greater awareness of environmental and health hazards has historically been one of the strongest drivers of demand for safer products, leading to a shift in product mix.
Specific factors causing year-to-year changes in home and garden pesticide demand include:
-
the health of the US economy and levels of disposable income
-
levels of new residential building construction
-
consumer preferences regarding DIY versus professional pest care services
-
concerns about disease transmission via insects such as mosquitoes or ticks
-
weather patterns
-
the popularity of nonchemical pesticide alternatives
In addition, product mix and product pricing can have a significant impact on growth in market value, especially when products come off patent. Furthermore, inflationary pressures brought on by the large economy caused value gains in 2021.

Demand by Product
Household pesticide demand is forecast to grow less than 1.0% per year to $1.5 billion in 2026. Demand will moderate significantly following elevated sales in 2020 and 2021 that resulted from pandemic-related shifts in activity, including more time eating and cooking at home, which brought about greater potential for pest infestations. Additionally, competition from professional services will limit gains for the market.
Market value growth will be supported by the rising popularity of higher value formulations, such as biopesticides, which reflects ongoing health concerns about pesticide use and greater concern about environmental issues among consumers. However, products based on commodity active ingredients will maintain the bulk of demand, restraining value growth to a certain degree.
Going forward, insecticides will continue to represent the majority of demand, accounting for 97% of sales in 2026. Insecticides, whether controls or repellents, are not often viewed as an elective. Homeowners typically will not tolerate household insect infestations or put themselves at risk contracting an insect-borne disease.

Demand by Formulation
Household pesticides are available in a wide variety of formulations:
-
Aerosols account for the largest share of demand, reflecting the dominance of spray cans as a delivery method for insect repellents.
-
Liquid products also are the most common type of formulation for household insecticides.
-
Granular, powder and dust, and gel formulations are all common in insect control applications.
-
Rodenticides are mainly formulated as solid blocks or as pastes.
Demand for household pesticides is projected to grow less than 1.0% per year from a high 2021 base to just over $1.5 billion in 2026:
-
Aerosols are expected to maintain the largest share of demand and show some slight growth through the forecast period due their use in repellents as well as other products. However, potential concern for inert ingredients may limit this type going forward.
-
Demand for easy-to-use formulations such as liquids is expected to remain relatively flat through 2026.
Other formulations will show healthy outlooks, a continuation of historical trends. Products in this category are favored because they are more targeted and can be concealed in some sort of container like a station or trap.
Household Pesticide Pricing & Real Growth
Household pesticide average prices are expected to climb 3.3% per year through 2026, an acceleration from the previous five-year period. Price growth in the near term resulted from inflation- and supply chain-related issues that arose from a strong consumer spending environment. Most notably, prices surged in 2022 as higher transportation and fuel costs passed through the supply chain.
Price growth through the forecast period will also be supported by the use of higher value formulations and packaging. For example, biopesticides, which are preferred due to their more environmentally friendly formulations, will see increasing use.
Despite the healthy growth expected in average prices, market value for household pesticides is expected to rise less than 1.0% per year through 2026. In real terms, demand will decline as consumer usage of these products normalizes from the high levels of demand in 2020 and 2021.
While active ingredients typically constitute a small percentage of a consumer pesticide formulation, which limits the impact of material price fluctuations on consumer products, pricing for materials and the costs associated with acquiring them can affect product pricing.

- Executive Summary
- Figure 1-1. Household Pesticides Market
- About This Report
- Report Details
- Market Scope & Product Description
- Impact of the COVID-19 Pandemic
- Table | Annual Household Pesticide Demand by Product, 2020 – 2023
- Table | Annual Household Pesticide Demand by Application, 2020 – 2023
- Figure 2-1. Annual Household Pesticide Demand, 2019 – 2024
- Overview
- Historical Market Trends
- Table | Household Pesticide Demand, 2011 – 2021
- Figure 3-1. Household Pesticide Demand, 2007 – 2021
- Demand by Product
- Table | Household Pesticide Demand by Product, 2011, 2016, 2021, 2026, &2031
- Table | Annual Household Pesticide Demand by Product, 2018 – 2025
- Figure 3-2. Household Pesticide Demand by Product, 2011, 2016, 2021, 2026, &2031
- Demand by Formulation
- Table | Household Pesticide Demand by Formulation, 2011, 2016, 2021, 2026, &2031
- Table | Annual Household Pesticide Demand by Formulation, 2018 – 2025
- Household Pesticide Pricing & Real Growth
- Figure 3-3. Household Pesticide Deflator, 2011 – 2031
- Market Share
- Figure 3-4. Household Pesticide Market Share by Company, 2021
- Historical Market Trends
- Factors Impacting Household Pesticides Demand
- Demographic Trends
- Table | “Did You Use Insecticides, Insect Repellants, Rodenticides, or Animal Repellants in the Last 12 Mont
- Table | “Did You Use Fungicides & Herbicides in the Last 12 Months?” by Age, Presence of Children in Househo
- Homeownership
- Ownership vs. Rentals
- Table | US Homeownership & Rental Rates, 2011 – 2021
- Annual Household Income
- Table | US Homeownership & Rental Rates by Household Income Bracket, 2021
- Age of Head of Household
- Table | US Homeownership & Rental Rates by Age of Head of Household, 2011 – 2021
- Ownership vs. Rentals
- Average Lot Size & Outdoor Space Trends
- Table | Lot Size Owned: Urban vs. Rural Setting & Geographic Region, 2022
- Table | US Homeownership Rates by Property Size, 2011 – 2021
- Climate, Seasonality, &Weather
- Health Concerns & Disease Transmission
- Sustainability Initiatives
- Regulatory Trends
- Legislation
- Product Registration Requirements
- Conventional Pesticides
- Biopesticides
- Demographic Trends
- Household Pest Control Outlook
- Pest Control Products & Services
- Table | Household Pest Control Products & Services Expenditures by Type, 2011, 2016, 2021, 2026, &2031
- Nonchemical Alternatives (Traps, Repellents, Predator Insects)
- Pest Control Services
- Leading Household Pest Control Brands
- Pest Control Products & Services
- Retail Channels
- Retail Household Pesticide Sales by Channel
- Table | Household Pesticide Retail Sales by Channel, 2011, 2016, 2021, 2026, &2031
- Table | Annual Household Pesticide Retail Sales by Channel, 2018 – 2025
- Figure 6-1. Household Pesticide Retail Sales by Channel, 2011, 2016, 2021, 2026, &2031
- Mass Merchandisers
- Home Centers
- Garden Centers
- Internet & Mail Order
- Other Retailers
- Retail Household Pesticide Sales by Channel
- Applications
- Demand by Application
- Table | Household Pesticide Demand by Application 2011, 2016, 2021, 2026, &2031
- Table | Annual Household Pesticide Demand by Application, 2018 – 2025
- Insect Control
- Demand Outlook
- Table | Household Insect Control Demand by Pest Type, 2011, 2016, 2021, 2026, &2031
- Table | Annual Household Insect Control Demand by Pest Type, 2018 – 2025
- Market Share
- Figure 7-1. Household Insect Control Product Market Share by Company, 2021
- Demand Outlook
- Insect Repellents
- Demand Outlook
- Table | Household Insect Repellent Demand by Product, 2011, 2016, 2021, 2026, &2031
- Table | Annual Household Insect Repellent Demand by Product, 2018 – 2025
- Market Share
- Figure 7-2. Household Insect Repellent Market Share by Company, 2021
- Demand Outlook
- Other Household Pesticides
- Demand Outlook
- Table | Other Household Pesticide Demand by Product, 2011, 2016, 2021, 2026, &2031
- Table | Annual Other Household Pesticide Demand by Product, 2018 – 2025
- Animal Repellents
- Rodenticides
- All Other Household Pesticides
- Demand Outlook
- Demand by Application
- Appendix
- Scope
- Table | Relevant Industry Codes
- Table | Relevant HS Codes
- Definitions
- Freedonia Methodology
- Study-Specific Methodology
- Sources
- Associations & Agencies
- Related Studies & Reports
- Macroeconomic Assumptions
- Economic Environment
- Table | Macroeconomic Indicators, 2011, 2016, 2021, 2026, &2031
- Demographic Trends
- Table | Population & Households, 2011, 2016, 2021, 2026, &2031
- Consumer Spending
- Table | Personal Consumption Expenditures, 2011, 2016, 2021, 2026, &2031
- Housing Stock
- Table | Housing Stock by Type, 2011, 2016, 2021, 2026, &2031
- Figure 8-1. Housing Stock: Share by Year of Construction, 2021
- Economic Environment
- Scope
Household pesticide demand is forecast to grow less than 1.0% per year to $1.5 billion in 2026.
Insecticides will continue to represent the majority of demand, accounting for 97% of sales in 2026.
The total household pest control market was valued at $15 billion in 2021.
The leading suppliers of household pesticides in 2021, were SC Johnson, Scotts Miracle-Gro and Woodstream.