Indoor Air Quality Equipment
Free Sample Report
Request a free sample of this report and our team will email it to you.
Report Overview
Featuring 80 tables and 35 figures – now available in Excel and Powerpoint! Learn More
This study covers the US market for indoor air quality equipment, which includes air treatment systems primarily designed to decrease the amount of airborne contaminants in residential, commercial, and institutional buildings. Historical data for 2010, 2015, and 2020 and forecasts to 2025 and 2030 are provided for indoor air quality equipment demand both in units and in current dollars (which are not adjusted to account for inflation).
Products in the scope of this report include central systems and local units (room-specific or location-specific, including those that are portable):
- Central systems process air as it flows through a forced air heating, ventilating, and air conditioning (HVAC) system, or – as is the case with some mechanical ventilation systems – they operate in a central location in the building to draw air from throughout the home.
- Local systems draw, treat, and circulate air in one room or localized area. Unless these units are installed for mechanical ventilation, they are generally portable and can be moved from place to place.
Also included are:
- mechanical ventilation systems that can be sold separately from an overall heating or cooling system and are mainly intended to improve air circulation in a building by removing indoor air (which may have contaminants), bringing in fresh outdoor air; or a combination of the two
- local units purchased by consumers for personal use outside of the home (e.g., during leisure activities, driving, work, or school)
- replacement filters
Technologies used by indoor air quality equipment include:
- air filtration, such as filtration with filters made from nonwovens (HEPA) or activated carbon
- electrostatic air cleaners, including electrostatic precipitators and filters
- ionic air cleaners
- niche technologies, including ozone, ultraviolet (UV), and other smaller volume products
For systems with multiple technologies, the one under which a particular product is classified is determined by the primary level of treatment of that system. For instance, if a product includes both conventional filtration and UV, it is labeled as conventional filtration because that technology is more comprehensive.
Excluded from the scope of this study are:
- air treatment systems that are classified simply as odor elimination products
- air filters associated with appliances and HVAC systems (e.g., refrigerator air filters, HVAC filters, and automotive cabin air filters)
Demand by Product Type
Central indoor air quality equipment demand is expected to grow at an above average pace through 2025, albeit from a smaller base than local indoor air quality equipment. Central systems will benefit from both residential and nonresidential investment in improving overall indoor air quality. Much of this growth will occur in the short term due to the COVID-19 pandemic and continued wildfires in much of the Western half of the United States. Both issues have brought attention to the products that can improve indoor air quality and potentially reduce contaminants such as viral particles and particulates.
Local units are expected to see minimal gains on average through 2025. Demand will normalize following significant surges in 2020 and 2021, as these frequently entry-level products were easily able to be acquired and installed by users.
Demand for replacement air filters is forecast to rise through 2025. Continued support for conventional air filtration products, such as those with HEPA filters, will expand the base of products that need potential filter replacements. Additionally, electronic indicators that can help consumers or property managers regularly change their filters will help maintain growth through the forecast.

Demand by Market
While the nonresidential market for HVAC equipment is larger in value terms than the residential market, adoption of indoor air quality equipment has not occurred to the same extent. Building owners have typically relied on central HVAC filters to provide clean air to the various parts of a building. That said, the COVID-19 pandemic has made improving indoor air quality paramount in nonresidential spaces like schools. Federal funding from COVID-19 relief bills have allowed schools to invest large amounts in their indoor air quality equipment.
Mechanical ventilation equipment is commonly used in nonresidential segments and will continue to help these markets maintain their size while demand for air treatment equipment normalizes over the next few years.
Mechanical Ventilation Pricing Trends
Pricing for mechanical ventilation systems is based on the units themselves, which often contain a fan or blower. HRV or ERV units include a central core that allows the transfer of heat and/or moisture, respectively. Ductwork is not included in the pricing since it is often part of a pre-installed HVAC system or used for other purposes in the building.
The average price for mechanical ventilation systems is expected to grow 2.4% per year through 2025. Gains in overall average pricing will be supported by shifts in the product mix, which will see above average gains for higher value products such as central units or balanced systems. However, gains will be limited by the large number of local units sold annually, which are often lower cost ventilation systems such as those used in residential bathrooms.
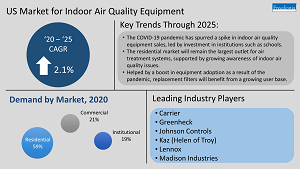
Demand for indoor air quality equipment – including air purifiers/cleaners, mechanical ventilation equipment, and replacement filters – is expected to grow an average of 2.1% per year through 2025 to $5.6 billion. Concerns about airborne viral load that came to light during the COVID-19 pandemic produced a large spike in demand in 2020, and this increased level of awareness about indoor air quality is expected to remain. While growth will continue through 2021, demand for most indoor air quality equipment will normalize during the latter half of the forecast period, with replacement filters providing the only continued gains.
However, demand levels in general will remain well above those of the pre-pandemic period, due in part to ongoing concerns over respiratory ailments related to air quality and an increase in building construction. As demand is expected to remain elevated, many suppliers will continue to expand their businesses by hiring more workers or by increasing manufacturing capacity.
COVID-19 Related Demand Spike in Most Markets for Indoor Air Quality Equipment
As the COVID-19 pandemic spread and more was learned about transmission, businesses and consumers began to take steps to protect their patrons and themselves, respectively. Robust gains were seen in all markets for indoor air quality equipment, with the institutional market seeing the most substantial growth. Schools across the US – aided by federal funding – made significant investments in air cleaners and, to a lesser extent, ventilation products.
Residential Market Remains the Largest Outlet for Air Quality Equipment
The residential market is expected to remain the largest market for indoor air quality equipment and will account for the greatest absolute gains, due to:
- a strong housing market and heavy investment in home improvement
- heightened concerns about indoor air quality, partly as a result of natural disasters (like wildfires) and outdoor pollution issues
- awareness that tightening building envelopes concentrate indoor contaminants, including airborne viruses
Health ailments such as asthma and allergies will spur homeowners to purchase or upgrade indoor air systems. Additionally, the larger number of consumers spending more time at home (including to work) is expected to push investment in wellness and comfort products.
Replacement Filter Demand Supported By Increasing User Base & Higher Value Products
Replacement filters experienced strong gains in 2020 and 2021 due to both existing owners of air cleaners purchasing or stocking up on filters and the large number of new users buying systems and replacement filters together in order to reduce the indoor transmissibility of the cornonavirus. Going forward, suppliers of replacement filters will benefit from this enlarged user base. Sales of higher value products like smart systems will help create recurring revenue, while systems with multiple levels of filters will support volume gains. However, competition from generic replacement filters will continue to limit price growth over the long term.
Demand for indoor air quality equipment – including air purifiers/cleaners, mechanical ventilation equipment, and replacement filters – is expected to grow an average of 2.1% per year through 2025 to $5.6 billion. Concerns about airborne viral load that came to light during the COVID-19 pandemic produced a large spike in demand in 2020, and this increased level of awareness about indoor air quality is expected to remain. While growth will continue through 2021, demand for most indoor air quality equipment will normalize during the latter half of the forecast period, with replacement filters providing the only continued gains.
However, demand levels in general will remain well above those of the pre-pandemic period, due in part to ongoing concerns over respiratory ailments related to air quality and an increase in building construction. As demand is expected to remain elevated, many suppliers will continue to expand their businesses by hiring more workers or by increasing manufacturing capacity.
COVID-19 Related Demand Spike in Most Markets for Indoor Air Quality Equipment
As the COVID-19 pandemic spread and more was learned about transmission, businesses and consumers began to take steps to protect their patrons and themselves, respectively. Robust gains were seen in all markets for indoor air quality equipment, with the institutional market seeing the most substantial growth. Schools across the US – aided by federal funding – made significant investments in air cleaners and, to a lesser extent, ventilation products.
Residential Market Remains the Largest Outlet for Air Quality Equipment
The residential market is expected to remain the largest market for indoor air quality equipment and will account for the greatest absolute gains, due to:
- a strong housing market and heavy investment in home improvement
- heightened concerns about indoor air quality, partly as a result of natural disasters (like wildfires) and outdoor pollution issues
- awareness that tightening building envelopes concentrate indoor contaminants, including airborne viruses
Health ailments such as asthma and allergies will spur homeowners to purchase or upgrade indoor air systems. Additionally, the larger number of consumers spending more time at home (including to work) is expected to push investment in wellness and comfort products.
Replacement Filter Demand Supported By Increasing User Base & Higher Value Products
Replacement filters experienced strong gains in 2020 and 2021 due to both existing owners of air cleaners purchasing or stocking up on filters and the large number of new users buying systems and replacement filters together in order to reduce the indoor transmissibility of the cornonavirus. Going forward, suppliers of replacement filters will benefit from this enlarged user base. Sales of higher value products like smart systems will help create recurring revenue, while systems with multiple levels of filters will support volume gains. However, competition from generic replacement filters will continue to limit price growth over the long term.
- Executive Summary
- Figure 1-1 | US Market for Indoor Air Quality Equipment
- COVID-19 Pandemic
- Overview
- Impact on the Economy
- Table | Macroeconomic Indicators, 2019 - 2022
- Figure 2-1 | Real GDP by Economic Sector, 2019 - 2022
- Impact on the Construction Industry
- Table | Construction Expenditures, 2019 - 2022
- Impact on the Indoor Air Quality Equipment Industry
- Table | Annual Indoor Air Quality Equipment Demand by Product, 2019 - 2021
- Table | Annual Indoor Air Quality Equipment Demand by Market, 2019 - 2021
- Figure 2-2 | Annual Indoor Air Quality Equipment Demand Value Growth by Market, 2019 - 2021
- Overview
- Study Scope
- Figure 3-1 | Indoor Air Quality Equipment: Product Examples
- Historical Trends
- Table | Indoor Air Quality Equipment Demand, 2010 - 2020
- Figure 3-2 | Indoor Air Quality Equipment Demand, 2005 - 2020
- Demand by Product Type
- Table | Indoor Air Quality Equipment Demand by Product, 2010 - 2030
- Figure 3-3 | Indoor Air Quality Equipment Demand by Product, 2010 - 2030
- Demand by Market
- Table | Indoor Air Quality Equipment Demand by Market, 2010 - 2030
- Figure 3-4 | Indoor Air Quality Equipment Demand by Market, 2010 - 2030
- Demand by Technology
- Table | Indoor Air Quality Equipment Demand by Technology, 2010 - 2030
- Figure 3-5 | Indoor Air Quality Equipment Demand by Technology, 2010 - 2030
- Pricing Trends
- General Pricing Factors
- Table | Indoor Air Quality Equipment Pricing, 2010 – 2030
- Figure 3-6 | Indoor Air Quality Equipment Pricing, 2015 - 2030
- Air Treatment System Pricing Trends
- Mechanical Ventilation Pricing Trends
- Replacement Filter Pricing Trends
- General Pricing Factors
- Technology Innovations
- Smart & Connected IAQ Systems
- Filter & Air Quality Indicators
- Programmable Systems
- Independent Air Quality Monitors & Sensors
- Niche/Low-Volume Technologies
- Environmental & Regulatory Considerations
- Air Pollution Levels
- Ozone Regulations
- Quality Control Organizations
- Air Exchange Rates
- Study Scope
- Consumer Trends & Insights
- Urban Population Trends
- Figure 4-1 | Urban Dwellers Share of Total US Population, 2000 – 2025
- Homeownership
- Ownership vs. Rentals
- Table | Homeownership & Rental of Residences in the US, 2010 - 2020
- Household Income & Homeownership
- Table | Homeownership & Rental Trends in the US by Annual Household Income Bracket, 2010 - 2020
- Homeownership by Age Group
- Table | Homeownership & Rentals in the US by Age Group, 2010 - 2020
- Ownership vs. Rentals
- Home Improvement & Remodeling
- Table | Home Remodeling Completed in the Last 12 Months, DIY & By an Outside Contractor, 2011 - 2020
- Recent Purchases of IAQ & Related Equipment
- Table | "Did You Buy Any of the Following For Your Home in 2020?" by Gender, Family Status, Age Group, & Ann
- Table | "Did You Buy Any of the Following For Your Home in 2020?" by Pet Ownership, Urban vs. Rural Setting,
- Ownership of IAQ & Related Equipment
- Table | "Do You Have Any of the Following Installed in Your Home?" by Gender, Family Status, Age Group, & An
- Table | "Do You Have Any of the Following Installed in Your Home?" by Pet Ownership, Urban vs Rural Setting,
- Health Considerations
- Respiratory Ailments
- Table | Presence of Allergies in the Household by Gender, Family Status, Age Group, Annual Household Income
- Figure 4-2 | Allergies in the Household by Pet Ownership, 2021
- Table | Incidence of Allergies/Hay Fever or Asthma, 2010 - 2021
- Wildfire Concerns
- Table | Wildfires in the US, 2010 – 2020
- COVID-19 Concerns
- Table | Coronavirus Health Concerns: "I am concerned about the…", 2020 - 2021
- Respiratory Ailments
- Urban Population Trends
- Conventional Air Filtration
- Scope & Product Description
- Figure 5-1 | Indoor Air Filtration Technologies: Product Examples
- Technologies
- Demand by Technology
- Table | Conventional Indoor Air Filtration Equipment Demand by Technology, 2010 - 2030
- HEPA Filtration
- Table | HEPA Filtration Equipment Demand by Market, 2010 - 2030
- ULPA & Other Conventional Technologies
- Table | ULPA & Other Conventional Air Filtration Equipment Demand by Market, 2010 - 2030
- Demand by Technology
- Product Types (Central or Local Equipment)
- Table | Conventional Indoor Air Filtration Equipment Demand by Product, 2010 - 2030
- Markets
- Table | Conventional Indoor Air Filtration Equipment Demand by Market, 2010 - 2030
- Product Innovation
- Key Suppliers
- Scope & Product Description
- Electrostatic Air Cleaning
- Scope & Product Description
- Figure 6-1 | Electrostatic Air Cleaning Technology: Product Examples
- Product Types (Central or Local Equipment)
- Table | Electrostatic Air Cleaning Equipment Demand by Product, 2010 - 2030
- Markets
- Table | Electrostatic Air Cleaning Equipment Demand by Market, 2010 - 2030
- Product Innovation
- Key Suppliers
- Scope & Product Description
- Ionic Air Cleaning
- Scope & Product Description
- Figure 7-1 | Ionic Air Cleaning Technology: Product Examples
- Product Types (Central or Local Equipment)
- Table | Ionic Air Cleaning Equipment Demand by Product, 2010 - 2030
- Markets
- Table | Ionic Air Cleaning Equipment Demand by Market, 2010 - 2030
- Product Innovation
- Key Suppliers
- Scope & Product Description
- Niche Technologies
- Scope & Product Description
- Figure 8-1 | Niche & Low Volume Indoor Air Quality Technologies: Product Examples
- Technologies
- Demand by Technology
- Table | Niche Indoor Air Quality Equipment Demand by Technology, 2010 - 2030
- Ultraviolet (UV) Treatment
- Table | Ultraviolet Indoor Air Quality Equipment Demand by Market, 2010 - 2030
- Ozone Treatment
- Table | Ozone Indoor Air Quality Equipment Demand by Market, 2010 - 2030
- Other Niche Technologies (DHP, PCO, PECO, TSS)
- Table | Indoor Air Quality Equipment Using Other Niche Technologies: Demand by Market, 2010 - 2030
- Demand by Technology
- Product Types (Central or Local Equipment)
- Table | Niche Indoor Air Quality Equipment Demand by Product, 2010 - 2030
- Markets
- Table | Niche Indoor Air Quality Equipment Demand by Market, 2010 - 2030
- Scope & Product Description
- Mechanical Ventilation Equipment
- Scope & Product Description
- Figure 9-1 | Mechanical Ventilation Equipment: Product Examples
- Equipment Types
- Demand by Type
- Table | Mechanical Ventilation Equipment Demand by Type, 2010 - 2030
- Exhaust
- Table | Exhaust Mechanical Ventilation Equipment Demand by Market, 2010 - 2030
- Supply
- Table | Supply Mechanical Ventilation Equipment Demand by Market, 2010 - 2030
- Balanced & Energy Saving Ventilators
- Table | Balanced & Energy Saving Mechanical Ventilation Equipment Demand by Market, 2010 - 2030
- Demand by Type
- Product Types (Central or Local Equipment)
- Table | Mechanical Ventilation Equipment Demand by Product, 2010 - 2030
- Markets
- Table | Mechanical Ventilation Equipment Demand by Market, 2010 - 2030
- Product Innovation
- Key Suppliers
- Scope & Product Description
- Central Indoor Air Quality Equipment
- Scope & Product Description
- Figure 10-1 | Central Indoor Air Quality Equipment: Product Examples
- Demand by Technology
- Table | Central Indoor Air Quality Equipment Demand by Technology, 2010 - 2030
- Figure 10-2 | Central Indoor Air Quality Equipment Demand by Technology, 2010 - 2030
- Demand by Market
- Table | Central Indoor Air Quality Equipment Demand by Market, 2010 - 2030
- Product Innovation
- Key Suppliers & Market Share
- Figure 10-3 | Central Indoor Air Quality Equipment Market Share by Company, 2020
- Table | Selected Central Indoor Air Quality Equipment Offerings
- Scope & Product Description
- Local/Portable Indoor Air Quality Equipment
- Scope & Product Description
- Figure 11-1 | Local Indoor Air Quality Equipment: Product Examples
- Demand by Technology
- Table | Local Indoor Air Quality Equipment Demand by Technology, 2010 - 2030
- Figure 11-2 | Local Indoor Air Quality Equipment Demand by Technology, 2010 - 2030
- Demand by Market
- Table | Local Indoor Air Quality Equipment Demand by Market, 2010 - 2030
- Product Innovation
- Key Suppliers & Market Share
- Figure 11-3 | Local Indoor Air Quality Equipment Market Share by Company, 2020
- Table | Selected Local Indoor Air Quality Equipment Offerings
- Scope & Product Description
- Replacement Air Filters
- Scope & Product Description
- Figure 12-1 | Replacement Air Filters: Product Examples
- Demand by Type
- Table | Replacement Air Filter Demand by Technology, 2010 - 2030
- Figure 12-2 | Replacement Air Filter Demand by Technology, 2010 - 2030
- Demand by Market
- Table | Replacement Air Filter Demand by Market, 2010 - 2030
- Product Innovation
- Key Suppliers & Market Share
- Figure 12-3 | Replacement Air Filter Market Share by Company, 2020
- Scope & Product Description
- Residential Markets
- Market Scope
- Housing Types
- Demand by Housing Type
- Table | Residential Indoor Air Quality Equipment Demand by Housing Type, 2010 - 2030
- Single-Family Homes
- Table | Single-Family Housing Indoor Air Quality Equipment Demand by Product, 2010 - 2030
- Multifamily Housing
- Table | Multifamily Housing Indoor Air Quality Equipment Demand by Product, 2010 - 2030
- Demand by Housing Type
- Products
- Demand by Product Type
- Table | Residential Indoor Air Quality Equipment Demand by Product, 2010 - 2030
- Central Equipment
- Table | Residential Central Indoor Air Quality Equipment Demand by Technology, 2010 - 2030
- Local Equipment
- Table | Residential Local Air Treatment Equipment Demand by Technology, 2010 - 2030
- Replacement Filters
- Table | Residential Replacement Air Filter Demand by Building Type, 2010 - 2030
- Demand by Product Type
- Technology Trends
- Figure 13-1 | Residential Indoor Air Quality Equipment Value Demand Growth by Technology, 2010 - 203
- Commercial Markets
- Market Scope
- Market Sectors
- Demand by Sector
- Table | Commercial Building Indoor Air Quality Equipment Demand by Market Sector, 2010 - 2030
- Office Buildings
- Table | Office Building Indoor Air Quality Equipment Demand by Product, 2010 - 2030
- Retail
- Table | Retail Building Indoor Air Quality Equipment Demand by Product, 2010 - 2030
- Foodservice
- Table | Foodservice Indoor Air Quality Equipment Demand by Product, 2010 - 2030
- Other Commercial Buildings
- Table | Other Commercial Building Indoor Air Quality Equipment Demand by Product, 2010 - 2030
- Demand by Sector
- Product Types
- Table | Commercial Building Indoor Air Quality Equipment Demand by Product, 2010 - 2030
- Technology Trends
- Figure 14-1 | Commercial Building Indoor Air Quality Equipment Value Demand Growth by Technology, 20
- Institutional Markets
- Market Scope
- Market Sectors
- Demand by Sector
- Table | Institutional Building Indoor Air Quality Equipment Demand by Market Sector, 2010 - 2030
- Healthcare
- Table | Healthcare Building Indoor Air Quality Equipment Demand by Product, 2010 - 2030
- Education
- Table | Education Building Indoor Air Quality Equipment Demand by Product, 2010 - 2030
- Religious
- Table | Religious Building Indoor Air Quality Equipment Demand by Product, 2010 - 2030
- Demand by Sector
- Product Types
- Table | Institutional Building Indoor Air Quality Equipment Demand by Product, 2010 - 2030
- Technology Trends
- Figure 15-1 | Institutional Building Indoor Air Quality Equipment Value Demand Growth by Technology,
- Industry Structure
- Key Findings & Industry Composition
- Table | Indoor Air Quality Equipment Sales by Company, 2020
- Market Share
- Figure 16-1 | US Indoor Air Quality Equipment Market Share, 2020
- Figure 16-2 | US Indoor Air Quality Equipment Market, 2020: Leading Supplier
- Figure 16-3 | US Indoor Air Quality Equipment Market, 2020: Second Leading Supplier
- Figure 16-4 | US Indoor Air Quality Equipment Market, 2020: Third Leading Supplier
- Figure 16-5 | US Indoor Air Quality Equipment Market, 2020: Fourth Leading Supplier
- Figure 16-6 | US Indoor Air Quality Equipment Market, 2020: Fifth Leading Supplier
- Figure 16-7 | US Indoor Air Quality Equipment Market, 2020: Sixth Leading Supplier
- Mergers & Acquisitions
- Table | Selected Mergers & Acquisitions
- Cooperative Agreements
- Table | Selected Cooperative Agreements
- List of Industry Participants
- Table | Selected Industry Participants
- Key Findings & Industry Composition
- Appendix
- Scope
- Table | Relevant Industry Codes
- Table | Relevant HS Codes
- Definitions
- Abbreviations
- Table | Abbreviations & Acronyms Used in Study
- Freedonia Methodology
- Study-Specific Methodology
- Sources
- Associations & Agencies
- Related Studies & Reports
- Macroeconomic Assumptions
- Economic Environment
- Table | Macroeconomic Indicators, 2010 - 2030
- Demographic Trends
- Table | Population & Households, 2010 - 2030
- Consumer Spending
- Table | Personal Consumption Expenditures, 2010 - 2030
- Residential Building Construction
- Table | Residential Building Construction Expenditures, 2010 - 2030
- Commercial Building Construction
- Table | Commercial Building Construction Expenditures, 2010 - 2030
- Economic Environment
- Scope
Demand for indoor air quality equipment – including air purifiers/cleaners, mechanical ventilation equipment, and replacement filters – is expected to grow an average of 2.1% per year through 2025 to $5.6 billion.
Products in the scope of this report include central systems and local units (room-specific or location-specific, including those that are portable).
Industry competitors include Austin Air Systems, Blueair, Carrier, Daikin Industries, Guardian Technologies, Greenheck, Healthway, Helen of Troy (Kaz), Johnson Controls, Lennox International, Madison Industries, Newell Brands, Parker-Hannifin, Research Products, Trane, and 3M Company.