US Labels
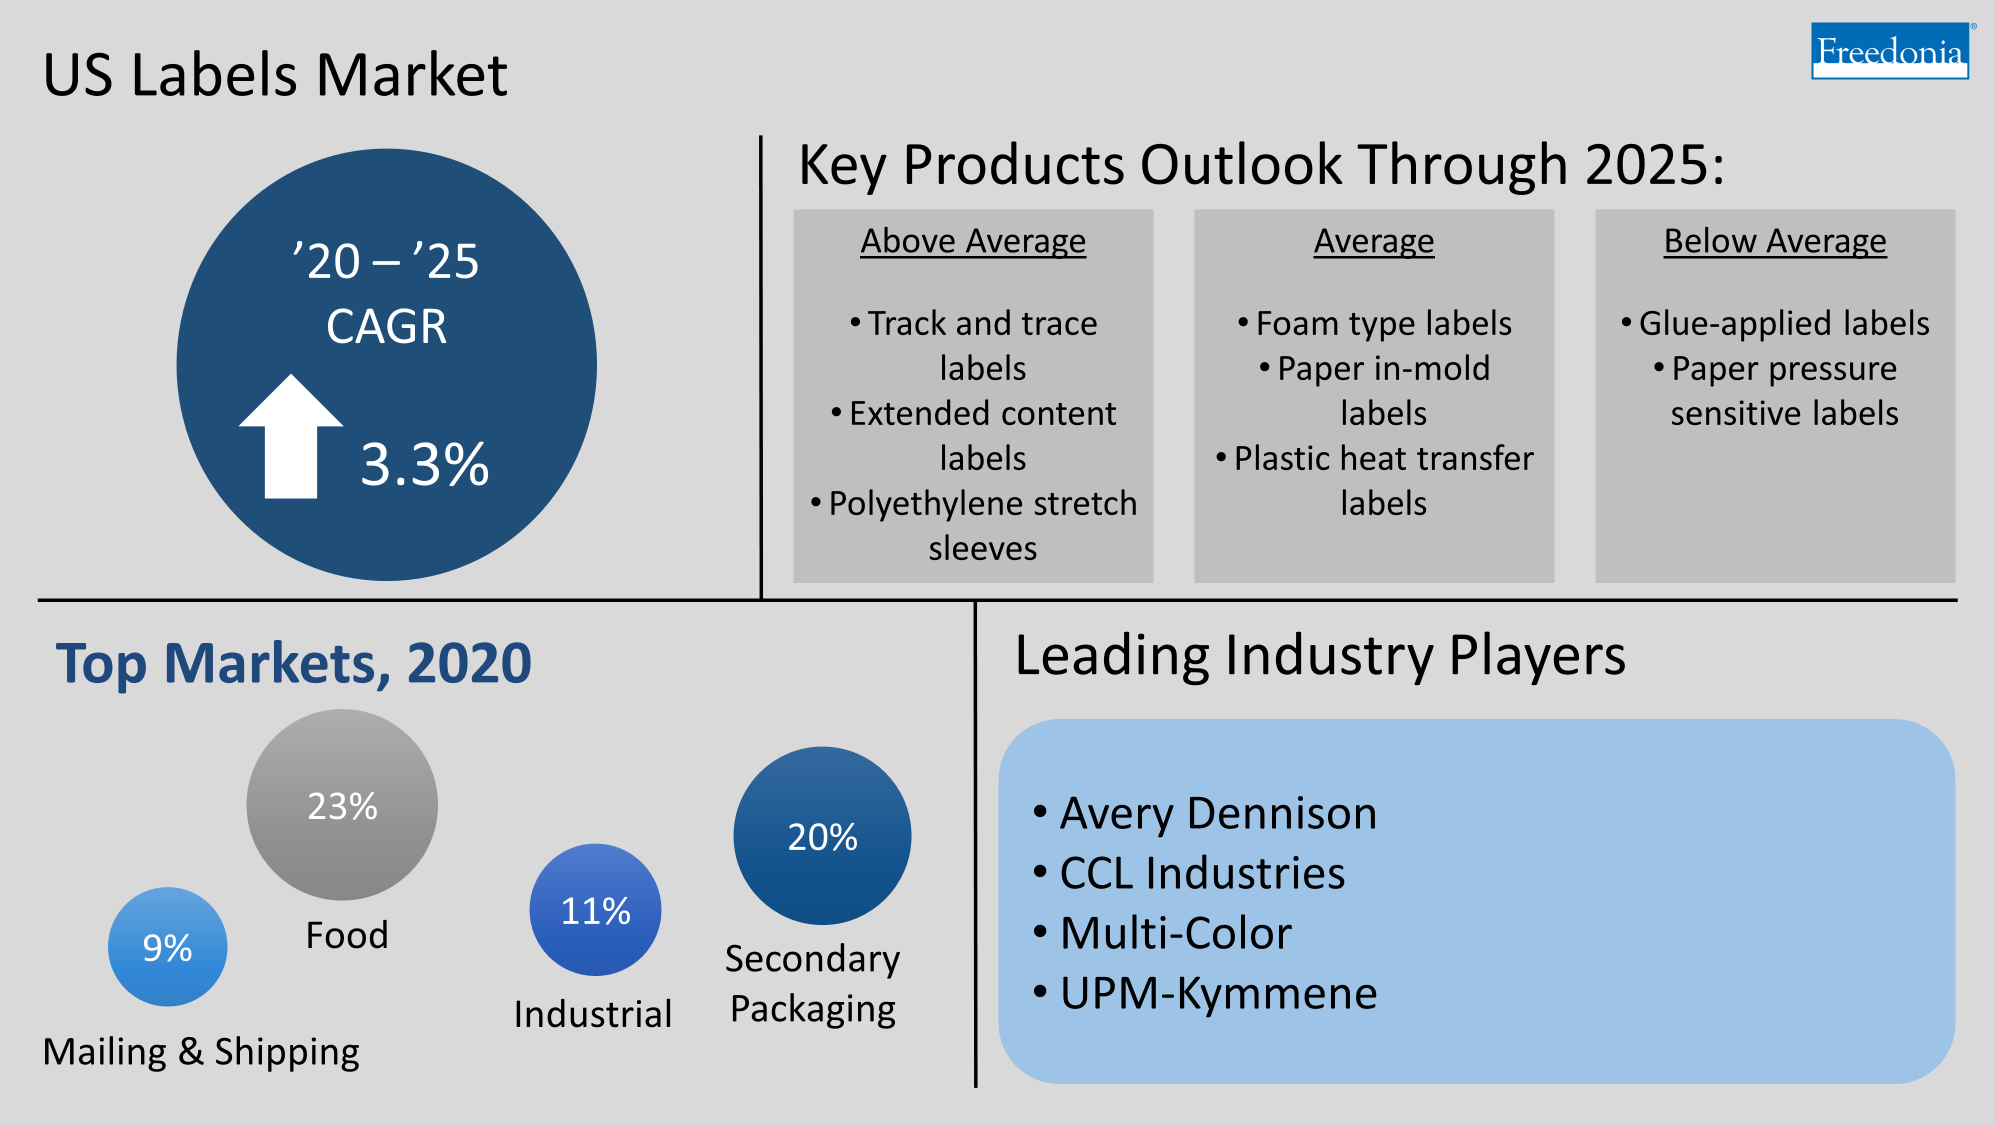
Demand for labels is projected to advance 3.3% per year to $20.6 billion in 2025.
Free Sample Report
Request a free sample of this report and our team will email it to you.
Report Overview
13th Edition
Featuring 70 tables and 55 figures – now available in Excel and Powerpoint! Learn More

This study analyzes the United States market for labels. In the context of this report, a label is defined as any material adhered to an object to indicate contents, pricing, ownership, directions, destinations, ratings, warnings, or other information. Decorative decalcomanias (decals) and stickers are also included.
Demand by Application Method
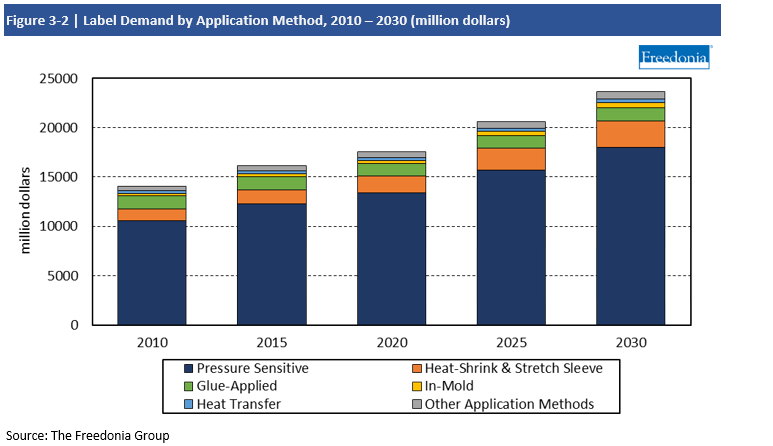
Demand for labels is projected to advance 3.3% per year to $20.6 billion in 2025. Pressure sensitive labels (PSLs or sometimes PSA labels) are by far the leading product type, accounting for 77% of total label value demand in 2020.
PSLs, heat-shrink and stretch sleeve, and non-shrink wraparounds will continue to expand their share of the market at the expense of more traditional label types, even in usual strongholds like wine, spirits, and specialty beverages. Mature application methods that will see below average growth include glue-applied, heat-seal, and gummed labels:
- Pressure sensitive labels are popular due to their versatility of applications, suitability for the popular no-label look, and amenability to specialization such as extended content labels (ECLs) and smart labels. However, gains for PSLs will be restricted to some extent by increasingly intense competition with other label types, especially heat-shrink and in-mold labels, in primary packaging applications.
- Heat-shrink labels will grow at the fastest rate, supported in part by the aesthetic advantages of shrink sleeves in food and beverage applications.
- While in-mold labels comprise a much smaller share of the market, in-mold’s no-label look and amenability to plastic packaging is leading producers like Verstraete to enter the US in-mold market.
Pricing Trends
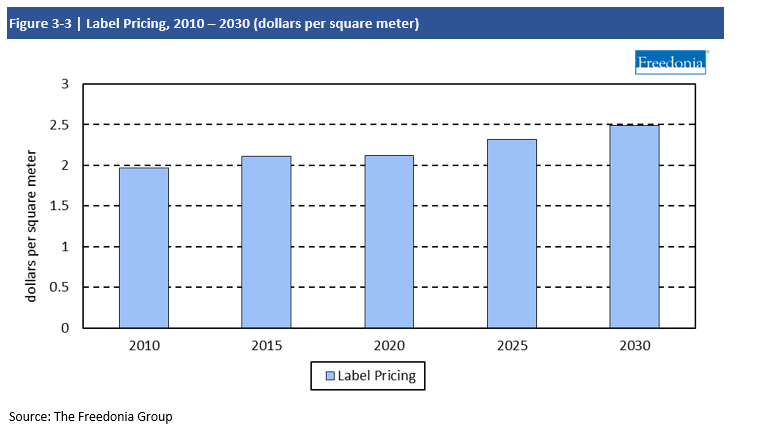
Label pricing is largely determined by trends in raw material costs, which can account for anywhere from 30% to 50% of the value of printed labels. Prices are also influenced by costs associated with printing, labor, energy, transportation, and regulatory and environmental compliance.
Through 2025, average label prices are forecast to rise 1.8% per year to $2.32 per square meter. Price growth will be driven by:
- expected growth in oil and gas prices relative to a low 2020 base, boosting costs for raw materials and energy
- strong paper prices, as increasing demand, boosted in part by a sharp increase in e-commerce, is met by weak paper production and falling capacity
- trends toward higher value label types, including improved graphics and added features such as radio frequency identification (RFID)
Nevertheless, price increases will remain relatively moderate due to other factors, including:
- improving printing technology, which allows finished labels to be produced at lower costs
- lightweighting of label stock, such as thinner plastic film and lighter basis weight papers
Raw Materials
Adhesives
Demand for adhesives in the production of labels is expected to rise less than 1.0% per year to 238 million pounds through 2025. Growth will be limited by the rising popularity of label types that do not use adhesives, such as heat shrink and stretch sleeve and in-mold labels. However, the ongoing dominance of pressure sensitive labels and the continued demand for paper glue-applied labels due to their low cost and nostalgic appeal will prevent losses.
Solvent-borne adhesives will continue to face increasing competition from hot melt, water-based, and radiation-cured varieties. However, continuing use of solvent adhesives will be supported by their suitability for use with plastic substrates, which are growing as a share of label demand.
Labels are evaluated by application method:
- pressure sensitive
- glue-applied
- heat-shrink and stretch sleeve
- in-mold (via blow molding, injection molding, thermoforming)
- heat transfer
- other application methods, including non-shrink wraparound, heat-seal, gummed, and foam
Demand is also segmented by stock material:
- paper (including roll-fed, sheet, and decal forms)
- plastic
- polyethylene (e.g., low density polyethylene, linear low density polyethylene)
- polypropylene (e.g., oriented polypropylene)
- polyvinyl chloride
- other plastics (e.g., acetates, synthetic papers, spunbonded polyolefins, polyimide)
- other label materials, such as foil, ceramic, and stainless steel)
Furthermore, demand is analyzed by market:
- primary packaging
- food
- beverages
- pharmaceuticals
- cosmetics and toiletries
- other primary packaging (e.g., automotive chemicals, household cleaning chemicals, medical devices, apparel and textiles, lawn and garden production, paper and plastic products, sporting goods, tobacco, toys)
- secondary packaging (including retail, institutional, transportation, and distribution sectors)
- industrial
- mailing and shipping
- decorative
- consumer and institutional
Finally, printed label demand is analyzed by printing technology:
- flexographic
- lithographic
- digital
- screen
- gravure
- letterpress
Excluded from the study are:
- adhesive notes (e.g., 3M’s Post-it notes)
- adhesive-backed envelopes
- cloth and woven labels (e.g., garment labels)
- decorative pressure sensitive tapes
- graphic films
- EAS tags (although the labels used in conjunction with EAS tags are covered)
- label/form combinations
- labels printed directly onto containers without the use of an intervening substrate
- postage stamps issued by the US Postal Service (however, blank labels for postage meters and online purchases of postage are included)
- rigid metal labels
- tags
- unprinted shrink neckbands
Historical data for 2010, 2015, and 2020 and forecasts for 2025 and 2030 are presented in current US dollars at the manufacturers’ level (which are not adjusted to account for inflation).
The US labels market is projected to expand 3.3% per year to $20.6 billion in 2025, accelerating from the pace seen during the 2015-2020 period, when average annual growth was affected by a 2020 decline in label demand that resulted from the COVID-19 pandemic. Growth will be boosted by the continued focus on labels as marketing and track-and-trace tools, buoying growth for value-added label types. Though technologically advanced labels will remain pricier than standard types, their sales will also be boosted by improvements in converting and printing technologies that will make them more affordable, helping to increase their penetration in a number of markets as the price gap shrinks.
Pressure Sensitive to Remain Largest Segment; Heat Shrink Labels to Grow at Fast Pace
Pressure sensitive labels accounted for 76% of demand in 2020, and the segment is expected to remain the leader through 2025. Gains will be supported by the:
- growing popularity of specialized labels, including RFID-enabled and extended content types
- the promotion of higher value and higher performance labels such as more durable types for automotive, appliance, and electronics applications
Heat shrink and stretch sleeve labels are expected to expand at an above average pace and will continue to take market share from glue-applied labels. Though comparatively more expensive to produce, heat shrink and stretch sleeve labels have superior aesthetics and are seeing advancements in digital printing, which will boost demand for these labels. As a result, pressure sensitive labels will face competition from heat shrink and stretch sleeve labels, particularly in food applications.
Mailing & Shipping Labels & Secondary Packaging Will Experience Largest Absolute Gains
Ongoing growth in e-commerce – which was boosted to even higher levels during the pandemic in 2020 – as well as the increased need to track and trace inventory in distribution and transportation, will support healthy growth for labels in mailing and shipping labels and secondary packaging. For mailing and shipping labels, demand for labels for individually packaged items instead of bulk shipping – as well as the trend of e-commerce retailers including printed return labels with shipments – will buoy growth. Increases in retail activity will also boost demand for labels used with secondary packaging, most notably track and trace labels.
Digital Printing to Offer New Opportunities for Labels
Digital printing will expand at by far the fastest pace of any label printing technology through 2025, when it is expected to be replace lithography as the second most common printing method. Growth will be boosted by demand for short print runs of customized packaging for promotions and customized marketing, which is more affordable when using digital printing.
Demand for digitally printed labels will also be supported by increased regulatory activity, particularly in the pharmaceutical market, which sometimes requires frequent changes to information presented on labels. Digital printing’s versatility and minimal prepress preparation time allows adjustments to be made cost-effectively.
- Executive Summary
- Figure 1-1 | US Labels Market
- COVID-19 Pandemic
- Overview
- Impact on the Economy
- Table | Macroeconomic Indicators, 2019 - 2022
- Figure 2-1 | Real GDP by Economic Sector, 2019 - 2022
- Impact on the Labels Industry
- Table | Annual Label Demand by Market, 2019 - 2021
- Table | Annual Label Demand by Application Method, 2019 - 2021
- Figure 2-2 | Annual Label Demand, 2019 - 2024
- Overview
- Study Scope
- Historical Trends
- Table | Label Demand, 2010 - 2020
- Figure 3-1 | Label Demand, 2000 - 2020
- Demand by Application Method
- Table | Label Demand by Application Method, 2010 - 2030
- Figure 3-2 | Label Demand by Application Method, 2010 - 2030
- Production & Foreign Trade
- Table | Label Supply & Demand, 2010 - 2030
- Pricing Trends
- Table | Label Pricing, 2010 - 2030
- Figure 3-3 | Label Pricing, 2010 - 2030
- Raw Materials
- Raw Material Requirements
- Table | Raw Material Consumption in Label Production, 2010 - 2030
- Figure 3-4 | Raw Material Use in Labels, 2010 - 2030
- Stock Materials (Substrates)
- Adhesives
- Printing Inks
- Liners, Topcoats, & Other Materials
- Raw Material Requirements
- Factors Impacting Label Demand
- Sustainability Issues
- Recycling & Recycled Content
- Bioplastics & Compostable Plastics
- Low-VOC Materials
- Smart Label Developments
- RFID
- Electronic Article Surveillance (EAS) Labels
- Interactive Labels
- Competitive Technologies (Direct Printing & ESL)
- Regulatory Issues
- Food & Beverage Labels
- Table | Recent Regulations Impacting the Food & Beverage Label Market
- Pharmaceutical & Medical Device Labels
- Table | Recent Regulations Impacting Pharmaceutical & Medical Device Label Market
- Certification Bodies
- Food & Beverage Labels
- Sustainability Issues
- Pressure Sensitive Labels
- Scope & Product Description
- Figure 5-1 | Pressure Sensitive Labels: Product Examples
- Characteristics & Applications
- Table | Pressure Sensitive Labels: Advantages & Disadvantages
- Demand by Material
- Table | Pressure Sensitive Label Demand by Material, 2010 - 2030
- Key Markets
- Trends in Printing Technology
- Suppliers & New Product Development
- Scope & Product Description
- Heat Shrink & Stretch Sleeve Labels
- Scope & Product Description
- Figure 6-1 | Heat Shrink & Stretch Sleeve Labels: Product Examples
- Product Types
- Demand by Type
- Table | Heat Shrink & Stretch Sleeve Label Demand by Type, 2010 - 2030
- Heat Shrink Labels
- Table | Heat Shrink Labels: Advantages & Disadvantages
- Stretch Sleeve Labels
- Table | Stretch Sleeve Labels: Advantages & Disadvantages
- Demand by Type
- Demand by Material
- Table | Heat Shrink & Stretch Sleeve Label Demand by Material, 2010 - 2030
- Key Markets
- Trends in Printing Technology
- Suppliers & New Product Development
- Scope & Product Description
- Glue-Applied Labels
- Scope & Product Description
- Figure 7-1 | Glue-Applied Labels: Product Examples
- Characteristics & Applications
- Table | Glue-Applied Labels: Key Advantages & Disadvantages
- Demand by Material
- Table | Glue-Applied Label Demand by Material, 2010 - 2030
- Key Markets
- Trends in Printing Technology
- Suppliers & New Product Development
- Scope & Product Description
- In-Mold Labels
- Scope & Product Description
- Figure 8-1 | In-Mold Labels: Product Examples
- Characteristics & Applications
- Table | In-Mold Labels: Key Advantages & Disadvantages
- Demand by Material
- Table | In-Mold Label Demand by Material, 2010 - 2030
- Key Markets
- Trends in Printing Technology
- Demand by Molding Process
- Table | In-Mold Label Demand by Molding Process, 2010 - 2030
- Suppliers & New Product Development
- Scope & Product Description
- Heat Transfer Labels
- Scope & Product Description
- Figure 9-1 | Heat Transfer Labels: Product Examples
- Characteristics & Applications
- Table | Heat Transfer Labels: Key Advantages & Disadvantages
- Demand by Material
- Table | Heat Transfer Label Demand by Material, 2010 - 2030
- Key Markets
- Trends in Printing Technology
- Suppliers & New Product Development
- Scope & Product Description
- Other Label Products
- Scope & Product Description
- Figure 10-1 | Other Label Products: Product Examples
- Demand by Material
- Table | Other Label Demand by Material, 2010 - 2030
- Product Trends
- Wraparound Labels
- Heat-Seal Labels
- Gummed Labels
- Foam Labels
- Key Markets
- Trends in Printing Technology
- Scope & Product Description
- Stock Materials
- Label Demand by Stock Material
- Table | Label Demand by Stock Material, 2010 - 2030
- Figure 11-1 | Label Demand by Stock Material, 2010 - 2030
- Paper Labels
- Scope & Product Description
- Figure 11-2 | Paper Labels: Leading Application Product Examples
- Demand by Application Method
- Table | Paper Label Demand by Application Method, 2010 - 2030
- Figure 11-3 | Paper Label Demand by Application Method, 2010 - 2030
- Key Markets
- Demand by Type (Roll, Sheet, Decal)
- Table | Paper Label Demand by Type, 2010 - 2030
- Leading Suppliers
- Scope & Product Description
- Plastic Labels
- Scope & Product Description
- Figure 11-4 | Plastic Labels: Leading Application Product Examples
- Demand by Application Method
- Table | Plastic Label Demand by Application Method, 2010 - 2030
- Figure 11-5 | Plastic Label Demand by Application Method, 2010 - 2030
- Key Markets
- Demand by Film Material
- Table | Plastic Label Demand by Film Material, 2010 - 2030
- Table | Major Label Resins: Advantages & Selected Applications
- Leading Suppliers
- Scope & Product Description
- Other Label Materials (Foil, Ceramic, Stainless Steel)
- Table | Other Label Materials Demand by Application, 2010 - 2030
- Figure 11-6 | Other Label Materials: Product Examples
- Label Demand by Stock Material
- Markets
- Label Demand by Market
- Table | Label Demand by Market, 2010 - 2030
- Figure 12-1 | Label Demand by Market, 2010 - 2030
- Primary Packaging Labels
- Market Scope
- Figure 12-2 | Primary Packaging Labels: Product Examples
- Demand by Application Method
- Table | Primary Packaging Label Demand by Application, 2010 - 2030
- Demand by Market Sector
- Table | Primary Packaging Label Demand by Market Sector, 2010 - 2030
- Figure 12-3 | Primary Packaging Label Demand by Sector, 2010 - 2030
- Food
- Table | Food Label Demand by Application Method, 2010 - 2030
- Figure 12-4 | Food Label Demand by Application Method, 2010 - 2030
- Beverages
- Table | Beverage Label Demand by Application Method, 2010 - 2030
- Figure 12-5 | Beverage Label Demand by Application Method, 2010 - 2030
- Pharmaceuticals
- Table | Pharmaceutical Label Demand by Application Method, 2010 - 2030
- Figure 12-6 | Pharmaceutical Label Demand by Application Method, 2010 - 2030
- Cosmetics & Toiletries
- Table | Cosmetics & Toiletries Label Demand by Application Method, 2010 - 2030
- Figure 12-7 | Cosmetics & Toiletries Label Demand by Application Method, 2010 - 2030
- Other Markets for Primary Packaging Labels
- Table | Other Primary Packaging Markets Label Demand by Application Method, 2010 - 2030
- Figure 12-8 | Other Primary Packaging Markets Label Demand by Application Method, 2010 - 2030
- Market Scope
- Secondary Packaging
- Market Scope
- Figure 12-9 | Secondary Packaging Labels: Product Examples
- Demand by Application Method
- Table | Secondary Packaging Label Demand by Application Method, 2010 - 2030
- Demand by Market Sector
- Table | Secondary Packaging Label Demand by Sector, 2010 - 2030
- Figure 12-10 | Secondary Packaging Label Demand by Sector, 2010 - 2030
- Retail Market
- Figure 12-11 | Retail Label Demand, 2010 - 2030
- Institutional, Transportation, & Distribution
- Figure 12-12 | Institutional, Transportation, & Distribution Label Demand, 2010 - 2030
- Market Scope
- Industrial Labels
- Market Scope
- Figure 12-13 | Industrial Labels: Product Examples
- Demand by Application Method
- Table | Industrial Label Demand by Application Method, 2010 - 2030
- Figure 12-14 | Industrial Label Demand by Application Method, 2010 - 2030
- Market Scope
- Mailing & Shipping Labels
- Market Scope
- Figure 12-15 | Mailing & Shipping Labels: Product Examples
- Demand by Application Method
- Table | Mailing & Shipping Label Demand by Application Method, 2010 - 2030
- Figure 12-16 | Mailing & Shipping Label Demand by Application Method, 2010 - 2030
- Market Scope
- Decorative Labels
- Market Scope
- Figure 12-17 | Decorative Labels: Product Examples
- Demand by Application Method
- Table | Decorative Label Demand by Application Method, 2010 - 2030
- Figure 12-18 | Decorative Label Demand by Application Method, 2010 - 2030
- Market Scope
- Consumer & Institutional
- Table | Consumer & Institutional Markets Demand by Application Method, 2010 - 2030
- Figure 12-19 | Consumer & Institutional Label Markets: Product Examples
- Label Demand by Market
- Printing Technologies
- Label Demand by Printing Technology
- Table | Printed Label Demand by Printing Technology, 2010 - 2030
- Figure 13-1 | Printed Label Demand by Printing Technology, 2010 - 2030
- Flexography
- Process Description
- Table | Flexographic Printing: SWOT Analysis
- Demand by Label Material & Application Method
- Table | Flexographic Label Demand by Label Material & Application Method, 2010 - 2030
- Figure 13-2 | Flexographic Label Demand by Label Material & Application Method, 2010 - 2030
- Process Description
- Lithography
- Process Description
- Table | Lithographic Printing: SWOT Analysis
- Demand by Label Material & Application Method
- Table | Lithographic Label Demand by Label Material & Application Method, 2010 - 2030
- Figure 13-3 | Lithographic Label Demand by Material & Application Method, 2010 - 2030
- Process Description
- Digital
- Process Description
- Table | Digital Printing: SWOT Analysis
- Demand by Label Material & Application Method
- Table | Digital Label Demand by Label Material & Application Method, 2020 - 2030
- Figure 13-4 | Digital Label Demand by Label Material & Application Method, 2010 - 2030
- Process Description
- Screen
- Process Description
- Table | Screen Printing: SWOT Analysis
- Demand by Label Material & Application Method
- Table | Screen Printed Label Demand by Label Material & Application Method, 2010 - 2030
- Figure 13-5 | Screen Printed Label Demand by Label Material & Application Method, 2010 - 2030
- Process Description
- Gravure
- Process Description
- Table | Gravure Printing: SWOT Analysis
- Demand by Label Material & Application Method
- Table | Gravure Label Demand by Label Material & Application Method, 2010 - 2030
- Figure 13-6 | Gravure Label Demand by Label Material & Application Method, 2010 - 2030
- Process Description
- Letterpress
- Process Description
- Table | Letterpress Printing: SWOT Analysis
- Demand by Label Material & Application Method
- Table | Letterpress Label Demand by Label Material & Application Method, 2010 - 2030
- Figure 13-7 | Letterpress Label Demand by Label Material & Application Method, 2010 - 2030
- Process Description
- Variable Information Printing
- Label Demand by Printing Technology
- Market Share & Key Suppliers
- Key Findings & Industry Composition
- Table | US Label Sales by Company, 2020
- Market Share
- Label Stock Producers
- Figure 14-1 | US Label Stock Market Share by Company, 2020
- Figure 14-2 | Label Stock Market Share: Leading Supplier, 2020
- Figure 14-3 | Label Stock Market Share: Second Leading Supplier, 2020
- Figure 14-4 | Label Stock Market Share: Co-Third Leading Supplier, 2020
- Figure 14-5 | Label Stock Market Share: Co-Third Leading Supplier, 2020
- Label Printers & Converters
- Figure 14-6 | US Finished Label Market Share by Company, 2020
- Figure 14-7 | Finished Label Market Share: Leading Supplier, 2020
- Figure 14-8 | Finished Label Market Share: Second Leading Supplier, 2020
- Figure 14-9 | Finished Label Market Share: Third Leading Supplier, 2020
- Figure 14-10 | Finished Label Market Share: Fourth Leading Supplier, 2020
- Label Stock Producers
- Mergers & Acquisitions
- Table | Selected Mergers & Acquisitions
- Competitive Strategies
- Table | Competitive Strategies in the US Labels Industry
- List of Industry Participants
- Table | Selected Industry Participants
- Key Findings & Industry Composition
- Appendix
- Scope
- Table | Relevant HS Codes
- Table | Relevant NAICS & SIC Codes
- Definitions
- Abbreviations
- Table | Abbreviation & Acronyms Used in Study
- Freedonia Methodology
- Study-Specific Methodology
- Sources
- Associations & Agencies
- Related Studies & Reports
- Macroeconomic Assumptions
- Economic Environment
- Table | Macroeconomic Indicators, 2010 - 2030
- Demographic Trends
- Table | Population & Households, 2010 - 2030
- Manufacturers' Shipments
- Table | Manufacturers' Shipments, 2010 - 2030
- Consumer Spending
- Table | Personal Consumption Expenditures, 2010 - 2030
- Business Establishments
- Table | Business Establishments, 2010 – 2030
- Economic Environment
- Scope
The US labels market is projected to expand 3.3% per year to $20.6 billion in 2025,accelerating from the pace seen during the 2015-2020 period, when average annual growth was affected by a 2020 decline in label demand that resulted from the COVID-19 pandemic.
Digital printing will expand at by far the fastest pace of any label printing technology through 2025, when it is expected to be replace lithography as the second most common printing method.
Heat shrink and stretch sleeve labels are expected to expand at an above average pace and will continue to take market share from glue-applied labels.