Table of Contents
EXECUTIVE SUMMARY
OVERVIEW
Key Findings
Historical Market Trends
Demand Forecast for Pipe
Key Drivers of Demand
Oil & Natural Gas Drilling
Hydraulic Fracturing
Status of Offshore Drilling & Environmentally Sensitive Drilling Areas
Keystone & Other Oil & Gas Pipelines
Keystone XL Pipeline
Other Oil & Gas Pipelines
Infrastructure Repair & Renovation
Highways
Water Infrastructure
Telecommunications
Water Conservation Efforts
Trade & Tariffs
Pricing Trends
Recycling
PIPE MARKETS
Key Findings
Pipe Demand Forecast by Market
Oil & Natural Gas
Oil & Natural Gas: Scope & Definitions
Oil & Natural Gas: Pipe Demand Forecast
Oil & Natural Gas: Pipe Demand by Material
Oil & Natural Gas: Plastic Pipe Demand by Resin
Oil & Natural Gas: Pipe Demand by Application
Crude Oil & Natural Gas Applications
Crude Oil
Natural Gas
Potable Water
Potable Water: Scope & Definitions
Potable Water: Pipe Demand Forecast
Potable Water: Pipe Demand by Material
Potable Water: Plastic Pipe Demand by Resin
Potable Water: Pipe Demand by Application
Applications & Demand Forecast
Water Transmission
Water Distribution
Other Potable Water
Storm & Sanitary Sewer
Storm & Sanitary Sewer: Scope & Definitions
Storm & Sanitary Sewer: Pipe Demand Forecast
Storm & Sanitary Sewer: Pipe Demand by Material
Storm & Sanitary Sewer: Plastic Pipe Demand by Resin
Storm & Sanitary Sewer: Pipe Demand by Application
Storm & Sanitary Sewer Applications
Storm Sewer
Sanitary Sewer
Conduit
Conduit: Scope & Definitions
Conduit: Pipe Demand Forecast
Conduit: Pipe Demand by Material
Conduit: Plastic Pipe Demand by Resin
Industrial Processing
Industrial Processing: Scope & Definitions
Industrial Processing: Pipe Demand Forecast
Industrial Processing: Pipe Demand by Material
Industrial Processing: Plastic Pipe Demand by Resin
Drain, Waste, & Vent
Drain, Waste, & Vent: Scope & Definitions
Drain, Waste, & Vent: Pipe Demand Forecast
Drain, Waste, & Vent: Pipe Demand by Material
Drain, Waste, & Vent: Plastic Pipe Demand by Resin
Irrigation
Irrigation: Scope & Definitions
Irrigation: Pipe Demand Forecast
Irrigation: Pipe Demand by Material
Irrigation: Plastic Pipe Demand by Resin
Structural & Mechanical
Structural & Mechanical: Scope & Definitions
Structural & Mechanical: Pipe Demand Forecast
Structural
Mechanical
Refrigerators, Air Conditioners, & Other Appliances (OEM & On-Site)
Transportation Equipment (OEM & Aftermarket)
Other Mechanical
Structural & Mechanical: Pipe Demand by Material
Structural & Mechanical: Plastic Pipe Demand by Resin
PIPE MATERIALS
Key Findings
Pipe Demand Forecast by Material
Pipe Material Forecasts
Market Value
Pounds
Linear Feet
Steel Pipe
Steel Pipe: Scope & Product Characteristics
Steel Pipe: Demand Forecast
Steel Pipe: Supply & Demand
Steel Pipe: Demand by Market
Steel Pipe: OCTG & Line Pipe
Steel Pipe: Market Share
Plastic Pipe
Plastic Pipe: Demand Forecast
Plastic Pipe: Demand by Market
Plastic Pipe: Market Share
Plastic Pipe: Demand by Resin
Resin Demand & Forecast
PVC
HDPE
PEX
Fiberglass
CPVC Pipe
ABS Pipe
Other Plastic Pipe
Copper Pipe
Copper Pipe: Scope & Products Characteristics
Copper Pipe: Demand Forecast
Copper Pipe: Demand by Market
Copper Pipe: Market Share
Concrete Pipe
Concrete Pipe: Scope & Product Characteristics
Concrete Pipe: Demand Forecast
Concrete Pipe: Demand by Market
Concrete Pipe: Market Share
Ductile Iron Pipe
Ductile Iron Pipe: Scope & Product Characteristics
Ductile Iron Pipe: Demand Forecast
Ductile Iron Pipe: Demand by Market
Ductile Iron Pipe: Market Share
Aluminum Pipe
Aluminum Pipe: Scope & Product Characteristics
Aluminum Pipe: Demand Forecast
Aluminum Pipe: Demand by Market
Aluminum Pipe: Market Share
Clay Pipe
Clay Pipe: Demand Forecast
Clay Pipe: Demand by Market
Clay Pipe: Market Share
Other Nonferrous Metal Pipe
Other Nonferrous Metal Pipe: Demand Forecast
Other Nonferrous Metal Pipe: Market Share
INDUSTRY STRUCTURE
Key Findings & Industry Composition
Market Share
Competitive Strategies
Horizontal Integration
Vertical Integration
Research & Development
Mergers & Acquisitions
Cooperative Agreements
Marketing
Distribution Channels
List of Industry Participants
APPENDIX
Scope
Definitions
Abbreviations
Freedonia Methodology
Study-Specific Methodology
Sources
Associations & Government Agencies
Related Studies & Reports
Macroeconomic Assumptions
Economic Environment
Demographic Trends
Building Construction
Residential Building Construction
Commercial Building Construction
Water & Sewer Spending
Water Use & Withdrawal
Public Highway Spending
Oil & Gas Industry Outlook
Agricultural Outlook
Refrigeration & HVAC Equipment
Plastic Resin Outlook
List of Tables
OVERVIEW
Table 2-1 | Pipe Demand, 2007 - 2027
Table 2-2 | Pipe Pricing by Material, 2007 - 2027
PIPE MARKETS
Table 3-1 | Pipe Demand by Market, 2007 - 2027 (million dollars)
Table 3-2 | OCTG & Line Pipe Applications & Definitions
Table 3-3 | Oil & Natural Gas Pipe Demand by Material, 2007 - 2027 (million dollars)
Table 3-4 | Plastic Oil & Natural Gas Pipe Demand by Resin, 2007 - 2027 (million dollars)
Table 3-5 | Oil & Natural Gas Pipe Demand by Application, 2007 - 2027 (million dollars)
Table 3-6 | Crude Oil Pipe Demand by Material, 2007 - 2027 (million dollars)
Table 3-7 | Natural Gas Pipe Demand by Material, 2007 - 2027 (million dollars)
Table 3-8 | Potable Water Applications & Definitions
Table 3-9 | Potable Water Pipe Demand by Material, 2007 - 2027 (million dollars)
Table 3-10 | Plastic Potable Water Pipe Demand by Resin, 2007 - 2027 (million dollars)
Table 3-11 | Potable Water Pipe Demand by Application, 2007 - 2027 (million dollars)
Table 3-12 | Water Transmission Pipe Demand by Material, 2007 - 2027 (million dollars)
Table 3-13 | Water Distribution Pipe Demand by Material, 2007 - 2027 (million dollars)
Table 3-14 | Other Potable Water Pipe Demand by Material, 2007 - 2027 (million dollars)
Table 3-15 | Storm & Sanitary Sewer Pipe Demand by Material, 2007 - 2027 (million dollars)
Table 3-16 | Plastic Storm & Sanitary Sewer Pipe Demand by Resin, 2007 - 2027 (million dollars)
Table 3-17 | Storm & Sanitary Sewer Pipe Demand by Application, 2007 - 2027 (million dollars)
Table 3-18 | Storm Sewer Pipe Demand by Material, 2007 - 2027 (million dollars)
Table 3-19 | Sanitary Sewer Pipe Demand by Material, 2007 - 2027 (million dollars)
Table 3-20 | Conduit Pipe Demand by Material, 2007 - 2027 (million dollars)
Table 3-21 | Plastic Conduit Pipe Demand by Resin, 2007 - 2027 (million dollars)
Table 3-22 | Industrial Processing Pipe Demand by Material, 2007 - 2027 (million dollars)
Table 3-23 | Plastic Industrial Processing Pipe Demand by Resin, 2007 - 2027 (million dollars)
Table 3-24 | Drain, Waste, & Vent Pipe Demand by Material, 2007 - 2027 (million dollars)
Table 3-25 | Plastic Drain, Waste, & Vent Pipe Demand by Resin, 2007 - 2027 (million dollars)
Table 3-26 | Irrigation Pipe Demand by Material, 2007 - 2027 (million dollars)
Table 3-27 | Plastic Irrigation Pipe Demand by Resin, 2007 - 2027 (million dollars)
Table 3-28 | Structural & Mechanical Pipe Demand by Application, 2007 - 2027 (million dollars)
Table 3-29 | Structural & Mechanical Pipe Demand by Material, 2007 - 2027 (million dollars)
Table 3-30 | Plastic Structural & Mechanical Pipe Demand by Resin, 2007 - 2027 (million dollars)
PIPE MATERIALS
Table 4-1 | Pipe Demand by Material, 2007 - 2027 (million dollars)
Table 4-2 | Pipe Demand by Material, 2007 - 2027 (million pounds)
Table 4-3 | Pipe Demand by Material, 2007 - 2027 (million linear feet)
Table 4-4 | Steel Pipe Demand, 2007 - 2027
Table 4-5 | Steel Pipe Supply & Demand, 2007 - 2027 (million dollars)
Table 4-6 | Steel Pipe Demand by Market, 2007 - 2027 (million dollars)
Table 4-7 | Steel Pipe Markets: Major Applications, Drivers, & Restraints
Table 4-8 | Steel Oil & Natural Gas Pipe Demand, 2007 - 2027 (million dollars)
Table 4-9 | Plastic Pipe Demand, 2007 - 2027
Table 4-10 | Plastic Pipe Demand by Market, 2007 - 2027 (million dollars)
Table 4-11 | Plastic Pipe Markets: Major Applications, Drivers, & Restraints
Table 4-12 | Plastic Pipe Demand by Resin, 2007 - 2027 (million dollars)
Table 4-13 | PVC Pipe Demand by Market, 2007 - 2027
Table 4-14 | PVC Pipe: Performance Against Competitive Materials by Market
Table 4-15 | HDPE Pipe Demand by Market, 2007 - 2027
Table 4-16 | HDPE Pipe: Performance Against Competitive Materials by Market
Table 4-17 | PEX Pipe Demand by Market, 2007 - 2027
Table 4-18 | PEX Pipe: Performance Against Competitive Materials by Market
Table 4-19 | Fiberglass Pipe Demand by Market, 2007 - 2027
Table 4-20 | Fiberglass Pipe: Performance Against Competitive Materials by Market
Table 4-21 | CPVC Pipe Demand by Market, 2007 - 2027 (million dollars)
Table 4-22 | CPVC Pipe: Performance Against Competitive Materials by Market
Table 4-23 | ABS Pipe Demand by Market, 2007 - 2027 (million dollars)
Table 4-24 | ABS Pipe: Performance Against Competitive Materials by Market
Table 4-25 | Other Plastic Pipe Demand by Resin & Market, 2007 - 2027
Table 4-26 | Copper Pipe Demand, 2007 - 2027
Table 4-27 | Copper Pipe Demand by Market, 2007 - 2027 (million dollars)
Table 4-28 | Concrete Pipe Demand, 2007 - 2027
Table 4-29 | Concrete Pipe Demand by Market, 2007 - 2027 (million dollars)
Table 4-30 | Ductile Iron Pipe Demand, 2007 - 2027
Table 4-31 | Ductile Iron Pipe Demand by Market, 2007 - 2027 (million dollars)
Table 4-32 | Aluminum Pipe Demand, 2007 - 2027
Table 4-33 | Aluminum Pipe Demand by Market, 2007 - 2027 (million dollars)
Table 4-34 | Aluminum Pipe Markets: Major Applications, Drivers, & Restraints
Table 4-35 | Clay Pipe Demand by Market, 2007 - 2027
Table 4-36 | Other Nonferrous Metal Pipe Demand by Market, 2007 - 2027
INDUSTRY STRUCTURE
Table 5-1 | US Pipe Sales by Company, 2017 (million dollars)
Table 5-2 | Selected Acquisitions & Divestitures
Table 5-3 | Selected Cooperative Agreements
APPENDIX
Table 6-1 | Relevant NAICS & SIC Codes
Table 6-2 | Relevant HS Codes
Table 6-3 | Abbreviations & Acronyms Used in Study
Table 6-4 | Macroeconomic Indicators, 2007 - 2027 (billion 2009 dollars)
Table 6-5 | Population & Households, 2007 - 2027 (million persons)
Table 6-6 | Building Construction Expenditures, 2007 - 2027 (billion dollars)
Table 6-7 | Residential Building Construction Expenditures, 2007 - 2027 (billion dollars)
Table 6-8 | Commercial Building Construction Expenditures, 2007 - 2027 (billion dollars)
Table 6-9 | Water & Sewer Expenditures, 2007 - 2027
Table 6-10 | Water Use & Withdrawal, 2007 - 2027 (trillion gallons/year)
Table 6-11 | Public Highway Spending, 2007 - 2022 (billion dollars)
Table 6-12 | Oil & Gas Production & Consumption, 2007 - 2027
Table 6-13 | Agricultural Indicators. 2007 - 2027
Table 6-14 | Refrigeration & HVAC Shipments, 2007 - 2027
Table 6-15 | Plastic Resin Supply & Demand, 2007 - 2027 (million pounds)
List of Figures
EXECUTIVE SUMMARY
Figure 1-1 | US Pipe Market
OVERVIEW
Figure 2-1 | Key Trends in the US Pipe Market
Figure 2-2 | Pipe Demand, 2007 - 2017 (million dollars)
PIPE MARKETS
Figure 3-1 | Key Trends in Pipe Markets in the US
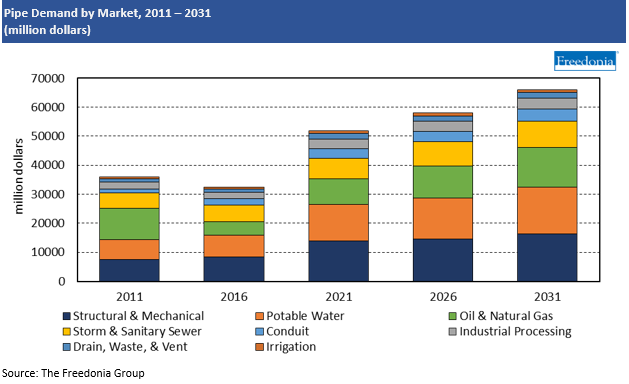
Figure 3-2 | Pipe Demand by Market, 2017 - 2022 (million dollars)
Figure 3-3 | Oil & Natural Gas Pipe Demand, 2007 - 2022 (million pounds)
Figure 3-4 | Oil & Natural Gas Pipe Demand Share by Application, 2017 (billion dollars)
Figure 3-5 | Potable Water Pipe Demand, 2007 - 2022 (million dollars)
Figure 3-6 | Potable Water Pipe Value & Length Demand Share by Application, 2017
Figure 3-7 | Storm & Sanitary Sewer Pipe Demand, 2007 - 2022 (million dollars)
Figure 3-8 | Storm & Sanitary Sewer Pipe Demand Share by Application, 2017 (billion dollars)
Figure 3-9 | Conduit Pipe Demand, 2007 - 2022 (million dollars)
Figure 3-10 | Industrial Processing Pipe Demand, 2007 - 2022 (million dollars)
Figure 3-11 | Drain, Waste, & Vent Pipe Demand, 2007 - 2022 (million dollars)
Figure 3-12 | Irrigation Pipe Demand, 2007 - 2022 (million linear feet)
Figure 3-13 | Structural & Mechanical Pipe Demand, 2007 - 2022 (million dollars)
PIPE MATERIALS
Figure 4-1 | Key Trends in Pipe Materials in the US
Figure 4-2 | Average Pipe Weight Versus Length, 2017 (pounds per foot)
Figure 4-3 | Pipe Demand Share by Material, 2007 - 2027 (million dollars)
Figure 4-4 | Pipe Demand Share by Material, 2007 - 2027 (million pounds)
Figure 4-5 | Pipe Demand Share by Material, 2007 - 2027 (million linear feet)
Figure 4-6 | US Steel Pipe Market Share, 2017 (billion dollars)
Figure 4-7 | US Plastic Pipe Market Share, 2017 (billion dollars)
Figure 4-8 | Plastic Pipe Demand Share by Resin, 2017 (billion dollars)
Figure 4-9 | Copper Pipe Demand Share by Market, 2017 (billion dollars)
Figure 4-10 | US Copper Pipe Market Share, 2017 (billion dollars)
Figure 4-11 | Concrete Pipe Demand Share by Market, 2017 (billion dollars)
Figure 4-12 | US Concrete Pipe Market Share, 2017 (billion dollars)
Figure 4-13 | Ductile Iron Pipe Demand Share by Market, 2017 (billion dollars)
Figure 4-14 | US Ductile Iron Pipe Market Share, 2017 (billion dollars)
Figure 4-15 | US Aluminum Pipe Market Share, 2017 (billion dollars)
Figure 4-16 | Clay Pipe Demand Share by Market, 2017 (million dollars)
Figure 4-17 | Other Nonferrous Metal Pipe Demand by Market, 2017 (million dollars)
Figure 4-18 | US Other Nonferrous Pipe Market Share, 2017 (million dollars)
INDUSTRY STRUCTURE
Figure 5-1 | US Pipe Market Share, 2017 (billion dollars)
Figure 5-2 | US Pipe Market: Leading Supplier
Figure 5-3 | US Pipe Market: Second Leading Supplier
Figure 5-4 | US Pipe Market: Third Leading Supplier
Figure 5-5 | US Pipe Market: Fourth Leading Supplier
APPENDIX
Figure 6-1 | Annual Growth in Real GDP, 2000 - 2017, Compared to 1980 - 2005 Average (percent)
Figure 6-2 | Annual Population Growth, 2002 - 2017 (percent)
© by The Freedonia Group, a division of MarketResearch.com