Skip navigation
Reports & Analysis Custom Research Research Subscriptions
Sign In / Create Account Cart
  • Reports & Analysis
  • Custom Research
  • Research Subscriptions

Resources

  • Analyst Buzz
  • Press Releases
  • Blog
  • Resources & Downloads

The Freedonia Group

  • Contact
  • About
  • Our Staff
  • Help Center
  • Career Opportunities
Freedonia Market Research Freedonia Group Global Water Treatment Equipment & Chemicals

Global Water Treatment Equipment & Chemicals

Industry Reports, Global

Report Overview

Get the answers about sustainability and more in this study.

  • Wastewater being treated to meet environmental standards

  • Treatment of wastewater so that it is potable

  • Important new regulations

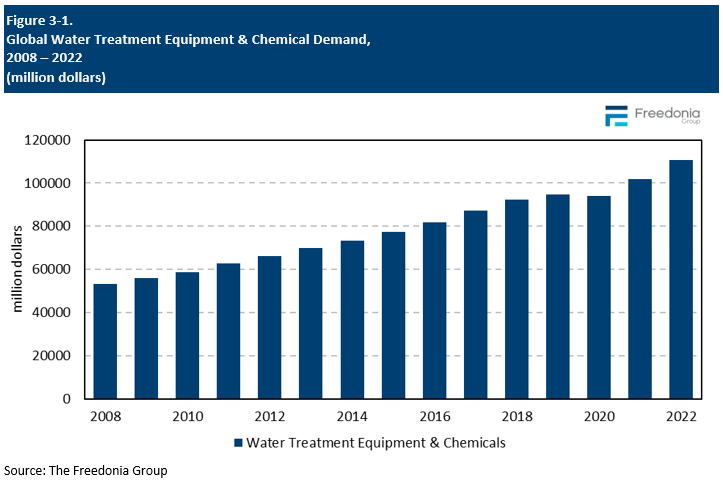
This Freedonia industry study analyzes the $11.1 billion global water treatment equipment and chemicals industry. It presents historical demand data (2.12, 2017, and 2022) and forecasts (2027 and 2032) by product (membrane equipment, conventional filtration, disinfection equipment, chemicals), market (municipal applications, manufacturing applications, consumer and commercial applications, utilities and all other applications). The study also evaluated company market share and competitive analysis on industry competitors including Ecolab, Danaher, Kemira, Kurita Water Industries, SNF, Solensis, and Veolia Environmental).

Featuring 281 tables and 124 figures – available in Excel and Powerpoint! Learn More

Table of Contents

    • $310.50

    • $310.50

      • $310.50

      • $310.50

      • $310.50

    • $620.68

      • $310.50

      • $310.50

      • $310.50

      • $310.50

        • $310.50

        • $310.50

        • $310.50

      • $310.50

      • $310.50

    • $381.23

      • $310.50

      • $310.50

      • $310.50

      • $310.50

      • $310.50

        • $310.50

        • $310.50

        • $310.50

      • $310.50

        • $310.50

        • $310.50

      • $310.50

        • $310.50

        • $310.50

        • $310.50

    • $610.88

      • $310.50

      • $310.50

      • $339.74

        • $310.50

        • $310.50

        • $310.50

      • $310.50

      • $310.50

    • $1,450.06

      • $310.50

      • $310.50

      • $1,182.86

        • $310.50

        • $310.50

        • $310.50

        • $310.50

        • $310.50

        • $310.50

        • $310.50

        • $310.50

        • $310.50

      • $310.50

      • $310.50

    • $612.17

      • $310.50

      • $310.50

      • $350.24

        • $310.50

        • $310.50

        • $310.50

      • $310.50

      • $310.50

    • $895.16

      • $310.50

      • $310.50

      • $622.81

        • $310.50

        • $310.50

        • $310.50

        • $310.50

        • $310.50

      • $310.50

      • $310.50

    • $833.65

      • $310.50

      • $310.50

      • $535.19

        • $310.50

        • $310.50

        • $310.50

        • $310.50

        • $310.50

      • $310.50

      • $310.50

    • $712.22

      • $310.50

      • $310.50

      • $432.07

        • $310.50

        • $310.50

        • $310.50

        • $310.50

      • $310.50

      • $310.50

    • $798.73

      • $310.50

      • $310.50

      • $547.17

        • $310.50

        • $310.50

        • $310.50

        • $310.50

        • $310.50

      • $310.50

      • $310.50

    • $343.61

      • $310.50

      • $310.50

      • $310.50

      • $310.50

      • $310.50

    • $875.46

      • $310.50

      • $310.50

      • $699.20

        • $310.50

        • $310.50

        • $310.50

        • $310.50

        • $310.50

        • $310.50

      • $310.50

      • $310.50

    • $1,802.26

      • $310.50

      • $310.50

      • $310.50

      • $310.50

      • $497.50

        • $310.50

        • $310.50

        • $310.50

        • $310.50

      • $447.65

        • $310.50

        • $310.50

        • $310.50

        • $310.50

      • $424.84

        • $310.50

        • $310.50

        • $310.50

        • $310.50

    • $1,273.75

      • $310.50

      • $310.50

      • $310.50

      • $310.50

      • $405.65

        • $310.50

        • $310.50

        • $310.50

        • $310.50

      • $436.06

        • $310.50

        • $310.50

        • $310.50

        • $310.50

    • $3,127.15

      • $310.50

      • $310.50

      • $310.50

      • $310.50

      • $468.19

        • $310.50

        • $310.50

        • $310.50

        • $310.50

      • $457.76

        • $310.50

        • $310.50

        • $310.50

        • $310.50

      • $483.78

        • $310.50

        • $310.50

        • $310.50

        • $310.50

      • $444.56

        • $310.50

        • $310.50

        • $310.50

        • $310.50

      • $424.90

        • $310.50

        • $310.50

        • $310.50

        • $310.50

      • $420.41

        • $310.50

        • $310.50

        • $310.50

        • $310.50

    • $1,260.35

      • $310.50

      • $310.50

      • $310.50

      • $310.50

      • $425.04

        • $310.50

        • $310.50

        • $310.50

        • $310.50

      • $430.19

        • $310.50

        • $310.50

        • $310.50

        • $310.50

    • $3,188.02

      • $310.50

      • $310.50

      • $310.50

      • $310.50

      • $496.34

        • $310.50

        • $310.50

        • $310.50

        • $310.50

      • $459.49

        • $310.50

        • $310.50

        • $310.50

        • $310.50

      • $480.95

        • $310.50

        • $310.50

        • $310.50

        • $310.50

      • $427.10

        • $310.50

        • $310.50

        • $310.50

        • $310.50

      • $405.58

        • $310.50

        • $310.50

        • $310.50

        • $310.50

      • $484.56

        • $310.50

        • $310.50

        • $310.50

        • $310.50

    • $1,259.12

      • $310.50

      • $310.50

      • $310.50

      • $310.50

      • $393.85

        • $310.50

        • $310.50

        • $310.50

        • $310.50

      • $459.89

        • $310.50

        • $310.50

        • $310.50

        • $310.50

    • $1,395.18

      • $310.50

      • $310.50

        • $310.50

        • $310.50

      • $310.50

      • $310.50

      • $769.93

    • $1,692.16

      • $310.50

      • $310.50

      • $310.50

      • $310.50

      • $310.50

      • $310.50

      • $310.50

      • $310.50

      • $310.50

      • $310.50

      • $865.73

        • $310.50

        • $310.50

        • $310.50

        • $310.50

Play Video: Global Water Treatment Equipment & Chemicals

Check out the blog: 

Water Treatment Worldwide – Processes and Scarcity

Global demand for water treatment equipment and chemicals is projected to rise 3.1% yearly to $129 billion in 2027. Market value growth will be boosted by gains in real terms, driven by:
  • rising demand among industrializing countries for high quality process and supply water for manufacturing industries
  • increasingly stringent drinking water and wastewater regulations, notably in lower income countries
  • repair and renovation of older municipal water systems in mature economies
  • increasing water reuse and recycling from extractive industries such as oil and gas production and mining
Market value growth will also be supported by rising standards for process and supply water, which will require the use of higher value filtration technologies and better performing chemicals.

Demand for High-Quality Process & Supply Water in Manufacturing to Drive Growth

Demand for water treatment equipment and chemicals in the low- and middle-income countries in the Asia/Pacific and Africa/Mideast regions has historically been low, particularly in the manufacturing sector. However, meeting the stringent product standards of their trade partners in more developed countries is spurring the use of water treatment equipment and chemicals. In particular, advanced membrane systems and higher-quality chemicals are seeing greater levels of use. As a result, manufacturing applications – including food and beverages, chemicals, and pharmaceuticals – are expected to see the fastest growth through 2027 and will continue to take share from other markets.

Water Scarcity Will Support Water Recycling & Reuse

UNICEF has projected that as much as half of the global population may be living in regions facing water scarcity by 2025. While a majority of the world’s water – about 70% – is used for agricultural applications, nearly 20% is used for industrial purposes. As a result, there are growing pressures on manufacturers to recycle and reuse wastewater as process and supply water to reduce the stress on already taxed supplies. Membrane filtration systems and chemicals – such as corrosion inhibitors and coagulants and flocculants – will particularly benefit, due to the relatively low cost as compared to large equipment replacement projects.

Historical Market Trends

The size of the market for water treatment equipment and chemicals in specific countries depends on a number of variables, including:
  • population
  • the size and types of industries active in the country
  • climate, which may or may not lend itself to the use of pools and spas
  • environmental regulations pertaining to water quality and wastewater treatment
  • the relative affluence of the country
Although the need for safe, clean water is universal, the means by which it is obtained are not. Safe, clean water requires significant investment in the development of water sources; treatment facilities, equipment, chemicals, and personnel; supply infrastructure; and sanitation/wastewater treatment systems. As a result, the amount of money spent on water treatment products tends to be far greater in wealthier countries than in less affluent areas. Additionally, the presence of manufacturing industries that require high levels of water purity (such as food and beverage processing and pharmaceutical production), increase water treatment demand.

In general, healthy economic trends support increased sales of water treatment equipment and chemicals. For instance, rising production of goods such as food and beverages or pharmaceuticals requires increasing volumes of water, as well as producing greater amounts of wastewater.

During the height of the COVID-19 pandemic in 2020, demand for water treatment equipment and chemicals declined slightly. Water usage by manufacturers fell as stay-at-home orders forced the closure of “nonessential” production. These closures also led to a decline in wastewater production. Stay-at-home orders and the closure of borders to international travel had a negative impact on hotels, resorts, restaurants, and other facets of the hospitality industry, resulting in reduced water use in the commercial sector.

Consumer water treatment products were one of the few markets that benefited from the pandemic. Worries regarding the safety of potable water and fears of viral contamination boosted demand for consumer whole house water treatment equipment and chemicals, while pool and spa installations surged due to homeowners looking to improve their environments during stay-at-home periods.

Demand grew in 2021 and 2022 as manufacturing activity rebounded and populations returned to in-person work and other activities to some extent. In addition, pricing for equipment rose at an above average rate in 2022 while chemical pricing jumped in 2021 and 2022, the result of disruptions in the global supply chain, rising raw material costs, and a rise in transportation costs.

Figure showing Global Water Treatment Equipment & Chemical Demand, 2008 – 2022 (million dollars)

Pricing & Real Growth

Prices for water treatment equipment and chemicals vary widely, given the variety of product types, material sources, and product sizes. Prices also vary by type, application, and volume, among other variables, such as geographic location.

Water and sanitation are recognized by the United Nations General Assembly as basic human rights. However, water is a limited and non-renewable resource. As such, less than ideal water sources ‒ including wastewater ‒ will increasingly be used. Major consumers will need to upgrade their water treatment infrastructure or face the economic and population impacts that result from a lack of water. Therefore, pricing is a critical issue for water treatment equipment and chemical suppliers, as often users such as municipalities or manufacturers have limited resources to fund water treatment.

Many of the chemicals used in water treatment are commodity products, including sodium hypochlorite, sodium hydroxide, and nitric acid. However, more advanced chemicals, such as cationic polychloride flocculants and specialty surfactants, are also widely used even at a higher price point. Prices for filtration equipment also vary widely:
  • Conventional filtration often utilizes less expensive commodity materials including sand, gravel, and charcoal.
  • Membrane filtration utilizes porous materials to remove very small particles that would not be removed using conventional filtration.
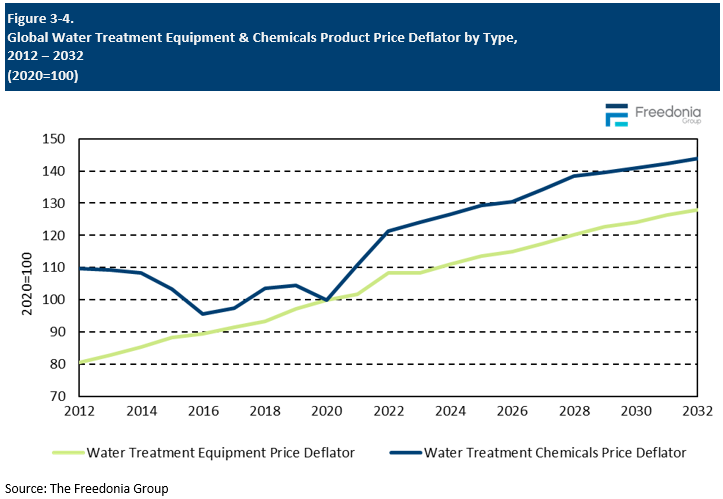
During the previous period, pricing for both water treatment equipment and chemicals saw fairly healthy growth. In 2021 and 2022, chemical prices surged as manufacturing activity rebounded from a pandemic-related decline, with rising crude oil prices, supply chain issues, and raw material shortages further impacting pricing. While equipment prices rose modestly in 2021, the same supply chain issues that impacted chemicals caused prices to rise over 6% in 2022.

In real terms, demand for water treatment equipment and chemicals is expected to increase an average of 1.3% per year through 2027. Growth in real terms will be driven by:
  • output from key manufacturing markets such as pharmaceuticals, food and beverage, and chemical processing continues to rise
  • access to treated water supplies and wastewater treatment increases in countries with less developed water infrastructure

Figure showing Global Water Treatment Equipment & Chemicals Product Price Deflator by Type, 2012 ‒ 2032 (2020=100)

Municipal Water Treatment

Market Scope

Municipal water systems are involved in the supply of water – including that for drinking, bathing, cooking, toilet operation, laundry, and lawn and garden upkeep – and/or the disposal of wastewater. Municipal water includes the supply of water and the treatment of wastewater by public utilities. Although water may be further treated by consumers, only treatment received at municipal treatment facilities is included here.

Those who do not have access to municipal water supplies (e.g., users of well water) or self-supplied users (e.g., those who pull water directly from lakes, rivers, and oceans for direct use in industrial processes) are excluded from this market and are included in the consumer and commercial segment.

Municipal water is utilized for a variety of purposes by a broad range of consumers, such as households and commercial establishments (e.g., hotels and restaurants). Commercial users, in general, tend to consume considerably higher volumes of water than Consumer users, even though many of the end applications for water are similar. Users in manufacturing and other markets may also draw water from municipal sources.

The municipal wastewater segment includes the treatment of all water discharged to a municipal sewer system, which must be treated to meet health and environmental standards before it reenters the environment. Industrial users of municipal water supplies may treat wastewater on their own before disposing of it directly to the environment; these applications are excluded from the municipal market and are included in relevant manufacturing or other markets.
Purchase Options

Purchase Report

Select your license:

  • $6,800.00
  • $8,300.00
  • $9,800.00
  • — —
    Section prices in Table of Contents

Free Sample Report

A free sample report is available.

Subscription Options

License by subscription

Check to see if this report is available through our subscription services.

Subscription Pricing
Already have a subscription? Log in.

Questions & Assistance

Email us

Share This Report

Copied to clipboard. Could not copy to clipboard.

Download a Free Sample Report Now

Sample Reports include examples of all the tables, charts, infographics and topics included in this study.
By submitting this sample request you consent to receiving marketing communications from us. See our privacy policy to learn how to unsubscribe.

Use Licenses

The Single User License (SUL) authorizes a single individual to use the electronic study acquired. Agreement to the SUL is required in order to purchase the study. If you require more than one user a Departmental Site License or Global Site License should be purchased. 

The Departmental Site License (DSL) authorizes up to five users to share the study acquired. Agreement to the DSL is required in order to purchase the study. If your organization requires more than five users, the Global Site License should be purchased.

The Global Site License (GSL) allows everyone in your organization to share the study intelligence. Agreement to the Global Site License terms is necessary in order to purchase it. 

FAQs

One of the most important factors in regional demand levels and market growth for water treatment products is variations in population density and growth among regions and countries.
Global demand for water treatment equipment and chemicals is projected to rise 3.1% per year to $129 billion in 2027.
Water treatment is the process of removing impurities, contaminants, and other potentially harmful substances from water to make it safe and suitable for various purposes, such as drinking, irrigation, industrial processing, and wastewater discharge. The process can involve a series of physical, chemical, and biological treatment steps that aim to remove suspended solids, organic and inorganic compounds, bacteria, viruses, and other pathogens from the water. Primary water treatment processes include filtration, coagulation, and disinfection.
There are hundreds of participants worldwide. The top four suppliers are Danaher, Veolia Environnement, Ecolab, and Pentair.
;

Related Reports and Studies

  • Global Filters

    Industry Reports

    This Freedonia industry analyzes the $90 billion global market for filters. It presents historical supply and demand data (2013, 2018, and 2023) and forecasts (2028 and 2023), as well as annual data for the 2020-2027 period.

    April 2024 582 pages
    Free sample available
  • Global Plastic Potable Water Pipe

    Industry Reports

    Plastic potable water pipe comprises all of the systems required to deliver safe drinking water and potable-quality water for other uses, such as fire suppression and radiant flooring.

    December 2020 108 pages
    Free sample available
  • Consumer Water Treatment

    Industry Reports

    This study covers the United States consumer market for water treatment systems primarily designed to decrease the amount of contaminants and minerals in households’ water. Systems purchased by consumers for personal use outside of the home (e.g., during leisure activities, pleasure, work, or school) are also considered, as are consumables, such as replacement filters, membranes, and salt.

    March 2021 211 pages
    Free sample available
  • Global Consumer Water Treatment Products

    Industry Reports

    Demand for consumer water treatment products – including systems and replacement parts – is expected to grow 8.4% per year through 2025 to $34 billion.

    January 2022 398 pages
    Free sample available
  • Global Water Infrastructure Pumps

    Industry Reports

    Global demand for pumps in the water infrastructure market is forecast to increase 3.4% per year to $13.5 billion in 2026, driven by ongoing investment in utilities infrastructure in industrializing countries.

    May 2022 144 pages
    Free sample available
  • US Pipe Products & Markets

    Industry Reports

    This study analyzes the US pipe industry. Historical data (2013, 2018, and 2023) and forecasts for the years 2028 and 2033.

    October 2024 312 pages
    Free sample available
  • US Drain, Waste & Vent (DWV) Pipe

    Industry Reports

    October 2020 59 pages
View More

Have unique research needs?

Freedonia Custom Research listens intently to your needs and objectives. Then we work diligently to define a service offering to meet them.
Learn About Our Custom Research Services

Stay informed with Freedonia

Receive periodic updates about new market research in areas relevant to your business. Have the convenience of Freedonia research at your fingertips when you need it.
The Freedonia Group needs the contact information you provide to us to contact you about our products and services. You may unsubscribe from these communications at any time. For information on how to unsubscribe, as well as our privacy practices and commitment to protecting your privacy, please review our Privacy Policy.
  • Contact
  • About
  • Help Center
  • Career Opportunities
  • Press Contact
  • User Agreement
  • Privacy Policy
  • Site Map

Additional Resources

  • Market Size Resources
  • Lawn & Garden Market Research
  • Roofing Market Research
  • Pet Products Market Research
  • Countertops Market Research
  • Power Tools Market Research
  • Publishing for the PreK-12 Market Research
  • Insulation Market Resaerch
  • Cabinets Market Research
  • Flooring Market Research
  • Pet Supplements Market Research
  • Agricultural Equipment Market Research
  • Open Access Publishing Market Research
  • Silicones Market Research
  • For Legal Inquiries, contact Cohen & Cohen
Copyright © 2025 The Freedonia Group, Inc. All rights reserved.